Big Data Analytic of Nigeria Population Census Data
using MapReduce and K-Means Algorithm
Akande Oyebola
Computer Science Department Babcock University Ilishan Remo, Ogun State, Nigeria
Osofisan Adenike
Computer Science Department University of Ibaban Ibadan, Oyo State, Nigeria
ABSTRACT
Mining of big data brings out hidden knowledge that medium size and sample data cannot reveal. This research analyzed Nigeria Population Census data in order to bring forth knowledge that can aid Government in social-economic decision-making. Thus, k-means algorithm, which is an unsupervised learning technique, was implemented on MapReduce with the aim of discovering knowledge from Priority Table IX of Nigeria Census Data of 2005. MapReduce was used to aid k-means computational challenges such as Euclidean distance computation, minimum sum of square error (MSSE) computation and global objective computation effectively. The big data analytics revealed local government areas that need Government Intervention in terms of low cost housing and those local governments that need urban restructuring for good distribution of population. Further work can be done by implementing other data such as malaria data of children to reveal hidden pattern and knowledge.
Keywords
k-means, MapReduce, Euclidean distance, MSSE, Global Objective Function.
1.
INTRODUCTION
Big data technology involves growing scale of data or complexities of data that can be stored and analyzed through data intensive and/or computational intensive technologies using machine learning or artificial intelligence techniques in order to acquire hidden unknown knowledge from data. There are several importance of big data analysis such as providing possibility of discovering subtle patterns, which are not possible with small-scale data [1].It helps enterprise to have a more insightful understanding of their business in order to have better innovation, enhanced productivity, and stronger competitive power [2]. In addition, manufacturing industry uses big data to reveal usage pattern, failure rates, and gives insight into product improvement [2]. This research uses big data analytics to reveal hidden knowledge that can aid Federal Government of Nigeria to make effective social-economic decision through census data on household.
This research uses k-means clustering technique because though it is a traditional algorithm, it can categorise data naturally, thus producing reliable grouping result. In addition, the interest of this research is in finding previously unknown knowledge (apriori knowledge), which can only be discovered through unsupervised learning. However, one of the challenges of k-means is that it has computational complexity in terms of time when handling big data. Thus, for this reason k-means was implemented on MapReduce framework.
MapReduce framework is a parallel processing framework that parallelizes both data and computation. It consists of both map phase and reduce phase. K-means implementation on MapReduce can aid k-means to scale well with big data and handles its computations such as Euclidean distance computation, minimum sum of square error (MSSE) computation and global objective computation effectively. Euclidean distance computes data distance from each centroid and places each data to its closest centroid. Computation of k-means MSSE on MapReduce framework on Hadoop platform gives intra- or within convergence, that is the MSSE. It indicates degree of similarity of data within a cluster. Computation of global objective function determines when to terminate k-means iteration on MapReduce framework. It is also known as inter-cluster convergence. It indicates degree of dissimilarity among clusters.
Thus, this research uses MapReduce to solve both data intensive challenge and computational complexity that arises in k-means when it handles big data. Section 2 discussed some related works, section 3 contained the methodology, and section 4 presented the results and their interpretation that brings out knowledge
.
2.
RELATED WORKS
[3] described the case of applying data mining techniques in Bank of America (BofA). BofA consulted Hyperparallel (a data mining company that has now been absorbed into Yahoo!) researchers who classified the bank customers into those who have obtained home equity or those who have not using decision tree algorithm. K-means algorithm was finally applied on customers who have obtained home equity to discover events that always preceeded asking for a loan in the past. K-means result discovered that 39 percent of customers who had home loans also have a business of their own. Therefore, Bank of America changed its advertisement about home loan from “Use the value of your home to send your kids to school” to “Use the value of your home to do what you always wanted to do”.
k-means like [4] did, but this current research applied k-k-means on MapReduce framework.
[5] analyzed students learning behaviours’, learning characteristics and learning pattern on Learning Management System, a medium for course delivery for both on-campus and distance learning students. The analysis predicted learning outcomes based on their final grades. Nvivo 9, was used for the clustering analysis which provides a description of the students’ final grade by their online theme questions, while ordinal logistic regression on SPSS 17.0 predicts relationship between students final grade and online theme questions. The clustering result grouped all the questions into four, and the questions relating to learning and comprehension has the least occurrence. The predictive analysis revealed that questions relating to learning and comprehension is a major determinant of students’ final grade in a course. The limitation of [5] was that the authors used Nvivo 9 that took a long process to cluster student behaviour instead of MapReduce, which can automatically cluster unstructured data without taken a long process.
The aim of [6] was to predict students who are at risk of poor performance. The authors identified factors influencing students perfromance and used data mining approach to predict the students who were at risk. The data mining tools used were decision tree, Naïve Bayes, SMO, J48, REPTree and Multi Layer Perception. Decision tree provided a visual interpretation of the dataset, while the other classification algorithm were seperately used to predict students’ performance. It was found that Multi Layer Perception had the highest level of accuracy (72.3%) in predicting students’ perfromance and the factors affecting their perfromance. It was also found that parent’s occupation is a major determinant in predicting students grade. This helped schools to give timely advice before examination. The limitation of the work was that other factors which may affect students’ performance such as students psychological factors, and motivational efforts by teachers were not considered. In addition, the authors used WEKA which is a non-distributed platform but this current research used k-means on MapReduce framework which is a distributed platform, and Microsoft Excel graphical representation as visualization tool to interprete the data mining result.
[7] implemented k-means and spherical k-means (SKM) to cluster an high dimensional dataset containing faults in urban waste water treatment plant and 20,000 newsgroup documents.
Singh aimed at classifying the operational state of the plant in order to predict faults through the state variables of the plant at each of the stages of the treatment process. Although it was found that SKM performed better than k-means, but inter and intra cluster criterion were not measured. In this current research, both inter and intra cluster of k-means were measured. In addition, Singh did not make use of any parallel framework which resulted in difficulty and insuffient results of using SKM when applied to cluster more than 200 document of newsgroup. Thus, this current research used MapReduce framework which can scale well, applied k-means on it and was able to compute both inter and intra cluster convergence.
[8] carried out a research using dataset of patient to know whether they have cancer. The aim is to cluster patient as cancerous and non-cancerous. K-means was first used for this purpose, and was latter compared with a modified k-means which does not know the number of clusters apriori.
The two algorithms performed well but the mofiifed k-means was found to be more accurate with lower execution time when it comes to large dataset. The authors did not use MapReduce or any other parallel framework which could have naturally improve execution time and the accuracy of k-means.
[9] aimed at developing a decision support system that can help doctors and clinical staff to identify if a new heamodialysis patient needs hospitilization and the cause (i.e. infection, cardiovascular syndrome, and cancer). K-means clustering technique was used to group 50 patients and the implementation was carried out on MATLAB. The authors declared that the research is not meant to replace diagnosis or prescribtion and the grouping is still subjective to doctors’ expertise. The decalration was because few dataset was used and laboratory test should be carried out for full diagnosis of a patient. Thus, one of the limitations was that decision support system used very few dataset, whereas, one of the major advantages of using big data is reliable result which can represent the whole dataset.
[10] was the first known paper where k-means algorithm was implemented on MapReduce programming model. The authors saw the possibility of this in k-means because the distance computation between one object ‘a’ and the center is independent of the distance computation between another object 'b' and the center of the cluster. This implies that the distance measures of different objects to the cluster can be computed in parallel. This easily solves the computational challenge of k-means, which involves a total of nk (where n is the dataset or object and k is the number of clusters) distance for each cluster to compute the distance between each object and the center of that cluster.
3.
METHODOLOGY
3.1
Pre-Mining Step
a)
Defining Clustering Objective and other
clustering parameters:
i. Clustering Objectives: To identify local government areas in Nigeria that are similar to each other in terms of number of people who lived there and number of houses using Priority Table IX of 2005 Nigeria Population Census Data.
ii. Value of ‘k’: K in k-means implies the number of desired clusters. In this current research, the value of k is 3. This did not depend on any parameter, it was randomly chosen.
iii. Initial Centroid: The initial centroid for k-means iteration were randomly chosen as the first three records. This is because the research used Lloyd k-means where initial centroid can be chosen randomly.
b)
Preparation of data:-The process of data
preparation includes:
i. Data collection:
government areas including Federal Capital Territory, Abuja.
ii. Data Cleaning:
Noise and missing data has been properly handled in Nigeria Census data.
iii. Feature Selection
The population data is then formatted into five attributes; local government code, no of houses, total number of both sexes living in a house, number of males, and number of females. The new feature introduced, that is, the local government code, is the unique identifier for each local government and each size class of household.
iv. Data Transformation
Data transformation involves transformation of data into forms appropriate for mining. The technique used is called normalization. Normalization scales the data attributes to fall within small ranges such as -1.0-1.0 or 0.0-1.0. Normalization will prevent attributes with large ranges from outweighing the ones with small ranges. The small range used for this work is 0.0-1.0. From literatures, there are three types of normalization technique, but the one used in this research work is min-max normalization, which performs a linear transformation on original data. min-max normalization
is chosen because it preserves the relationships among original data values.
Where:
v| is the normalized value within the range of 0.0 – 1.0,
and represent the maximum and minimum values of an attribute respectively,
and v is the value of an attribute.
3.2
Data Mining Step
a)
Data Mining Process
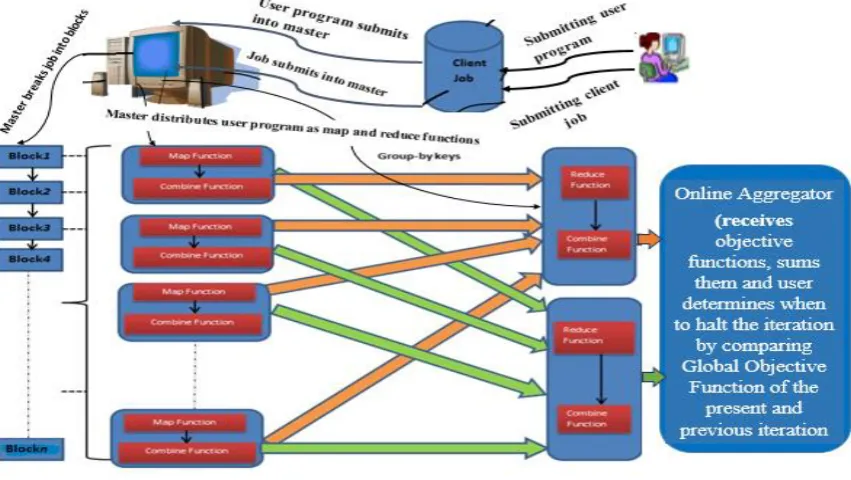
The configuration of the system used for setting up a single node hadoop cluster is 160G hard disk with 3G RAM, using Intel Pentium Processor. Hadoop 2.7.0 was installed on the system. The operating system is Red Hat 14.01. The framework for the experiment is shown in the figure 1.
[image:3.595.93.519.358.598.2]3.3
Post Mining Steps and Results
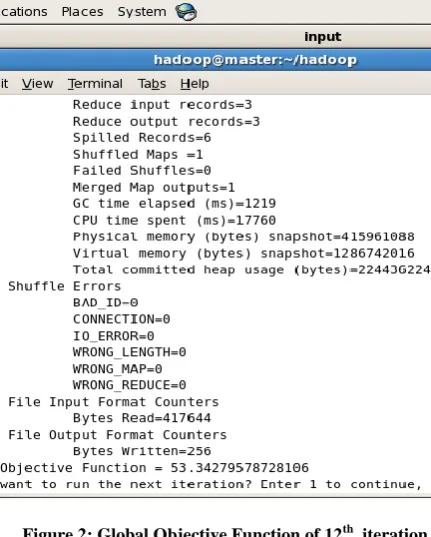
Screenshot on figure 2, 3, and 4 are on global objective functions for 12th, 13th, and 14th iterations respectively. The online aggregator showed that global objective functions of 12th, 13th, and 14th iteration decreased monotonically as 53.34, 53.28 and 53.23, respectively. The iteration was terminated at the 14th epoch having the least global objective function indicating highest inter-cluster convergence.Figure 2: Global Objective Function of 12th iteration
Figure 3: Global Objective Function of 13th iteration
Figure 4: Global Objective Function of 13th iteration
3.3.1
Interpretation of data mining result
For each cluster three graphs were drawn, Graphs 1, 2, and 3 viewed each local government code based on their corresponding number of households. Graphs 4, 5, and 6 viewed local government code based on their corresponding population. These two graphs helped to know similar houses and identify local government that needs Government intervention in terms of low cost buildings. Graphs 7, 8, and 9 viewed each local government code based on the relationship between number of households and total number of people (i.e. population) found in each local government code.
[image:4.595.317.534.86.382.2]Graph1:Cluster0
Graph2: Cluster 1
Graph3: Cluster 2
Graph 4: Cluster 0
Graph 5: Cluster 1
01000 2000 3000 4000 5000 6000 7000 8000 9000
0 10 20 30
Local govt. code versus
NoOfHouses
0 5000 10000 15000 20000 25000 30000
0 10 20 30
Local govt. code versus
NoOfHouses
0 10000 20000 30000 40000 50000 60000
0 10 20 30
Local govt. code versus
NoOfHouses
0 2000 4000 6000 8000 10000 12000 14000 16000 18000
0 10 20 30
Graph 6: Cluster 2
Graph 7: Cluster 0
05000 10000 15000 20000 25000 30000 35000 40000 45000
0 5 10 15 20 25 30
Lgcode versus Population
0 50000 100000 150000 200000 250000
0 5 10 15 20 25 30
Lgcode versus Population
0 2000 4000 6000 8000 10000 12000 14000 16000 18000
0 1000 2000 3000 4000 5000 6000 7000 8000 9000
Graph 8: Cluster 1
Graph 9: Cluster 2
From graphs 1, 2, 3, 4, 5, and 6, Cluster 2 contains highly populated local governments codes, cluster 1 contains moderately populated, while cluster 0 has low population density compared to the other two clusters. This can be clearly confirmed by checking the scales of number of houses of each graph. Some local governments in cluster 0 were identified to need Government attention for building low cost houses. The parameters indicating local government needing low cost building are: high local government code (that is number of people in an household), high population. In addition, from the graphs it was discovered that most households in Nigeria contains between 1 and 8 persons. Graphs 7, 8, and 9 shows the distribution of population to number of households. Based on graphs 7, 8 and 9, Cluster 1 was the best because there were clearly identified linear relationships between number of households and population. This is followed by cluster 2, which consists of 1-8 local
government codes with the most densely populated local government. Lastly is cluster 0, with very few identified linear relationships.
4.
CONCLUSION
This is the first known machine learning implementation on Priority Table IX. Data analytics of Priority Table IX of Nigeria Census Data of 2005 grouped Nigeria local governments into three, and insightful knowledge was discovered from each group through visualization. Local governments that need Government intervention on housing were identified. Thus, the clustering result can help Government in policy planning as well as evaluation and knowledge sharing among researchers.
0 5000 10000 15000 20000 25000 30000 35000 40000
0 5000 10000 15000 20000 25000 30000
NoofHousehold versus Population
0 50000 100000 150000 200000 250000
0 10000 20000 30000 40000 50000 60000
5.
RECOMMENDATION AND
FUTURE WORKS
The techniques used in this research work can be applied on other public complex data in order to aid Government decision making in areas such as health, education, and road network. Thus, the Government will be able to improve the social life of citizens.
6.
REFERENCES
[1] Jianqing, F., Fang, H. and Han, L. (2013). "Challenges of Big Data Analysis." arXiv, 2013, pp. 1-38.
[2] Dijcks, J.-P. (2013). Oracle: Big Data for the Enterprise. Carlifonia: Oracle Corporation.
[3] Michael B. and Gordon L. (2004). Data Mining Techniques For Marketing Sales And Customer Relationship Manager. Indianapolis, Indiana : Wiley.
[4] Kumara, J., Millsa, R.T., Hoffmana, F.M., and Hargrove, W.W. (2011). "Parallel k-Means Clustering for Quantitative Ecoregion Delineation Using Large Data Sets." Elsevier 1602–1611.
[5] Abdous, M., He, W., and Yen, C. (2012). " Using Data Mining for Predicting Relationships between Online Question Theme and Final Grade." Educational Technology & Society 77-88.
[6] Ramesh V., Parkavi P., and Ramar K. (2013). Predicting Student Performance: A Statistical and Data Mining Approach . International Journal of Computer Applications , 35-39.
[7] Singh, H. (2016). "Clustering of text documents by implementation of K-means algorithms" Streamed Info-Ocean 54-63.
[8] Bansal, A., Shama, M., and Goel S. (2017).Improved K-mean Clustering Algorithm for Prediction Analysis using Classification Technique in Data Mining. International Journal of Computer Applications, 35-40.
[9] Ghodsi R, Marani SB., and Keramati A. (2017). Application of K-Means Technique in Data Mining to Cluster Hemodialysis Patients. International Robotics & Automation Journal , 1-6.