Quality Improvements for LQS’ Support Services
A Design-‐Oriented Approach
Master Thesis
Author Arjan ten Buuren
Student number s1377132
Date June 25, 2015
University of Twente, the Netherlands
School of Management and Governance
Master of Business Administration
Track: Innovation & Entrepreneurship
First supervisor: Dr. Ir. Pieter Terlouw
Second supervisor: Tom De Schryver
Technical University of Berlin, Germany
School of Economics and Management
Master of Innovation Management & Entrepreneurship
Third supervisor: Daphne Hering
FrieslandCampina Leeuwarden, the Netherlands
Laboratory & Quality Services
Company supervisor: Judith Kruise-‐de Vegt
ACKNOWLEDGEMENTS
This master thesis has been conducted for the conclusion of my double degree program MSc Business Administration at the University of Twente and my MSc Innovation Management & Entrepreneurship at the Technical University of Berlin. The educational journey that took me to Groningen, Berlin, and Enschede took me in many paths, with many interesting people and companies. Each part of the journey has found some reflections in this master thesis.
First of all, I would like to thank Judith Kruise-‐De Vegt from FrieslandCampina who offered me the opportunity to learn and perform this assignment. Having the opportunity to choose an interesting topic for both the company and myself was really helpful. Furthermore, I really appreciate that everybody within FrieslandCampina helped me during my master thesis project by providing input and/or feedback. Interview participants were really helpful and gave me interesting insights that will also help me in the next steps of my career. Service Desk employees at FrieslandCampina took the time for me and showed what I could learn from them and implement at LQS.
Secondly, I would like to thank my first supervisor Dr. Ir. Pieter Terlouw, who guided me during my thesis and provided interesting insights that were found useful during the research. Also, I would like to thank my second supervisor Tom De Schryver, who gave me important input to finish my research and pointed me in the right directions, which further raised the quality of my thesis.
Finally, I would like to thank all the friends and students I met in Berlin for providing me such interesting and valuable insights in business and life. Looking at the things you have achieved and your view on business and life motivated me so much to put extra effort in my master thesis and accomplish my career and life goals.
Arjan ten Buuren
June 2015
MANAGEMENT SUMMARY
Customer X: “We discussed internally to search for another laboratory that can provide the same services as LQS and searching for possibilities to do some of the analyses ourselves. You are not the first one that talks to us about quality improvements. We would like to see some progress now.”
LQS has recently received indications that customer satisfaction slowly dropped. One of the facets influencing this decrease in customer satisfaction is the unsatisfactory business support LQS is providing. Customers can enter at every level in the organization. Approachability is in itself good, but when customers can enter at all levels of the organization, it means that they do not get a consistent answer and things can be assured on the one side, but cannot fulfilled on the other side. This is the point where LQS loses the overview and give customers the opportunity to enter the organization at different levels, which results in inconsistent answers given. LQS is currently working on a quality improvement of its services and this thesis focuses on structuring its internal and external processes to improve its customer service performance.
In recent years, LQS developed a number of improvement programs to increase its customer service performance, like a Customer Intimacy program, but these programs did not prove to be successful. That is why the main research question is defined as: How can LQS improve its customer service performance and by that its customer satisfaction level?
This study deals with a practical business problem, and therefore a design-‐oriented approach described by Van Aken (2012) is used. Design science has been used to tackle the field problem of the organization under study and is used to provide the following deliverables:
• The problem definition
• The problem analysis and a diagnosis of the major causes and consequences of the problem • A detailed solution design and a change plan
An empirical investigation focuses on the current processes and underlying problems LQS is facing. The design is assessed with semi-‐ and unstructured interviews with customers, employees and management, and critical processes are identified during participant observation studies. The analyses were discussed during focus group sessions to evaluate each step of the design process.
LQS with detailed components that determine a Service Desk’s success. At first, LQS should start identifying the employees that should be involved in the Service Desk with a focus on two competencies; empathy and assertiveness. Processes were made clear that should be followed for different types of issues and problems. Responsibilities are described and the use of the Assyst software facilitates the needs of LQS in increasing the service performance.
The change plan is presented as a Strategy Map, described by Kaplan & Norton (2004), with only a few objectives and initiatives for each perspective that helps managers narrowing in and specifying their focus on what that has to be done to change from the current state to the future desired state with a with an increase service quality.
Creating a climate for service is seen as one of the largest challenges that LQS has to overcome when implementing the Service Desk. This climate for service has to ensure that team leaders are discharged of many customer contacts, so they can focus on leading their teams and daily operations. The climate for service results in an increased service quality and can separate the employees dealing with customer issues/problems, so other employees can focus on internal problems and daily operations.
This design-‐oriented research has a strong practical contribution, and by setting up a Service Desk according to the specifications and processes described in this research, LQS can increase its quality of services provided and thereby increasing the customer satisfaction. Following the initiatives described in the Strategy Map will help LQS move from its current situation into the desired situation, where objectives specified can be accomplished. Given the specific situation of LQS and customer requirements, the solution design is not completely generalizable to other organizations.
TABLE OF CONTENTS
ACKNOWLEDGEMENTS ... 2
MANAGEMENT SUMMARY ... 3
TABLE OF CONTENTS ... 5
LIST OF FIGURES & TABLES ... 8
GLOSSARY (DEFINITIONS / ABBREVIATIONS) ... 9
1. INTRODUCTION ... 11
1.1 THE ORGANIZATION – FRIESLANDCAMPINA ... 11
1.2 THE DEPARTMENT – LQS ... 12
1.3 REGULAR PROCESSES (ROUTINE ANALYSES) ... 12
1.3.1 ANALYTICAL MICROBIOLOGY ... 13
1.3.2 ANALYTICAL CHEMISTRY ... 14
1.3.3 SENSORY GRADING ... 14
1.4 NON-‐REGULAR PROCESSES (BUSINESS SUPPORT) ... 15
1.5 THE INITIAL PROBLEM ... 15
1.6 CUSTOMER SATISFACTION ... 16
1.7 RESEARCH OBJECTIVES & SCOPE ... 17
1.8 RESEARCH QUESTIONS ... 18
1.9 STRUCTURE OF THE REPORT ... 19
2. METHODS ... 20
2.1 AN INTRODUCTION TO DESIGN-‐ORIENTED RESEARCH ... 21
2.2 DESIGN-‐ORIENTED RESEARCH IN AN ORGANIZATIONAL CONTEXT ... 21
2.3 THE DESIGNING CYCLE ... 22
2.4.1 SAMPLING ... 26
2.4.2 INTERVIEWS ... 27
2.4.3 CODING ... 28
2.4.4 PARTICIPANT OBSERVATION ... 28
2.4.5 FOCUS GROUPS ... 30
3. PROBLEM DEFINITION ... 31
3.1 SPECIFICATION OF THE PROBLEM – CUSTOMERS’ PERSPECTIVE ... 31
3.2 SPECIFICATION OF THE PROBLEM –MANAGEMENT PERSPECTIVE ... 35
3.3 SPECIFICATION OF THE PROBLEM – EMPLOYEES’ PERSPECTIVE ... 37
3.4 THE PROBLEM MESS ... 38
3.5 OBJECTIVES, GOALS AND SPECIFICATIONS OF THE SOLUTION ... 40
4. IMPROVING CUSTOMER SERVICE ... 43
4.1 PEOPLE: THE KEY TO EFFECTIVE SERVICE ENCOUNTERS ... 45
4.2 PROCESSES ... 47
4.3 TECHNOLOGY ... 50
4.4 INFORMATION ... 53
4.5 CLIMATE FOR SERVICE ... 54
5. THE BALANCED SCORECARD AND STRATEGY MAPPING ... 58
5.1 CONSTRUCTING A STRATEGY MAP ... 59
5.2 FINANCIAL PERSPECTIVE ... 61
5.3 CUSTOMER PERSPECTIVE ... 61
5.4 INTERNAL PERSPECTIVE ... 62
5.5 LEARNING & GROWTH ... 62
5.6 THE STRATEGY ... 64
5.8 OBJECTIVES AND INITIATIVES ... 65
5.9 THE STRATEGY MAP ... 66
5.10 THE PILOT PHASE ... 75
5.11 EVALUATION ... 76
6. CONCLUSIONS ... 78
6.1 RECOMMENDATIONS ... 79
6.2 LIMITATIONS ... 80
6.3 FUTURE RESEARCH ... 82
REFERENCES ... 83
APPENDICES ... 87
APPENDIX I – Analyses executed by LQS ... 87
APPENDIX II – Cooperative structure ... 88
APPENDIX III – Key figures FrieslandCampina and key facts LQS ... 89
APPENDIX IV – Organizational structure LQS ... 90
APPENDIX V – ISSUES SENSORY GRADING LABORATORY ... 92
APPENDIX VI – CUSTOMER SATISFACTION SURVEY (CSS) ... 93
APPENDIX VII – Interview protocol of the exploratory interviews ... 94
APPENDIX VIII – Coding responses into the SERVQUAL dimensions ... 95
APPENDIX IX – Customers’ perspective ... 96
APPENDIX X – Managers’ perspective ... 99
APPENDIX XI – Employees’ perspective ... 101
APPENDIX XII – Employee attributes ... 104
APPENDIX XIII – Characteristics of high-‐performance organizations ... 106
APPENDIX XIV – Guidelines Service Desk ... 108
LIST OF FIGURES & TABLES
Figure 1: Steps taken in the routine sample testing process. ... 13
Figure 2: Six stages of the design process (based on the regulative cycle of Van Strien, 1997). ... 24
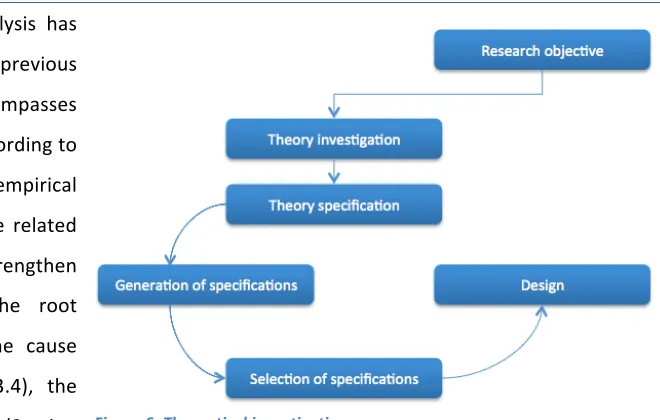
Figure 3: Design process. ... 25
Figure 5: Cause and effect diagram related to the root problem at LQS. ... 38
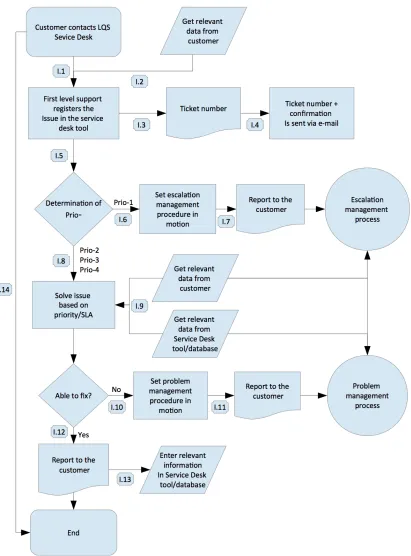
Figure 8: Issue management process. ... 48
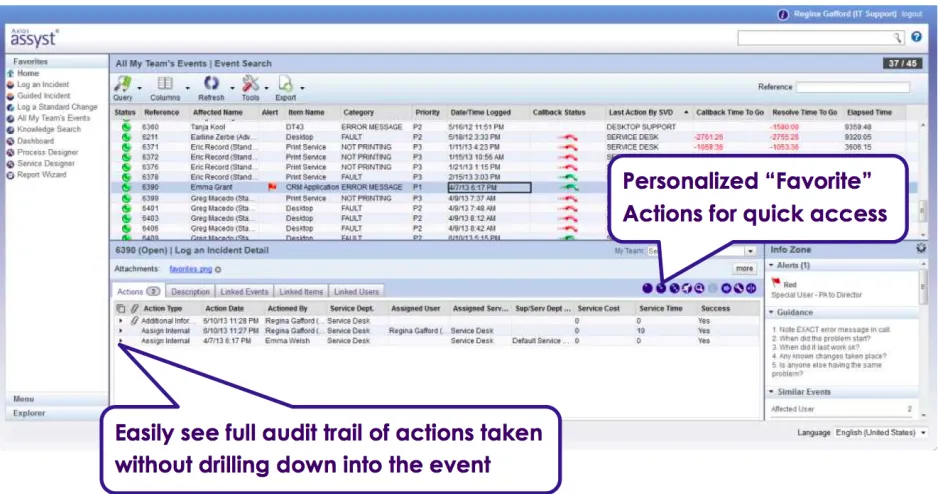
Figure 9: Screenshot #1 of the Assyst tool. ... 50
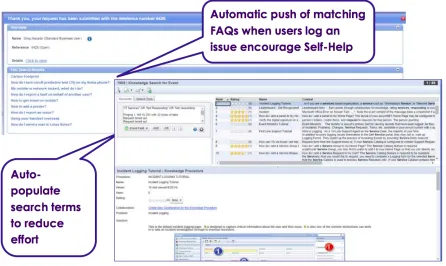
Figure 10: Screenshot #2 of the Assyst tool. ... 51
Figure 11: Screenshot #3 of the Assyst tool. ... 52
Figure 12: Screenshot #4 of the Assyst tool. ... 52
Figure 13: Screenshot #5 of the Assyst tool. ... 54
Figure 14: The High-‐Performance Model (Wiley, 1996). ... 56
Figure 15: The perspectives of the Balanced Scorecard and Strategy Maps (Kaplan & Norton, 2004). .... 60
Figure 16: Strategy Map for LQS. ... 66
Figure 17: Responsibilities in the pilot phase. ... 75
Figure 18: Analysis executed by LQS & growth contribution (LQS, 2014). ... 87
Figure 19: Cooperative structure FrieslandCampina (Royal FrieslandCampina, 2014a). ... 88
Figure 20: Organizational structure LQS (Royal FrieslandCampina, 2014b). ... 90
Figure 21: Organizational structure Analytical Microbiology (Royal FrieslandCampina, 2014b). ... 90
Figure 22: Organizational structure Analytical Chemistry (Royal FrieslandCampina, 2014b). ... 91
Figure 23: Customer Satisfaction Survey (The Choice, 2014). ... 93
Figure 24: Issue management process. ... 114
Figure 25: Problem management process. ... 119
Figure 26: Specialist management process. ... 124
Table 1: Customer Satisfaction Survey (The Choice, 2014). ... 16
Table 2: Definitions of service-‐related terms (Kendall, 2006). ... 32
Table 3: Descriptions of SERVQUAL dimensions (Parasuraman et al., 1988). ... 33
Table 4: Program of requirements. ... 41
Table 5: ServiceFirst: customer service competencies (Fogli, 2006). ... 46
Table 6: Objectives and initiatives in the learning & growth perspective. ... 67
Table 7: Objectives and initiatives in the internal perspective. ... 71
Table 8: Objectives and initiatives in the customer perspective. ... 73
Table 9: Example of SLA Service Desk responsiveness. ... 74
Table 10: Example of SLA incident resolution ... 74
Table 11: Key figures FrieslandCampina and key facts LQS (1Royal FrieslandCampina, 2013; 2Royal FrieslandCampina, 2014; 3LQS, 2014). ... 89
Table 12: Number of questions/issues and time spent on these questions/issues. ... 92
Table 13: Three groups of questions/issues. ... 92
Table 14: Coding labels. ... 95
Table 15: Summary of statements made by customers of LQS. ... 98
Table 16: Summary of statements made by managers at LQS. ... 100
Table 17: Summary of statements made by employees of LQS. ... 103
Table 18: ServiceFirst: Customer Service Competencies (Fogli, 2006). ... 105
Table 19: Characteristics of High-‐Performance Organizations (Wiley & Brooks, 2000). ... 107
GLOSSARY (DEFINITIONS / ABBREVIATIONS)
AIDE-‐model Analysis, Design, Implementation, Evaluation
AOF Analyse Opdracht Formulier (Request for analysis form) BSC
BPS
Balanced Scorecard Business Problem Solving
CIMO-‐logic Contexts, Intervention, Mechanisms, and Outcomes
CSS Customer Satisfaction Survey
ERP Enterprise Resource Planning
DRSM Design Science Research Methodology
HACCP Hazard Analysis & Critical Control Points
HR Human Resources
HRM Human Resource Management
ISO 9001 Quality Management System – Requirements
ISO 14000 A family of standards related to environmental management
KPI Key Performance Indicator
LIMS Laboratory Information Management System
LQS Laboratory & Quality Services
QA Quality Assurance
SAP Systems, Applications & Products in Data Processing
SGL Sensory Grading Laboratory
SLA Service Level Agreement
SPOC Single Point of Contact
1. INTRODUCTION
Every day, dairy products containing valuable nutrients are provided to millions of consumers all over the world. Due to the expansion of the supply chain and the improvement of current supply chain channels, many more consumers can be provided with these dairy products (Royal FrieslandCampina, 2013). In the Netherlands, FrieslandCampina is the largest dairy company and it produces a range of products at different locations that are sold worldwide. An important aspect of becoming one of the largest dairy companies in the world is the assurance of good quality of the products. In particular, dairy products are sensitive to various contaminants (i.e. pathogens), and due to several scandals (i.e. melamine scandal in China), FrieslandCampina has developed its own integral quality system, which it calls FoQus (Royal FrieslandCampina, 2013). With FoQus, FrieslandCampina offers consumers, customers, and the regulatory authorities a guarantee that its products and production processes meet the stringent standards in the fields of food safety, quality, safety, working conditions, fire protection, and environment. Various international standards (i.e. HACCP, ISO 9001 and ISO 14000) are integrated into FoQus, so both FrieslandCampina`s customers and consumers can be assured that its products are safe and of the highest quality (Royal FrieslandCampina, 2013). At FrieslandCampina, the Laboratory & Quality Services (LQS) department concentrates on the analysis of samples from the production facilities of FrieslandCampina dairy products in order to ensure the quality of these products and thus meet the FoQus standards. Due to the strict guidelines of the international standards, FrieslandCampina’s increased production of dairy products and FrieslandCampina’s expanded portfolio of products, the total amount of analyses performed by LQS grew from 950,000 in 2012 to 1,500,000 in 2014 (LQS, 2014). A detailed overview of the trend of analyses performed by LQS between 2012 and 2014 can be found in Appendix I.
1.1 THE ORGANIZATION – FRIESLANDCAMPINA
the pharmaceutical sector around the world. An overview of FrieslandCampina’s cooperative structure and key figures can be found in Appendices II and III.
1.2 THE DEPARTMENT – LQS
The LQS department is part of the Shared Services department within FrieslandCampina and is located in Leeuwarden (NL). The Shared Services department concentrates on supporting the activities of the business groups such as Finance, HR and Laboratory & Quality. LQS provides research and support in the form of microbiological, chemical and sensory analyses. The services are consumed according to a specific model and are paid by those who consume them, as specified by a cost recovery rate. LQS is a small business unit within the enterprise and has a relatively delineated customer base – the internal FrieslandCampina production locations and the R&D department. Additionally, LQS provides business support and training and it conducts various projects at the request of internal customers. The general purpose of the department is to achieve a high level of food safety, product quality and operational hygiene. Production locations are not obligated to use the services provided by LQS but can select other analytical service and business support providers in the external market. As opposed to HR Services and Financial Services, where FrieslandCampina business units are obligated to use the services provided by these departments – which results in these departments having a guaranteed purchase of services – LQS must attract customers based on service performance and costs. LQS is continuously searching for opportunities to increase its service performance. LQS aims for the shortest and cheapest possible lead times for their analytical services (operational excellence) with a high degree of customer service and satisfaction. The LQS department has grown rapidly in recent years from 104 FTEs in 2012 to 175 FTEs in 2014 (LQS, 2014) and it is currently working on a quality improvement of its services. One of the elements that will be looked at is structuring its internal and external processes to improve its customer service performance.
1.3 REGULAR PROCESSES (ROUTINE ANALYSES)
fulfilled by the Sensory Grading department (LQS, 2014). Because of the differences in analysis methods, quantity of analysis and differences in employee occupation, these departments do not work uniformly. Figure 1 displays the steps that are taken in processing the samples at the different departments within LQS. Steps 2 and 3 are executed differently by the various departments and the differences will be explained in Sections 1.3.1 – 1.3.3.
Figure 1: Steps taken in the routine sample testing process.
1.3.1 ANALYTICAL MICROBIOLOGY
The production locations of FrieslandCampina are in need of analyses of their products for a number of reasons. As mentioned previously, early detection of contaminants and the existence of regulations are the primary reasons for analysis. The Microbiology department is responsible for testing microorganisms in the samples. These organisms can be desirable or not; some microorganisms are harmful to human health and others are expedient (Lund et al., 2000). Most samples are tested for certain values of fungi and bacteria. In the Microbiology department, more than 1 million analyses, divided among 80 types, are performed (see Appendix III).
2. At Analytical Microbiology, samples are checked and the correct analysis is subsequently performed based on the requirements of the customer. Employees of the laboratory scan the barcode to determine which type of analysis should be performed.
3. After the analysis, preliminary results are entered into the LIMS system, which has a viewing function for customers.
4. Finally, a specialized laboratory employee checks the analysis and the final results are entered into the LIMS system.
5. Whether or not the customer is contacted depends on the results of the analyses. In some cases the customer contacts LQS to obtain additional information on results given.
1.3.2 ANALYTICAL CHEMISTRY
At the Chemistry department, the components of the samples are analyzed. These product components must have certain values that lie within a range of predetermined options. The Analytical Chemistry department primarily provides routine analyses of dairy end products, raw products and semi-‐ manufactures that are mainly concerned with physical properties related to fat, protein, dry matter or vitamins. In contrast to Microbiology, where samples are checked and the correct analysis is performed, Chemistry analyses are executed and the matching samples are included. Samples can be stored and analysis can be executed after a couple of days, when the specific run is done. So the difference with the Microbiology department is that, in the Chemistry department, a specific analysis is performed and, based on the analysis, samples are included; in the Microbiology department, samples are scanned and the correct analysis is performed on this sample. The second difference with the Microbiology department is that results are checked by team leaders instead of specialized laboratory employees. In the Chemistry department, more than 400,000 analyses are executed, divided into 200 types of analyses (see Appendix III).
1.3.3 SENSORY GRADING
conditioned areas. The process steps performed by the Sensory Grading department are equivalent to the steps taken by the Microbiology department, but the number of analyses executed by the sensory grading department is a factor of ten times less than the Microbiology department (see Appendix III).
1.4 NON-‐REGULAR PROCESSES (BUSINESS SUPPORT)
In addition to the routine analysis of samples from the different production locations, employees at LQS face other tasks, whether or not related to the regular process. LQS provides business support to various production locations and to the R&D department. Topics that are dealt with by the business support group are: support of hygiene issues by means of inspections, monitoring and improvement programs; support for incidents and issue management concerning food safety; and advice on microbial and food safety related issues, among others. A number of analysts were made available to assist the experts in the business support group with analyses or other forms of input. Furthermore, the business support function of LQS provides training for a number of business groups.
1.5 THE INITIAL PROBLEM
As described in Section 1.2, LQS is continuously looking for ways to increase its service performance – on the one hand by increasing the quality of analyses (focusing on operational excellence), and on the other hand by increasing the service support that should result in a higher degree of customer satisfaction. The initial problem was formulated by both the General Manager and a QA specialist at LQS. “During the intake meeting, the principal may explain the problem mess that the company faces. On the basis of this first introduction to the problem mess, a preliminary agreement is made to make this business problem the focus of the further internal exploration” (Van Aken et al., 2012, p.43). During the intake meeting, an agreement was made to focus on creating an interface between the customer and LQS and to structure the internal and external processes in order to improve LQS’ customer service performance. A recent study showed that customers of LQS rated its service performance as significantly decreasing over the last five years (see Section 1.6). Responsibilities within the LQS department are not clear, and communication within the department and to external parties is substandard.
organizational settings, current processes and the initial problem, the underlying root problems were identified. A detailed analysis of the problems and interview responses is provided in Section 3.
1.6 CUSTOMER SATISFACTION
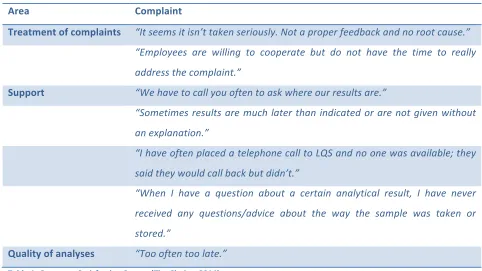
The starting point for some indications for the drop in customer satisfaction was an analysis of the Customer Satisfaction Survey (CSS). In 2014, a CSS was conducted with internal customers who use the laboratory services provided by LQS (The Choice, 2014). The majority of these customers came from production locations in the Netherlands, Belgium or Germany. The average grade that customers gave LQS dropped slowly in recent years from a 7.6 in 2010 to 7.1 in 2014 (The Choice, 2014). This CSS also revealed why customers were less satisfied with LQS. A number of arguments for the decrease in satisfaction related to the research problem of this thesis are displayed in Table 1, and the trends are displayed in Appendix VI.
Area Complaint
Treatment of complaints “It seems it isn’t taken seriously. Not a proper feedback and no root cause.”
“Employees are willing to cooperate but do not have the time to really
address the complaint.”
Support “We have to call you often to ask where our results are.”
“Sometimes results are much later than indicated or are not given without
an explanation.”
“I have often placed a telephone call to LQS and no one was available; they
said they would call back but didn’t.”
“When I have a question about a certain analytical result, I have never
received any questions/advice about the way the sample was taken or stored.”
Quality of analyses “Too often too late.” Table 1: Customer Satisfaction Survey (The Choice, 2014).
[image:16.612.65.547.320.591.2]1.7 RESEARCH OBJECTIVES & SCOPE
In order to realize a plan of improvement, the current processes, organizational structure and customer contacts must first be analyzed to understand how the department is currently operating. After the analysis has visualized the present state of the department, academic literature can be used to provide alternatives for improvement. This type of research is commonly known as design-‐oriented research (Van Aken & Romme, 2009; Hevner, 2007; Verschuren & Hartog, 2005).
In this context, the objective of this research project is not to develop general knowledge contributing to the state-‐of-‐the-‐art academic literature, but to generate specific knowledge in this specific business context. Thus, the purpose of the project is to solve the problem of unsatisfactory customers of the LQS department by providing a theory-‐based and practical-‐oriented solution that will lead to actual change and improvement of the current situation in the organization. It concerns business customer service performance improvement on the basis of sound plans. The overall objective is to create an interface between the customer and LQS and to direct internal and external processes in such a way that the changes will lead to an increase in customer service performance and eventually to a greater level of customer satisfaction of the entire LQS department.
When analyzing the CSS, it can be seen that the grades customers give to LQS are influenced by the treatment of complaints, customer support and the overall quality of analyses. The scope of this research will be narrowed down to a thorough analysis of supporting activities related to questions from customers concerning the routine analysis of samples. The business support that experts give (Section 1.4) will be outside the scope of this research. The most important reason to leave this type of support out of the scope of this research is that the General Manager of LQS wants a clear cut between regular and non-‐regular processes and its supporting activities. Furthermore, LQS is currently running a pilot on the treatment of complaints, so dealing with customer complaints is initially outside the scope of this research. Still, Section 6 will discuss the possibility of dealing with customer complaints in the designed solution. Finally, the quality of analyses executed by LQS is outside the scope of this research, but could be indirectly influenced when, for example, team leaders are discharged of many customer contacts and can focus on their daily operations and leading their teams.
Appendix III). The department rarely deals with non-‐regular processes, and a discussion with the sensory grading team (consisting of seven employees) made clear that there are about 75 issues/questions per year related to the routine analysis of samples. On average, this means one and a half times per week with an average of 0.5 hours per issue. An overview of the various issues can be found in Appendix V. Because of the relatively few issues and problems in the Sensory Grading department, further analysis of the problem within LQS will focus on the Microbiology and Chemistry departments. At the end of this research, conclusions and recommendations based on analysis of the Microbiology and Chemistry departments will be weighed and applied to the sensory grading department, if applicable.
As will be discussed in Section 2.3, a business problem-‐solving project consists of a number of steps. Together with the company and university supervisor, it was agreed upon not to participate in the change and realization phase. In this case, the deliverables of the project are:
• The problem definition
• The problem analysis and a diagnosis of the major causes and consequences of the problem • An exploration of potential solutions to the problem
• An elaboration on one of them in a detailed solution design and a change plan
1.8 RESEARCH QUESTIONS
The project is directed towards delivering value from a single organizational perspective by answering the main research question, namely:
How can LQS improve its customer service performance and, with that, its customer satisfaction level?
Sub-‐questions are constructed in such a way that answering these questions will result in an optimal answer to the main research question. These sub-‐questions are:
1. What are the current processes at LQS for dealing with customer questions/issues?
2. What are the expectations from the management, customers’ and employees’ perspectives related to the solution of the problem?
3. What should an organization do to provide good customer service from an academic literature perspective?
5. What steps must LQS take to move from its current situation to the desired situation?
The outcome of this research should be scientifically and practically relevant for LQS by answering the main research question and sub-‐questions. This indicates that the findings are hardly generalizable to other, more or less, similar organizations, given the specific research context of LQS.
1.9 STRUCTURE OF THE REPORT
This research is structured as follows: Chapter 1 introduces and describes the organization, and the initial problem is identified and explained. In addition, the research objectives, scope and questions are described. The second chapter discusses the research methodology that is used and provides more insights into design-‐oriented research and how it can be used in this thesis. Moreover, data collection and analysis methods will be explained. As a further elaboration on the root problem in the organization is needed, Chapter 3 focuses on the problem definition, the analysis and diagnosis. From an academic perspective, literature is used to form the basis to change the organization from the current state to the future desired state. This will be the main focus in Chapter 4. Chapter 5 will expound upon the path LQS must take to move from the original state to the desired state. In Chapter 5, proposed design characteristics will be given and evaluated based on the problem, theory, goals and objectives. Eventually, one specific design is presented and discussed extensively. Chapter 5 concludes with a description of the pilot and evaluation criteria. This thesis ends with the conclusion, limitations,
2. METHODS
In this chapter, the research methodology used is described and explained. The method used for this research is design-‐oriented, focusing on redesigning the current internal and external processes for dealing with customer questions/issues and, by this, improving the existing situation of the LQS department. Three papers (Van Aken, 2004; Verschuren & Hartog, 2005; Visscher & Visscher-‐Voerman, 2010) and the book of Van Aken et al. (2012) were studied and used to develop a framework, which includes the steps that must be taken to conduct design-‐oriented research. In the final step of the design-‐oriented research, an elaboration on one of the solutions in a detailed solution design and change plan must be constructed. This change plan will be constructed using the ‘Strategy Maps’ framework by Kaplan and Norton (2004) and will be elaborated on in Chapter 5.
The models described by the authors (Van Aken, 2004; Van Aken et al., 2012; Verschuren & Hartog, 2005; Visscher & Visscher-‐Voerman, 2010) contain the subsequent steps a designer must perform to create a good design. What the models have in common is that they contain four basic steps: analysis of the design problem, design of a solution, implementation of the solution, and evaluation of the solution in the light of the original problem (Visscher & Visscher-‐Voerman, 2010). The study of Visscher and Visscher-‐Voerman (2010) shows that the activities of the traditional ADIE (Analysis, Design, Implementation, Evaluation) models can be identified in each design process, but that these activities are shaped differently and do not occur in the same order within each approach. This research focuses on the rational approach proposed by Visscher and Visscher-‐Voerman (2010), where problem solving occupies a central position but there is considerable attention for the stakeholders. There are appreciable differences in interests in and opinions of problems and possible solutions at LQS, which makes it an interesting task to consider and evaluate these varied interests and opinions. This research combines the rational approach with a dialogical design approach described by Visscher and Visscher-‐ Voerman (2010). In the analysis, the problem will be identified, and goals and objectives will be determined. Solutions will be created to meet the objectives, but the choice of the design will be guided by interests and created by discussion and negotiation, in order to achieve consensus or a compromise to which people with different interests and preferences can commit themselves. Evaluation is an important factor to create a good design (Verschuren & Hartog, 2005) and will take place during every stage of the process.
2.1 AN INTRODUCTION TO DESIGN-‐ORIENTED RESEARCH
Designing science focuses on human-‐made objects and processes designed to provide solutions for identified problems. The natural sciences are, according to Simon (1996), concerned with how things are. Whitley (1984) states that “it criticizes everyday accounts and practices… but it does not seek to transform them except in the general sense of demonstrating their incorrectness” (Whitley, 1984, p.371). Design, on the other hand, “is concerned with how things ought to be, with devising artifacts to attain goals” (Simon, 1996, p.114). Design science differs from human and natural sciences in that it focuses on building and evaluating artifacts, instead of searching for a universal truth and prediction or understanding phenomena in specific situations. Design involves human beings using knowledge to create what should be, things that do not yet exist. Design is the activity of changing existing situations into desired ones. Van Aken (2004) states that “besides description-‐driven research programs in management one also needs prescription-‐driven research programs in order to develop research products which can be used in designing solutions for management problems” (Van Aken, 2004, p.220). Design science is motivated by the desire to improve the environment by the introduction of new and innovative artifacts and the processes for building these artifacts (Simon H. A., 1996). According to Van Aken (2004), understanding the problem is only halfway to solving it; the second step is to develop (alternative) solutions. Understanding changes, sources and reasons still leaves undone the tasks of developing systems, change programs and strategies (Van Aken, 2004). The mission of design science is to develop knowledge for the design and realization of artifacts, i.e. to solve construction problems, or to be used for the improvement of the performance of existing entities, i.e. to solve improvement problems. Or, as mentioned by Romme (2003), “the idea of design involves inquiry into systems that do not yet exist – either complete new systems or new states of existing systems” (Romme, 2003, p.558). The design science literature and models are used in this thesis to understand the underlying problem at LQS and to arrive at several solutions to increase LQS’ service performance. The next step is to investigate how design-‐oriented research is applied in an organizational context and to elaborate on the steps that need to be taken in order to understand the underlying problem and create the specifications for the solution(s) that need to be found.
2.2 DESIGN-‐ORIENTED RESEARCH IN AN ORGANIZATIONAL CONTEXT
one that prescribes remedies for a sick patient or the one that devises a new sales plan for a company or a social welfare policy for a state” (Simon, 1996, p. 111).
Designing and redesigning organizations is a core activity of managers and management consultants and has been a focal point of management research (Van Aken, 2004; Romme, 2003) for many years. Denyer et al. (2008) state that “design science research intends to add to analysis and explanation, specifications for interventions to transform present practices and improve the effectiveness of organisations” (Denyer et al., 2008, p.394). The mission of a design science is to develop knowledge that the professionals of the discipline in question can use to design solutions for their field problems (Van Aken, 2005). The focus in business or organizational problem solving is on designing what can be, or what should be, in order to improve the performance of a specific business system on one or more criteria (Van Aken et al., 2012). As stated in section 1.2, LQS is looking to increase its service performance and is thereby searching for solutions to the problem of unsatisfactory customer contacts. Solution implementation involves leading change in an organization in order to introduce new people, processes and physical as well as intangible assets (Nickerson et al., 2012). The steps in the design-‐ oriented research are extensively covered in the academic literature and will be described in the next section.
2.3 THE DESIGNING CYCLE
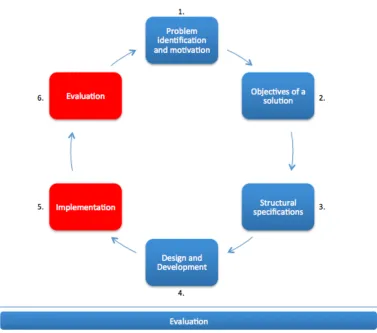
Van Aken et al. (2012) state that “in reality no setting is standard, so one always has to make one’s own, specific project design” (Van Aken et al, 2012, p.6). Based on the design science research methodology by Van Aken (2004), the designing cycle of Verschuren and Hartog (2005), the regulative cycle of Van Strien (1997), and the specific research context at LQS, six stages of the designing process can be identified to carry out research based on design science research principles.
1. Problem identification and motivation: Define the specific research problem and justify the value of a solution. Resources for this activity include knowledge of the state of the problem and the importance of its solution (Chapter 3).
2. Objectives of a solution: The main result of this stage should be a small set of goals to be realized with the artifact to be designed (Section 3.5).
3. Structural specifications: The next step entails a specification of the requirements to be fulfilled within the frame that is defined by the goal and a detailed explanation of potential solutions for the problem (Section 3.5).
4. Design and development: An elaboration on one of the solutions in a detailed solution design and a change plan. This step entails the realization of the design into a prototype. This prototype embodies the complete design and is useful for empirical evaluation (Chapters 4 & 5).
5. Implementation: In this stage, the designer has to put into practice the prototype as a first check that it will work appropriately in the next stage (outside the scope of this research).
6. Evaluation: The last step is to check whether the short and long term effects of utilization of the prototype fit the design goals and satisfy the expectations of the designer and, notably, of the various stakeholders. This activity involves comparing the objectives of a solution to the actual observed results from use of the artifact. Depending on the nature of the problem venue and the artifact, evaluation could take many forms (Section 5.11).
its utility in practice” (Hevner, 2007, p.89). Also, feedback from the environment of the field testing and a restatement of the research requirements as discovered from actual experience can cause an iteration of the cycles.
Figure 2: Six stages of the design process (based on the regulative cycle of Van Strien, 1997).
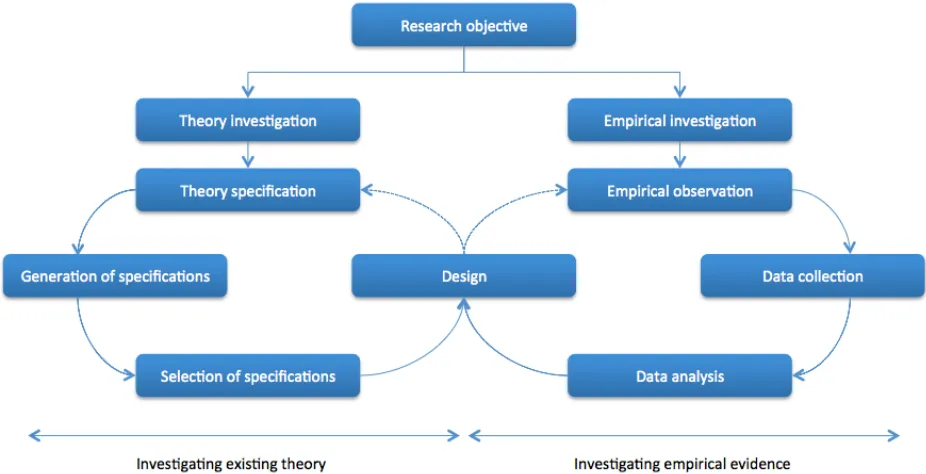
[image:24.612.121.498.139.472.2]problem will typically yield not a single, but a set of, solution concepts… in deciding among them the practitioner draws on context and objectives” (Van Aken & Romme, 2009, p.9). A focus group will be formed to discuss the set of solution concepts, and consensus should be reached on the best design to ensure commitment to the designs (Visscher & Visscher-‐Voerman, 2010). These designs will be discussed during a focus group session and, based on their considerations; one design will be chosen and developed into a prototype. “The best solution is the one that scores the highest on a set of criteria that are derived from the problem statement, and possibly from a variety of financial, structural, or other constraints” (Visscher & Visscher-‐Voerman, 2010, p.715). The actual implementation (Step 5) of the prototype is not within the scope of this research but recommendations on how to implement a pilot and further roll-‐out of the design are given at the end of this report. Evaluation activities will take place during the entire process of designing, and after-‐implementation evaluation characteristics are provided.
Figure 3: Design process.
As mentioned earlier, the design process will be based on academic theory and empirical evidence as well as observations at LQS and its customers. Figure 3 shows how the design will be based on both empirical observations (the remainder of this chapter and Chapter 3) and academic, theoretical specifications (Chapter 4).
[image:25.612.73.536.328.565.2]2.4 DATA COLLECTION AND ANALYSIS METHODS
This section describes the data collection
and analysis methods used. Furthermore, the reasons for sampling are explained and interview methods are described. Van Aken et al. (2012) state that if one wants to understand the perspective of someone else, one needs to first employ qualitative research methods. The specific selections made for these methods will be clarified in the following sections.
2.4.1 SAMPLING
At the start of this research, little was known about the people that were affected in any way by the research problem. According to Babbie (2010), probability sampling is the primary method of selecting representative samples for social research. At the same time, probability sampling can be impossible to conduct or inappropriate to use in many research situations. In this research, samples were chosen on the basis of purposive sampling. According to Bryman and Bell (2011), the goal of purposive sampling is to sample participants in a strategic way, so that those samples are relevant to the research question being posed. At LQS, the respondents were selected either due to the fact that they were often contacted by customers or due to their (potential) input for the research because they were important to the completion of the research. The technique used for contacting the respondents was snowball sampling, used by Babbie (2010). This procedure is appropriate when the members of a special population are difficult to locate. Since at the early stage of this project it was not clear which persons were potential stakeholders, data was collected on the few members of the target population that were located at the start of this project. Thereafter, these individuals were asked to provide the information needed to locate the other members of the population that could be potential stakeholders or affected in any way by the research problem. Each person interviewed was asked to suggest additional people for interviewing. Section 2.4.2 will discuss the interview methods that were used to collect the empirical data.