A Thesis Submitted for the Degree of PhD at the University of Warwick Permanent WRAP URL:
http://wrap.warwick.ac.uk/79585 Copyright and reuse:
This thesis is made available online and is protected by original copyright. Please scroll down to view the document itself.
Please refer to the repository record for this item for information to help you to cite it. Our policy information is available from the repository home page.
NEW APPROACHES FOR THE
STUDY OF DISSOLUTION
KINETICS
AT
THE
MICROSCOPIC LEVEL
by
Julie V. Macpherson
A thesis submitted for the degree of Doctor of Philosophy at
the University of Warwick
Faculty of Science,
Department of Chemistry,
University of Warwick,
Coventry.
CV47AL
ACKNOWLEDGEMENTS
First and foremost I would like to express my gratitude to Dr. Patrick
Unwin, who convinced me as a young undergraduate that electrochemistry
would, most definitely, be good for me. His continued support and ever-present enthusiasm and optimism have always been a source of inspiration throughout the course of my studies.
A mention must also be given to the past and present members of the group, all of whom have contributed in some way to the work presented in this
thesis. I would like to thank Mark Beeston, who has hence departed to the
world of suited scientists, collectively called industrialists, for teaching me the
finer qualities of cleanliness in a laboratory. I apologise now for an earlier
acknowledgement to Mark which thanked him for proving electrochemistry
does not work, I now realise it just takes time. To Rachel Martin ('rashers')
thanks are due for keeping me fed during this write-up and aiding me in the
understanding of the theory connected with this work. It would be boring to thank Nick Evans for his computing skills but unfortunately it is necessary
along with thanks for the enumerate trips to the Coca-Cola machine he has
made over the past year. To the last group member thanks are due to Chris
Slevin for being very 'laid back' and quiet, in stark contrast to some members
of the group, especially during 'thinking' time.
In
addition thanks must go to Richard Lissaman for helping out withtricky mathematical problems.
I am eternally grateful to Harry Wiles, Ken Westwood and Norman
Homer in the Workshop, Philip Roskelly and Nigel Burgess in Electronics and
Alex Stuart the glassblower, for their skill, craftsmanship and willingness to
accommodate to the pressures of getting equipment fued and made yesterday.
DECLARA TION
I hereby declare that the work contained in this thesis is entirely original and my own
work, except where otherwise indicated.
Investigation of the dissolution mechanism of the (100) face ofKBr, using the
integrated electrochemical-atomic force microscope, was carried out at the University
of Texas at Austin in collaboration with Dr. Andy Hillier and Prof. Allen 1. Bard.
Parts of the work contained in this thesis have been accepted for publication in the
scientific literature:
J. V. Macpherson, P. R. Unwin, A. C. Hillier and A. J. Bard, In-situ Imaging oflonic
Crystal Dissolution Using an Integrated Electrochemical-AFM Probe,
1.
Am. Chem.Soc., 118, 1996, 6445.
1. V. Macpherson and P. R. Unwin, Scanning Electrochemical Microscopy as a Probe
of Silver Chloride Dissolution Rates,
1.
Phys. Chem., 99, 1995, 14824.1. V. Macpherson and P. R. Unwin, Scanning Electrochemical Microscope Induced
Dissolution: Rate Law and Reaction Rate Imaging for the Dissolution of the (010)
Face of Potassium Ferrocyanide Trihydrate in Non-Stoichiometric Aqueous Solutions
of the Lattice Ions,
1.
Phys. Chem., 99, 1995,3338.1. V. Macpherson, M. A. Beeston and P. R. Unwin, Imaging Local Mass Transfer
Rates within an Impinging Jet and Studies of Fast Heterogeneous Electron Transfer
1. V. Macpherson and P. R. Unwin, Oscillatory Dissolution of an Ionic Single Crystal Surface ObselVed with the Scanning Electrochemical Microscope, J. Phys. Chem.,
98, 1994,3109.
1. V. Macpherson, S. Marcar and P. R Unwin, Microjet Electrode: A Hydrodynamic Ultramicroelectrode with High Mass Transfer Rates, Anal. Chem., 66, 1994,2175.
During the course of this thesis, work was carried out in other areas and the
following papers have been accepted for publication in the scientific literature:
1. V. Macpherson, C. I. Slevin and P. R Unwin, Probing the oxidative Etching Kinetics of Metals with the Feedback Mode of the Scanning Electrochemical
Microscope, J. Chem.
Soc., Faraday Trans.,
in press.P. R Unwin and I. V. Macpherson, A New Look at Surface Reactions, Chem. Ind., 21, 1995, 874.
1. V. Macpherson, M.
A
Beeston, P.R.
Unwin, N. P. Hughes and D. Littlewood,Scanning Electrochemical Microscopy as a Probe of Local Fluid Flow through
Porous Solids: Application to the Measurement of Convective Rates through a Single
Dentine Tubule, J. Chem.
Soc., Faraday Trans.,
91, 1995, 1407.1. V. Macpherson, M.
A
Beeston, P.R.
Unwin, N. P. Hughes and D. Littlewood,Scanning Electrochemical Microscopy as a Probe of Local Fluid Flow through
Porous Solids: Application to the Measurement of Convective Rates through a Single
J. V. Macpherson and P. R Unwin, Recent Advances in Kinetic Probes of the
Dissolution oflonic Crystals, Progr. React. Kinet., 20, 1995, 185.
P.
R
Unwin and J. V. Macpherson, New Strategies for Probing Crystal DissolutionABSTRACT
This thesis is concerned with the development, application and theoretical
treatment of the scanning electrochemical microscope (SEeM), with the aim of obtaining new insights into the kinetics and mechanisms of ionic crystal dissolution processes. The ultramicroelectrode (UME) probe of the SEeM, placed at close distances to the surface of an ionic single crystal face in contact with a saturated solution, was used to induce and monitor the dissolution processes of interest. This was achieved by stepping the potential at the UME from a value at which no electrode reaction occurred to one where a
component of the saturated solution was electrolysed at a diffusion-controlled rate. The resulting undersaturation induced the dissolution process and dissolving material, after traversing the tip/substrate gap, was subsequently collected at the UME probe. The current-time behaviour provided quantitative information on the local dissolution rate.
The SEeM was successfully used to determine the dissolution characteristics of the (010) face of monoclinic potassium ferrocyanide trlhydrate. A second-order
dependence on the interfacial undersaturation was found, consistent with the classical Burton, Cabrera and Frank dissolution model. This investigation proved that the SEeM was capable of delivering high mass transport rates under well-defined conditions and demonstrated that the dissolution of an un symmetric salt could be described by classical theories. In addition, through the development of SEeM dissolution rate imaging, it was shown that it was possible to map the dissolution activity across single pits in the crystal surface with micrometre resolution.
The kinetics and mechanism controlling the dissolution of silver chloride is a classical system which, despite a number of studies, remains unresolved. SECM studies of the dissolution of pellets and electrochemically grown films of Agel in aqueous solutions, both in the absence and presence of supporting electrolyte (where the
supporting electrolyte does not contain a ion common to Agel), were carried out and the corresponding mass transfer theories developed. In the latter case dissolution was found to be diffusion-controlled, due to the build up of electroinactive ions in the tip/substrate gap, suppressing the attainment of high interfacial undersaturations. In contrast, in the absence of supporting electrolyte, where the principle of electroneutrality prevented this process, the dissolution kinetics were determined unequivocally.
In order to significantly increase the spatial resolution of electrochemically induced SECM imaging, a new integrated electrochemical-atomic force microscopy (IE-AFM) probe was developed, which simultaneously measured the topography of the surface while electrochemically inducing dissolution under conditions which closely mimicked those of SEeM experiments. Using this technique, it was demonstrated, for the first time, that dissolution of an ionic crystal surface (the (100) face of potassium bromide), under conditions of very low interfacial undersaturation, occurred by the dynamic unwinding of steps at the sites of screw dislocations.
Through use of the high spatial resolution and well-defined mass transport characteristics of the SEeM, it was possible to determine the dissolution characteristics, in an area of a crystal surface devoid of dislocations and defects, i.e. a 'perfect' surface. Studies on the (100) face of copper sulfate pentahydrate demonstrated that dissolution, in low dislocation density areas, occurred via an oscillatory mechanism.
CONTENTS
1. Introduction
1.1
The Nature of Dissolution Reactions1
1.2
An Assessment of Experimental Methodology for Studying 5 Dissolution Kinetics1.2.1
Dissolution methods involving powders 71.2.2
Techniques incorporating well-defined hydrodynamics 101.2.2.1
The rotating disc method (RDM)10
1.2.2.2
Channel flow method with electrochemical detection15
(CFMED)
1.2.2.2.1
Basic principles15
1.2.2.2.2
Applications15
1.2.3
Flow method with in-situ interferometry and microscopy18
1.2.4
Scanned probe microscopy techniques21
1.2.4.1
Atomic force microscopy (AFM)21
1.2.4.1.1
Basic principles and applications21
1.3
The Scanning Electrochemical Microscope25
1.3.1
Basic Principles25
1.3.2
Modes of Operation28
1.3.2.1
The Feedback Mode28
1.3.2.2
The Generation Collection Mode30
1.3.2.3
SECM Induced Desorption (SECMID) Techniques32
1.3.3
Applications of SEeM Methodology33
1.3.3.1
The Study and Quantification of Heterogeneous35
Electron Transfer Processes using SECM
1.3.3.3
The Study and Quantification of Homogeneous39
Electron Transfer Processes using SEeM
1.3.3.4
Imaging and Quantifying Local Transport through42
Porous Solids and Membranes
1.3.3.5
Modification and Fabrication of Surfaces using SEeM45
1.3.3.5.1
Etching and Corrosion Studies45
1.3.3.5.2
Deposition49
1.3.3.6
Topographical Imaging utilising SEeM52
1.3.3.7
Potentiometric Probes in SEeM54
1.4
Aims56
2. Theoretical Treatment of Mass Transfer in the SEeM Geometry
2.1 Numerical methods employed to solve mass transport
61
in the SEeM geometry
2.2 Mass Transfer and the ADI Finite-Difference Method
63
in the SEeM Geometry
2.2.1 SEeM Mass Transfer
63
2.2.2 Numerical Simulation using the ADI finite-difference method
66
2.2.2.1 Definition of the grid system
67
2.2.2.2 Finite-Difference Methods
70
2.2.2.3 The ADI finite-difference method
73
2.3 Execution of the SEeM problem
79
2.3.1 Theoretical Negative Feedback Results
80
2.4 Application to SEeM Induced Dissolution Studies
82
2.4.1 Dissolution Rate Laws
82
2.4.2.1 The ADI finite-difference method applied to
the SECM dissolution problem
3. Experimental
3.1 SEeM Ultramicroelectrode Fabrication Procedures
3.1.1 SEeM Electrodes (disc diameter
10
J.U1l or greater) 3.1.2 SECM Electrodes (disc diameter of2 or 5 ~m)3.2 SEeM Instrumentation and Apparatus
3.3 Integrated electrochemical-AFM instrumentation
3.4 Microjet Electrode (MJE) Instrumentation
3.5 Solutions and Substrates
3.5.1 Solutions
3.5.2 Substrates
84
88
88
90
91
96
98
101
101
103
4. PotaS"inm
Ferrocyanide
Trihydrate Dissolution In AQUeous Solutions ofPotassium Chloride
4.1
Introduction 1054.2
Theory106
4.3
Theoretical Results and Discussions110
4.4
Experimental Section113
4.5
Experimental Results and Discussion114
4.5.1
Ferrocyanide oxidation in saturated solutions114
4.5.2
SECM Induced Dissolution Kinetics120
4.5.3
Dissolution rate imaging134
5. Silver Chloride Dissolution Kinetics In Aqueous Solution With and Without
Supporting Electrolyte
5.1 Introduction
144
5.2 Theory
145
5.2.1 Formulation of the Problem for the Case of an Inert
145
Supporting Electrolyte which does not Contain a
Common Ion with the Dissolving Material
5.2.2 Formulation of the SECM Dissolution Problem for the
148
Case where there is No Supporting Electrolyte
5.3 Theoretical Results and Discussion
153
5.4 Experimental
164
5.4.1 Procedures
164
5.5 Experimental Results and Discussion
167
5.5.1 Voltammetric and Chronoamperometric Measurements
167
of Ag+ Reduction
5.5.1.1 With
0.1
mol dm-3 Potassium Nitrate as an Inert Supporting167
Electrolyte5.5.1.2 In the Absence of Supporting Electrolyte
169
5.5.2 SECM Induced Dissolution Kinetics
170
5.5.2.1 With
0.1
mol dm-3 Potassium Nitrate as an Inert Supporting170
Electrolyte
5.5.2.1.1 Dissolution Rate Imaging
174
5.5.2.2 In the Absence of Supporting Electrolyte
175
6. In-situ Imaging of Ionic Crystal Dissolution Using An Integrated
Electrochemical-Atomic Force Microscope Probe
6.1
Introduction 1876.2
Theory 1886.3
Experimental 1896.3.1
SEeM Procedure 1896.3.2
IE-AFM Procedure 1896.4
Results and Discussion 1896.4.1
SEeM Measurements 1896.4.1.1
Bromide Oxidationin
Saturated Solutions 1926.4.1.2
SEeM Induced Dissolution Kinetics 1946.4.2
IE-AFM Probe Results 1976.4.2.1
Electrochemical and Imaging Characteristics of 197theIE-AFM
6.4.2.2
IE-AFM Induced Dissolution 2016.4.2.2.1
Oxidation ofBr to Br3- 2016.4.2.2.2
Oxidation ofBr3- to Br2 2106.5
Conclusions 2157. Induced Dissolution in Dislocation-Free Regions of an Ionic Crystal Surface
7.1
Introduction 2177.2
Theory 2197.3
Theoretical Results and Discussion 2237.4
Experimental Section 2327.4.1
SEeM Procedure 2327.4.2
Determination of the dislocation density on the 2327.5
7.6
Experimental Results and Discussion
Conclusions
233
241
8. Development and Application of a Microjet Electrode: A Hydrodynamic
Ultramicroelectrode with High Mass Transfer Rates
8.1
Introduction
8.2
8.3
8.3.1
8.3.28.3.3
8.3.4 8.48.5
Apparatus and Instrumentation for
MJEstudies
Experimental Procedures for Detennining Mass
Transfer in the
MJEGeometry
Effect of Lateral Position of the Jet on Mass
Transfer Rate
Effect of Nozzle Exit -
UMESeparation on the
Mass Transfer Rate
The Effect of Flow Rate on the Mass Transfer Rate
MJE
Voltammetry
Discussion on How the
MJEcould be Modified to
Enable the Study of Fast Dissolution Processes
Conclusions
List of abbrevations and symbols
Appendices
Al
The Thomas Algorithm
Al
The SECM Negative Feedback Simulation
CHAPTERl
INTRODUCTION
This chapter outlines the fundamental processes involved in the dissolution of
an ionic solid and the questions which need to be addressed in any mechanistic and
kinetic study of the process. A critical review of the different experimental
methodologies which have been applied to study the dissolution of ionic solids is
given, and the need for new approaches is highlighted. The principles,
instrumentation and applications of the scanning electrochemical microscope are
described. Techniques based on this device are proposed as new approaches for
studying dissolution kinetics, which overcome the limitations of existing
methodologies.
1.1 The Nature Of Dissolution Reactions
The dissolution of ionic solids is a fundamental reaction, 1-4 which plays a key
role in many natural,5,6 technological 7 and biological 8 processes. The process of
dissolution of an ionic crystal involves the transfer of ions from the surface of the
solid material to an undersaturated solution. This process is often represented by a
simple chemical equation, for example, the dissolution of a crystal,
MyXz,
in an aqueous solution could be written:(1.1)
Equation (1.1) defines the net result of dissolution, i.e. the transfer of ions from a
solid MyXz to an undersaturated solution, but masks the complexity of dissolution
When a solid dissolves in a liquid, the overall reaction may be represented in
tenns of some or all of the series of elementary events illustrated schematically in
Figure 1.1. The following events are involved: (a) detachment of ions or molecules
from a dissolution site~ (b) surface diffusion of the detached species~ ( c) desorption (and adsorption)~ (d) mass transfer away from the crystal. The latter step is usually
the movement of material into the bulk of the solution (by diffusion, convection and
perhaps migration) but may also include diffusion through a porous layer at the solid
surface. Steps (a) to (c) are surface processes and when any of these steps is slow
compared to the transport processes, the dissolution reaction is said to be kinetically
surface controlled.
Conversely, when the surface processes are fast compared to thetransport processes, the reaction is tenned
transport controlled
The picture of dissolution given in Figure 1.1 is further complicated when the
nature of a typical crystal is considered in more detail. For many crystalline materials,
the morphology is such that a variety of crystal faces are exposed. As generally recognised in surface science, faces of a crystalline material with different
arrangements of atoms, ions or molecules (depending on the nature of the material)
are often characterised by different reactivities.9 Furthennore, as illustrated
schematically in Figure 1.2, even on a single crystal face there is a considerable
variety of defects and surface microstructure, such as steps, terraces,
kink
sites,vacancies and ad-ions, all of which have characteristic free energies of dissolution.
Additionally, crystals often contain a number of defects which affect the
surface properties. These disruptions to the lattice structure usually occur either as a
consequence of impurities becoming incorporated into the crystal lattice during the
growth process, or as a result of fast imperfect growth of the crystal. The two most
common crystal defects are referred to as
screw
andedge
dislocations3 and areshown in Figure 1.3. They are line defects which propagate throughout the bulk
Detachment
Surface Diffusion
>
D
Mass Transport
Desorption
Solution
Crystal
Figure 1.1. Elementary steps involved in dissolution processes. D represents a dissolution unit (ion o(molecule).
Kink
Step
Terrace
L1/',
Vacancyddatom
[image:17.545.26.531.9.799.2](a)
(b)
[image:18.555.20.531.19.665.2]In both cases the effect is the distortion of lattice layers resulting in the production of
steps on the crystal surface.
The thennodynamic force for crystal dissolution is undersaturation at the
crystal/solution interface. In principle, dissolution can take place from any site on the crystal, but the detachment of dissolution units will be initiated more quickly from
some sites than others. In general, the excess energy microscopic sites, varying from screw dislocations to edges, ledges and kinks will dissolve much more readily than planar surfaces from which removal of a dissolution unit constitutes a very high
energy process.! 0
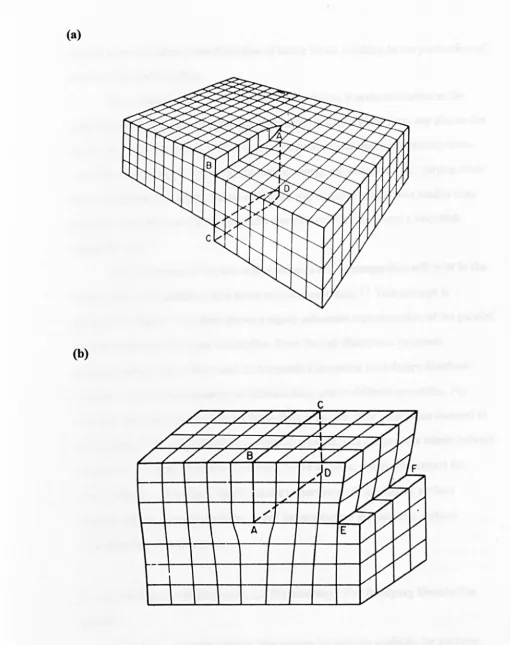
The implication of the above discussion is that heterogenities
will
exist in therelative rates of dissolution from these excess energy sites.! I This concept is
illustrated in Figure 1.4, which shows a highly schematic representation of the parallel
processes involved in crystal dissolution. Even though dissolution proceeds
simultaneously from all sites, each of the parallel processes contributes dissolved
material to the aqueous solution at different rates and in different quantities. For
example, dislocations may dissolve faster than edges but they supply less material to
the solution. If the dissolving face is taken as a whole, it is the process which delivers the greatest quantity of dissolved material to the solution which will control the
surface kinetics. This clearly illustrates the importance of considering surface
structure effects when determining which factors govern the rate of a
surface-controlled dissolution reaction.
1.2 An Assessment Of Experimental Methodology For Studying Dissolution
Kinetics
In order to evaluate critically the various techniques available for studying
dissolution kinetics, it is first necessary to consider the general requirements which
What Determines the Measured Dissolution Rate with Parallel Processes 7 Fastest process is normally rate-determining, unless its contribution
to the total dissolved concentration is insignificant
Point Defects Dislocations Microfractures Kinks
Grain or Twin Boundaries Corners Edges, Ledges
$t--->~
Rate Ouantity---~~~~>
- - - W
>
)
•
---~
---~
Entire face W i t h _ All Defects [image:20.541.103.491.204.466.2]that the following questions require answers.
(i) What is the relationship between surface structure and reactivity? This includes
the ability to study the reactivity of both an individual crystal face and a particular
structural feature on a face.
(ii) What role does local mass transport play in controlling the dissolution rate? For
a particular face (or preferably a specific feature on a crystal face) is the rate
controUed by mass transport in solution, or a surface process, or does it proceed
under mixed kinetic control? If there are surface kinetic limitations, which surface process limits the rate? It also follows that if fast surface processes are to be
characterised, techniques must be able to deliver sufficiently high mass transfer rates
to compete with the kinetics of the surface reactions.
(iii) How does the rate and mechanism depend on local undersaturation at the
solidlliquid interface? This question recognises that the level of undersaturation at
the crysta1/solution interface provides the driving force for dissolution.
Although there have been a large number of experimental studies of crystal
dissolution kinetics, the conventional experimental techniques are: (i) unable to
quantitatively address all of the above questions simultaneously and (ii) usually only applicable to sparingly soluble materials. The following section in this introduction
provides a comparative critical assessment of the most important techniques currently
in use in the dissolution field in order to identify their strengths and weaknesses and
to highlight the need for new experimental approaches.
1.2.1 Dissolution methods involving powders
The majority of dissolution studies have employed suspensions of powdered
materials. 1,2, 12-30 Experimentally, the powder is stirred in an undersaturated
solution and the resulting concentration change of the bulk solution, measured as a
to be inferred. Although this approach allows average dissolution rates to be
measured, there are several inherent drawbacks which lead to difficulties in the
accurate interpretation of the interfacial kinetics, as discussed below.
Several methods have been used to monitor the dissolution of powders. The
two most commonly employed are the free drift method2 and the constant
composition method. 2 In the case of the free drift method, the concentration changes
are continuously recorded until the system reaches equilibrium. Both in-situ and
ex-situ detection methods have been used. In the former case these include
conductometric, 14,15 pH monitoring 16, 17 or radioactive labelling18 methods. In
ex-situ detection, aliquots of the solution are removed at periodic intervals, from a batch
reactor, and analysed using conventional analytical methods, for example, titrametric
methods, 19,20 atomic absorption spectroscopy, 19, 21 photometry22 or radioactive
monitoring. 23 This general approach suffers from the possibility that the composition
of the extracted solution may change, with the result that the determination of
solution compositions with an accuracy of better than ± 10% is difficult. 24 Other
methods have also been utilised in the batch procedure but are not as common, e.g.
weight loss of the solid material.25,26 For the constant composition method the
activity of a single ion species is controlled and kept constant by titrant addition,
while the concentration of other lattice ions are allowed to vary with time.
An
example of this is the pH stat method,27-30 pioneered by Nancollas.3 1
The rate of mass transport in particulate systems is varied using stirrers.
Stirring has the effect of decreasing the boundary layer thickness surrounding the
particles and hence increasing the rate of mass transport. Unfortunately, modelling
the relationship between the stirring frequency and the rate of mass transport is
difficult in this type of system as mass transport depends on many parameters,32
diffusivity of the diffusing solute; (vii) particle size distribution and geometry and
(viii) density of the particles. Consequently, "there is no reliable general correlation of
mass transfer coefficients for such systems,,32 and investigating the extent to which
mass transfer controls even the average dissolution rates of particles has proved to be
difficult.
The importance of mass transport in the rate of heterogeneous reactions has often been determined by investigating the effect of the stirring rate on the reaction
rate. A lack of stirring dependence has been taken to imply a lack of transport control
in the reaction, i.e. that the rate is controlled by a surface process. However, for
particulate systems, with poorly defined hydrodynamics, it has been demonstrated
that a lack of stirring dependence of the reaction rate may simply mean that the
hydrodynamic environment around a particle does not change with stirring speed,33
as opposed to the dissolution process becoming surface-controlled.
In addition to poorly defined mass transfer, particulate-based experiments
suffer from further drawbacks. The concentration of the dissolving species is
measured in bulk solution and not at the crystaVsolution interface. Under these
conditions, the level of undersaturation in the bulk of the solution is often considered
to be the driving force for dissolution, rather than at the crystaVsolution interface,
which is clearly inappropriate. Furthermore, for some types of investigations the
batch nature of particulate systems dictates that kinetic measurements are restricted
to short times to avoid significant changes in the solution composition. Finally, the
use of particles makes it difficult to investigate the effect of surface structure on the
dissolution rate and mechanism. In particular, with this approach, it is impossible to
1.2.2 Techniques incorporating well-defined hydrodynamics
To overcome the problem of ill-defined mass transport, workers have
turned to methods which possess well-defined hydrodynamics. These techniques
allow mass transport to be varied in a controlled and calculable manner over a
wide dynamic range. The advantages and disadvantages of two of the most popular
techniques of this type, the rotating disc method33-53 and the channel flow
method with electrochemical detection,54-63 are assessed in this section.
1.2.2.1 The rotating
discmethod
(RDM)Although the use of the RDM can be traced back a long way, 64 early experimental work was hampered by a lack of theoretical treatments for
convective-diffusive mass transport to a rotating disc. The publication of the
solution of the convective-diffusion equation for a transport-controlled process by
Levich in 1942,65,66 has led to the widespread use of the RDM. This is
particularly true in the electrochemistry field, where the rotating disc electrode has
proved to be a valuable tool for the study of electrode reaction mechanisms and
kinetics. 67
For dissolution experiments, the material of interest is cast flush
in
the endofa cylinder of inert material (e.g. epoxy resin) so that a disc of the solid is exposed
in
the centre of the cylinder end. The cylinder is attached to a motor which is used torotate the solid disc about its cylindrical axis of symmetry in a solution. The rate of
mass transport of solution species to and from the disc can be controlled by varying
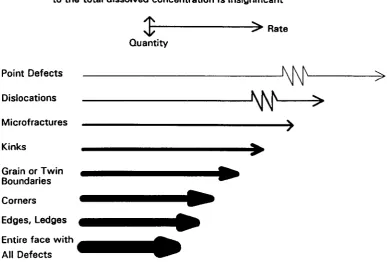
the rotation speed. A schematic of the experimental set-up is shown in Figure 1.5.
The dissolution reaction is followed by monitoring the resulting
concentration change in bulk solution, which is detected by methods such as those
discussed in section 1.2.1 for studies involving powders. Two factors contribute to
Undersaturated solution
Motor
Crystal of interest
I---E~----~ Motor Controller
Rotating disc shaft
Thermostatted vessel jacket
in-situ or ex-situ probe of bulk solution
[image:25.551.20.541.12.744.2]composition
Figure
1.5.
Schematic of the rotating disc experimental set-up for investigating dissolution kinetics.Table
1.1.
Dissolution systems studied using the RDMChemical system
Monitoring of reaction
KCI(s) ~ K(aq) +
+
C~aq)- Bulk: Monitor conductivity of solutionReference
-45
gypsum
C 2+ CaS04.2H20(s) ~ a(aq)
+
SOl~aq)
+
2H2O(I)Bulk: Monitor Ca2+ concentrations
68
soluble anhydrite using a Ca2+ ion selective electrode
caS
04(1)~ CaZ.~
+
SO~(.q)
i) Bulk: Monitor conductivity of
Ca(OHh(,) ~ Cal.:)
+
20H'(.q) solution.Ex-situ:
measure Ca2+ concentrationin i) H2O using atomic absorption
ii) O.IM Ca(N03h spectrophotometry (AAS)
iii) O.IM NaOH 42
ii) Bulk: Monitor OH- concentration using a pH electrode
iii) Ex-situ: measure Ca2+
concentration using AAS
Na2C03·NaHC03·2H20(s) ~
3 Na(aq)
+
CO~(~)
+
HCOj(aq) Bulk: Monitor conductivity of solution69
+
2H2°(l).
-Bulk: i) pH stat technique 43,47,48
+ 2+ ii) Ca2+ ion selective electrode 49,50 CaC03(S)
+
H(aq) ~ Ca(aq)iii) evolution of CO2 70
+
HCOj(&q)Ex-situ:
Ca2+ analysis using AAS 39+ 2+
CaMg(C03h(l)
+
4H(aq) ~ Ca(aq)Ex-situ:
Ca2+ and Mg2+ analysis using 37+
M~~
+
2C02(g)+
2H20(l)AAS
BaS 04(1)
~ Ba~.:)
+
So!(aq) Bulk: Monitor conductivity of solution 40Bulk: Monitor Ca2+ concentrations
Ca(H2P04h.H20ICaS04(s) ~ using a Ca2+ ion selective electrode.
2Cat~)
+
SO~~&q)
+
2H2P04
(&q) 71+
H2°(l)Ex-situ:
S042-and
P043-analysis usingspectrophotometry
crystals. First, and most crucially, is the fact that the hydrodynamics of the system
are well-defined, which allows accurate modelling of mass transport, and second is
the ability to study the dissolution kinetics of well-defmed crystal surfaces. Table
1.1 provides a summary of some of the dissolution systems which have been studied
using rotating disc methodology.
The RDM represents a significant improvement on particulate based methods,
in that it allows questions (i) to (iii), outlined in section 1.2, to be addressed at the
level of a single crystal face. Moreover, there is the possibility of correlating average
rate data with changes in the microtopography of the surface. 53 Disadvantages of
this method arise when the detection methods used to probe the temporal changes in
chemical composition are considered. As for studies involving particulates, probing concentration changes in bulk solution does not allow interfacial fluxes to be
measured directly, and due to the inherent mixing time of the rotating disc system,
moderate to high frequency dynamic changes in the interfacial rate are not registered.
Moreover, measurements with the rotating disc are often restricted to short times to
avoid the build up of dissolution products in the reaction medium.3 8,42,47
Finally, it is useful to identify the range of interfacial kinetics which may be
characterised with this technique. In principle, the maximum mass transport rate
which can be achieved is limited by one of two factors: (i) the maximum practical
rotation speed of the disc (typically 50-100 Hz) and (ii) the critical Reynolds number
(RecriJ,73 below which flow is laminar. For practical discs (where the diameter is of
the order of 1 cm) the first factor usually limits the mass transport rate. The
maximum mass transfer coefficient for the RDM can be estimated from the following
equation: 73
(1.2)
where k, is the mass transport coefficient, D is the diffusion coefficient of the species
maximum rotation speed of 100 Hz and typical values of D and u of 1 x 10⁻⁵ cm2 s-l and 1 x 10⁻² cm-2 s-l, respectively, this results in kt (max.) ~ 1.5 x 10⁻² cm s-l.
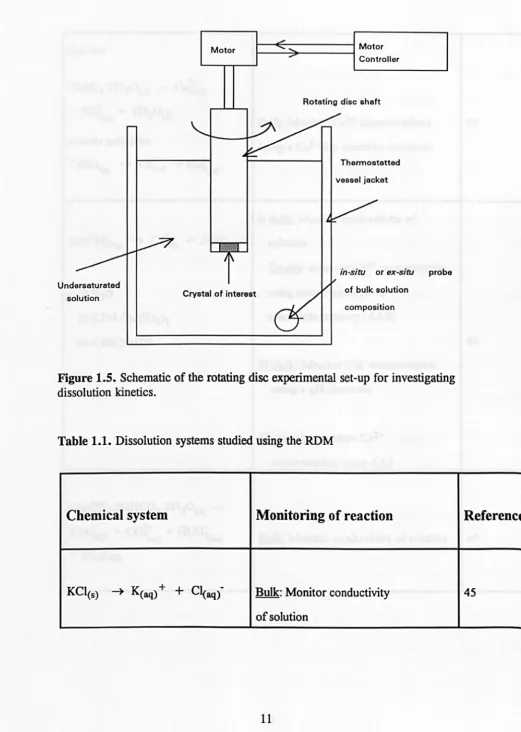
1.2.2.2 Channel flow method with electrochemical detection (CFMED)
1.2.2.2.1 Basic principles
In this method the solid of interest, typically in crystalline form, is located in one wall of a channel (rectangular duct), as shown schematically in Figure 1.6,
through which a solution is flowed under laminar conditions. A detector electrode
is located immediately downstream of, and adjacent to, the crystal surface. Both
amperometric54-59,63 and potentiometric60-62 electrodes have been employed. In
the former case, the detector is the working electrode in a three-electrode
arrangement employed for conventional dynamic electrochemical studies. The
electrode is used to measure the concentration of reactant(s) or dissolution products
reaching the electrode surface which, in tum, is governed by the kinetics of the
dissolution reaction.54-63 A variation of this geometry incorporates a second
(generator) electrode upstream of the solid surface, which can be used to generate reactants which are subsequently collected at the downstream (collector) electrode
after passing over the reactive interface of interest. This type of experiment has been used to obtain dynamic information on the adsorption of dissolution inhibitors
on crystal surfaces.74 Mass transport in the CFMED geometry is easily varied by
changing the solution velocity, the height of the channel or the length of the
reactive interface.
1.2.2.2.2 Applications
The CFMED retains the attractive features of the RDM in that studies may
be carried out on a single crystal face54-63 under conditions where the transport of
well-z
y~x
" " "
"
" "/
"
/
I I I I
Crystal
J---/ Flow ~-"'711-7
[image:30.541.8.528.18.691.2]Detector electrode
Figure 1.6. Schematic of the channel geometry for dissolution studies using the CFMED.
o
TV c;omera
SSR
dissolution cell solution flow
Figure 1.7. Block diagram of the apparatus used by Sunagawa and co-workers, in which the mass transport and surface kinetics can be investigated simultaneously.
saturation
supersaturation
Figure 1.8. Interferometric fringes produced by Mach-Zender interferometry around: left, a crystal surface in a saturated solution; right, a crystal surface in a
defined, calculable and controllable, as discussed above. Additional advantages
accrue from the geometry shown in Figure 1.6. First, precise chemostatic control
of the reaction environment may be exercised: reactants flow into the channel at
the upstream end and products flow to waste downstream, rather than accumulate
in the reaction medium. Secondly, the detector electrode measures either the local
flux (in the case of an amperometric electrode)54-59,63 or local concentration (in
the case of a potentiometric electrode)60-62 of a target solution species, which can
be described in terms of the corresponding flux (and concentration) distribution at
the crystal/solution interface.54-63 The dissolution rate law can thus be deduced in
terms of the interfacial undersaturation. Additionally, transient phenomena can
readily be identified, since changes in the interfacial rate are reflected in the
time-dependence of the detector electrode response.
The CFMED has found considerable application in studies of the kinetics
and mechanisms of the dissolution of natural carbonate minerals in aqueous
solutions, such as calcire54,60,61,63 and dolomite,58 along with related
limestones and chalks.59 The effect of several potential inhibitors, including a
range of dicarboxylate anions55-57 and divalent metal ions62 has also received
attention.
Although CFMED and RDM enable dissolution processes to be
characterised under conditions of well-defined hydrodynamics at single crystal
surfaces,
ex-situ
microscopy techniques, post experiment, demonstrate thatdissolution rates can vary dramatically at the locallevel,53,58 but these
methodologies are only able to measure the effective (average) dissolution rate of a
surface. In this situation, direct
in-situ
microscopic probes of dissolution processes1.2.3 Flow method with in-situ interferometry and microscopy
One approach to probing dissolution rates in-situ at the microscopic level has
been the recent development of an apparatus which can determine directly the
concentration gradient at a dissolving crystal surface and monitor, in real time,
dissolution (or growth) of a particular surface feature under well-defined transport
conditions i.e. as an undersaturated solution is flowed over the crystal. Pioneering
work in this area has primarily been due to Chernov and co-workers75-77 and
Sunagawa and co-workers.24,78-84
The system, as shown schematically in Figure 1.7, consists ofa dissolution
cell, a reservoir of the solution, a circulation pump, a flowmeter and two
thermostatted water baths. The solution runs through the coils of the glass tubes
immersed in the water baths so that the temperature of the solution can be easily and precisely controlled. Control of the temperature of the solution is vital as this is used
to determine and vary the level of solution undersaturation. A thermistor placed next
to the crystal gives an accurate measurement of solution temperature in the
dissolution cell. A centrifugal type pump is used to circulate the solution through the
cell, with typical mean velocities employed in the range 5 - 40 cm s·l. The dissolution
cell is made of rectangular glass tubing (typically 3 x 12 x 250
mm),
with twowindows so that both reflected and transmitted microscopies can be used. The crystal
is glued to the lower window, with the required face exposed to the flowing solution.
In-situ monitoring of the dissolution process is effected through a range of
microscopies, typically Mach-Zehnder (MZ) interferometry, polarising light
microscopy (PM), differential interference contrast microscopy (DICM), phase
contrast microscopy (PCM), phase shift microscopy (PSM), and Michelson
interferometry (Ml). The images are usually obtained via a CCD camera and are
MZ interferometry85 is used to determine the concentration gradient in the
diffusion layer surrounding the dissolving crystal. The concentration gradient results
in a refractive index gradient, which is detected as a shift in the spacing between
interferometric fringes on moving from the crystaVsolution interface to bulk. A
typical representative MZ fringe pattern surrounding a growing crystal is shown in
Figure 1.8. In this case, the concentration at the crystal surface is lower than in the bulk of the solution, and the corresponding refractive index change causes the optical
path of the light to deviate such that the interference fringes bend sharply near the
growing face. A similar effect is observed for dissolution, except that because the
concentration close to the crystal surface is higher than that in the bulk of the
solution, the fringes become wider at the interface. In the MZ system the horizontal light beam passes through the cell in one direction only. This avoids fringe
broadening complications, which would arise in this application if alternative
interferometric techniques, based on the light beam traversing the cell in two
directions, were employed.
Birefringence patterns from PM can be used to locate and characterise
dislocations on the crystal surface in-situ, provided that the crystal has the
appropriate chemical and optical properties. Once these imperfections have been
detected and characterised, DICM, PCM, PSM, or MI, can be used to visualise and
quantifY the in-situ development of etch pits, originating from the dislocations of
interest, with nanometre vertical resolution. To increase the visibility ofthese
microscopic techniques, an objective lens has been specially designed to reduce the
aberration in the observation of a solid surface through a solution layer. 86
These techniques have recently been used to monitor the formation and
expansion ofan etch pit, nucleated at a dislocation characterised by a <110> Burgers
were only nucleated at dislocation sites when the undersaturation in bulk solution, Ub
exceeded a critical value. Below the critical value of the bulk solution
undersaturation, the surface undersaturation, Us was found to be in close agreement
with ub, since under these conditions the crystal was effectively inert to dissolution.
However, once the critical bulk undersaturation was exceeded, dissolution of material
away from the crystal surface resulted in us<ub, demonstrating that, in the
interpretation of crystal dissolution kinetics, Us should never be assumed to be equal
to ab'
A major question in crystal dissolution and growth is whether the two
processes are symmetrically related at the same point on the surface. Both Sunagawa
and co-workers83 and Chernov and co-workers 75,77 have addressed this problem,
using the flow system technique which enables both growth and dissolution processes
originating from the same dislocation to be observed and quantified. This is achieved
by making adjustments to the temperature (and hence under/supersaturation) of the
solution flowing through the cell.
The results of these studies confirmed the earlier theoretical predictions of
several groups87-89 which proposed that although the velocity of step propagation
should be the same for dissolution and growth, the rate of dissolution normal to the
crystal would be much faster than the growth rate, given the same relative interfacial
undersaturation/supersaturation. This is because the removal of material from the
zone of a stress field around the apex of an emerging dislocation releases strain
energy which provides an additional driving force for dissolution. This mechanism
does not apply to crystal growth.
The flow method with in-situ interferometry and microscopy clearly has a
number of attributes which allow questions (i) to (iii) posed in section 1.2, to be
across the crystal in the direction of the optical light path. In practice, a
heterogeneously reactive surface (under conditions of surface control) would lead to
a non-uniform interfacial undersaturation, and therefore introduce some error in the
estimation of the undersaturation at the part of the interface of interest.
1.2.4 Scanned probe microscopy techniques
The development of scanned probe microscopy (SPM) methods has
yielded a wealth of new information on the structure, reactivity and many other
properties of surfaces and interfaces at high spatial resolution. 90-94 In the dissolution
field, atomic force microscopy,95,96 is proving to be particularly useful as a direct
in-situ probe of microscopic kinetics at the micrometre to nanometre level.
1.2.4.1 Atomic force microscopy (AFM)
1.2.4.1.1 Basic principles and applications
AfM95,96 maps the topography of a surface through a sharp tip (1 - 4 J..1m in
length), typically composed of Si3N4 (less commonly used materials include Si02 and Si), attached to the end of a cantilever which is approximately 100-200 J..1m long. The
tip is held in close proximity to the surface of a sample (distances range from 100
A
to touching, depending on the mode of operation97,98), which is scanned underneath
the tip, in a raster pattern, in the
x,
y
plane. The attractive or repulsive forcesexperienced by the tip results in a deflection of the cantilever, which can be used to
provide a topographical map of the surface. In order to achieve measurable
deflections for small force deflections, the material and dimensions of the fabricated
cantilever are such that its spring constant is typically less than 1 N/m, compared to
the force between atoms which is typically of the order of 10
N/m. 95
The cantilever deflections are usually detected by a laser beam reflected from
(although several other detection modes95,99 are available, e.g. the interferometric
mode95). In the constant force imaging mode, a feedback loop is used to keep the
force between the tip and the sample constant, and the z-element of the piezoelectric
positioner adjusts to maintain the reflected beam position constant. Relative
displacements of the z-axis then trace changes in the height of the surface, which are
measured as a function of the relative tip/sample position in the
x, y
plane.The advent of AFM has opened up the possibility of studying topographical
changes on dissolving surfaces, in real time, with nanometre resolution. In particular,
AFM studies are able to assess directly the validity of classical dissolution models on
the atomic scale, such as the Burton, Cabrera and Frank (BCF) model4 and that
developed by Hirth and Pound, 100 which treat the process in terms of the retreat of
monatomic steps across a dissolving surface. Although the theories were developed
specifically for the growth of metal crystals from the vapour phase, they have been
widely applied in the analysis of ionic crystal dissolution and growth.2,3
Initial work in this area concentrated on the ex-situ imaging of dissolved
surfaces. 101 Although sub-nanometre resolution of the structure of these etched
surfaces was achieved, in order to obtain in-situ dynamic information on dissolution
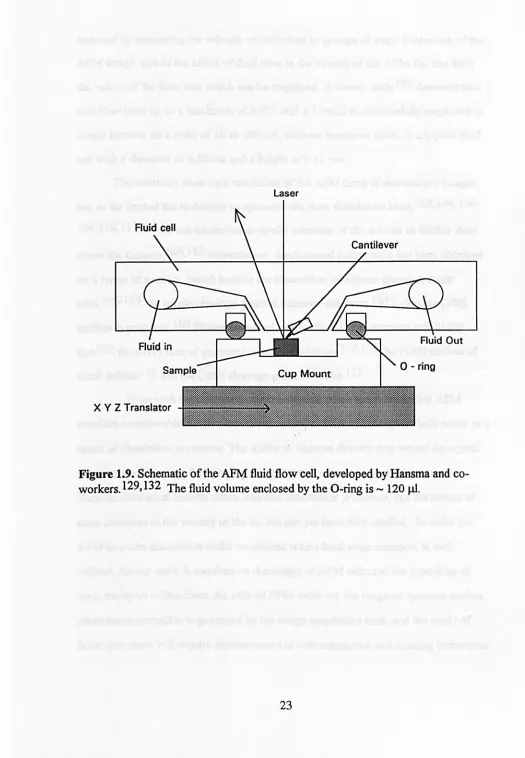
mechanisms, various types of AFM fluid flow cells 1 02,103 have recently been
introduced, such as the one shown schematically in Figure 1.9, which was developed
by Hansma and co-workers. 1 03,104 Imaging a surface under a fluid layer also has the
advantage of increasing the resolution capabilities of the AFM, as it reduces the
action of capillary forces and screens the effect of van der Waals forces by an order
of magnitude. 97 Both factors contribute to strong attractive background forces
between the tip and the sample, resulting in uncontrollable tip movements.
The ability to control the rate of fluid flow through the system, either through
the use of gravity feed or a pump system, enables the process of crystal dissolution to
Laser
Fluid cell
x
Y Z TranslatorFigure 1.9. Schematic of the AFM fluid flow cell, developed by Hansma and c
[image:37.541.6.531.29.787.2]deduced by measuring the velocity of individual or groups of steps. Distortion of the
AFM image, due to the effect offluid flow in the vicinity of the AFM tip, can limit
the values of the flow rate which can be employed. A recent studyl05 demonstrated
that flow rates up to a maximum of 0.032 cm3 s-1 could be successfully employed to
image features on a scale of 10 to 200 run, without excessive noise, in a typical fluid
cell with a diameter of 0.32 cm and a height of 0.11 cm.
The relatively slow time resolution of the AFM (tens of seconds per image),
has so far limited the technique to systems with slow dissolution rates, 1 02, 1 04,
106-108,110,111,113 or has necessitated careful selection of the solvent to further slow
down the kinetics. 1 09,112 Nevertheless, fundamental information has been obtained
on a range of systems, which include the dissolution of organic charge transfer
salts, 106-108 the calcite cleavage plane in aqueous solutions, 104 L-Ieucine (100)
surface in propanol, 109 lithium fluoride (100) surface, 102 L-ascorbic acid (100)
faceI02 the (010) face of gypsum in aqueous solution, 110, III the (100) surface of
alkali halidesl12 and the (100) cleavage plane of barite. 1 13
Even with the limited number of studies, it has been shown that AFM
provides considerable insights into the nanometre structural changes which occur as a
result of dissolution processes. The ability to observe directly step retreat on crystal
surfaces, in-situ, using flow through techniques, has been invaluable in assessing
classical theoretical models which describe dissolution processes, but the nature of
mass transport in the vicinity of the tip has not yet been fully studied. In order for
AFM to probe dissolution under conditions where local mass transport is
well-defined, further work is required on the design of AFM cells and the modelling of
mass transport within them. As with all SPM methods, the range of dynamic surface
phenomena accessible is governed by the image acquisition time, and the study of
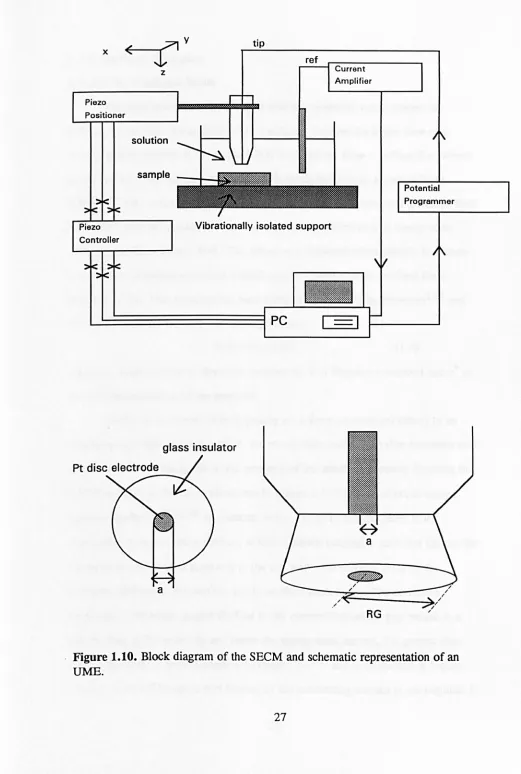
1.3 The Scanning Electrochemical Microscope
The scanning electrochemical microscope (SEeM) 114-118 is one of the
new breeds of scanned probe microscopes. Its response is dependent on mass
transport between a very small electrode and a sample which, in turn, is governed
by chemical reactions occurring at the sample surface. Although the spatial
resolution is not as advanced as for A,FM95,96 and scanning tunnelling
microscopy (STM),91-94 crucially the technique
can
probe both the topographyand the reactivity of a surface with a resolution governed by the dimensions of the
electrochemical tip. The first use of such electrodes to monitor surface reactivity
was by Engstrom and co-workers119,120 who used the amperometric response of
a tiny electrode positioned at different tip/substrate distances to investigate the
nature of the diffusion layer at an active macroscopic electrode! solution interface,
largely in one dimension.
The actual term 'scanning electrochemical microscopy' was introduced in 1989 by Bard and co-workers at the University of Texas at Austin who published a
series of papers describing the instrumentation,121 theory, 121,122 principles and
applications of the technique. 114 Since its introduction, it has provided
considerable insights into, and an understanding of, localised surface reactivity at a
variety of solid/liquid interfaces ranging from biomaterials,123-125
polymersl26-131 and mineraIs I32 ,133 to electrode surfaces. 119,120,134-136 Ion and electron
transfer processes occurring at the liquid/liquid interface137-139 have also been
studied recently.
1.3.1 Basic Principles
The tip employed in the SEeM is an ultramicroelectrode (UME)140-143
i.
e.
one characteristic dimension of the electrode is in the micro metre orpotentiometric electrodes have also been employed, 116, 117 as discussed later in
section 1.3.3.7. An amperometric tip acts as the working electrode in a
conventional dynamic electrochemical circuit which includes a reference electrode
and sometimes an auxiliary electrode, if large currents are to be passed. The probe
UME is usually a metal (such as platinum or gold) disc shaped electrode, of
typical diameter dimensions 0.1 to 25 J,1m, which is embedded in an insulating
glass sheath. The geometry of the tip (electrode plus insulating glass sheath) is
characterised by the value RG, where:
RG =r&/a (1.3)
and
rs
is the radius of the glass sheath plus the electrode anda
is the radius of theelectrode. The tip is attached to piezoelectric elements which allow it to be moved and positioned relative to the sample surface in all three cartesian axial directions, with a resolution down to the nanometre level. If the sample to be studied is a conductor or a semiconductor it
can
be connected as a second electrode throughthe use of a bipotentiostat.134-136 Insulating samples are not part of the
electrochemical cell circuit and are simply positioned underneath the tip. A
schematic diagram of the SEeM and the probe UME utilised is shown in Figure
1.10.
The cell must contain an electroactive species (which is termed the
mediator) which
can
be reduced or oxidised at the tip depending on the nature ofthe experiment. The corresponding current which flows upon electrolysis of the
mediator is amplified by a current to voltage converter and measured via a data
acquisition card in a personal computer as a function of tip/substrate position and
x ~<
---r1
...7\y
Piezo Positioner
Controller
z
solution
sample
ti
ref
Vibrationally isolated support
glass insulator
Pt disc electrode
a
Current Amplifier
RG
[image:41.541.9.530.15.789.2]Potential Programmer
Figure 1.10. Block diagram of the SEeM and schematic representation of an
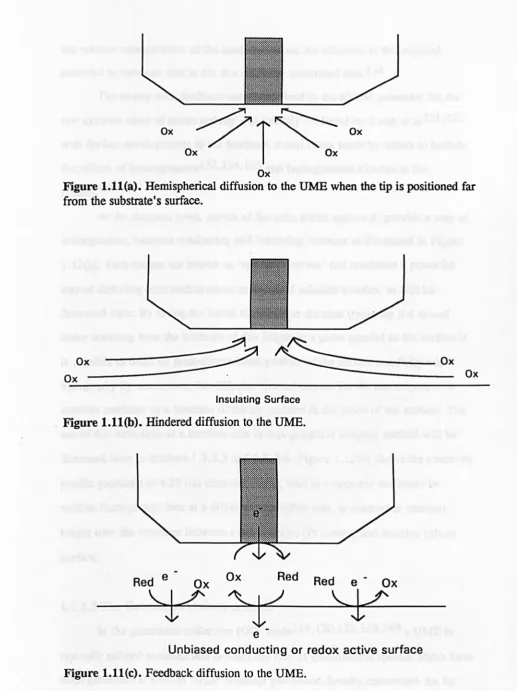
1.3.2 Modes of Operation
1.3.2.1 The Feedback Mode
For most studies the UME tip is held at a potential which causes the
diffusion-controlled electrolysis of the mediator. This results in the flow of a
corresponding current,
i.When the UME is placed far from a surface
(i.e.where
d,
the tip/substrate distance
~10
a),the electrode behaves as a conventional
UME.l44 This results in the establishment of a quasi-hemispherical diffusion field
about the electrode surface and the corresponding attainment of a steady-state
diffusion-limited current,
i(oo).This situation is depicted schematically in Figure
1.11(a) for the diffusion-limited reduction of a mediator in its oxidised form,
denoted by Ox. This situation has been theoretically treated by Newman144 and
Saito,145 resulting in the following expression:
i( (0) = 4neFDac· (1.4)
where
ne
is the number of electrons transferred,
Fis Faraday's constant and c· is
the bulk concentration of the mediator.
As the tip is moved close (typically d<
afor a pronounced effect) to an
insulating or redox inactive surface, the steady-state current,
i value decreases and
is less than
i(oo).This is due to the presence of the substrate partially blocking the
diffusion of Ox to the tip as illustrated in Figure 1.11
(b).This effect is termed
negative feedback. 122, 146 In contrast, when the tip is brought close to a
conducting or redox active surface, which is biased externally such that Ox can
be
regenerated, the species produced at the tip, Red - the reduced form of the
mediator, diffuses to the surface and is oxidised back to Ox. The continual
recycling of the redox couple Ox/Red
in
the electrode/substrate gap results in a
greater flux of Ox to the tip and hence the steady-state current,
i
is greater than
Ox
o:7T~
OxOx
Figure 1.11(a). Hemispherical diffusion to the UME when the tip is positioned far from the substrate's surface.
Ox
---~ ~---
OxOx - - - Ox Insulating Surface
Figure 1.11(b). Hindered diffusion to the UMB.
Red e Ox Ox Red Red e Ox
~
~y
e
Unbiased conducting or redox active surface
[image:43.542.16.533.18.709.2]the relative concentration of the mediator poises the substrate at the required
potential to turnover Red to Ox at a diffusion-controlled rate. 134
The steady-state feedback current attained in the SECM geometry for the
two extreme cases of redox activity was initially modelled by Kwak et aZ121 , 122
with further developments to the feedback model being made by others to include
the effects of heterogeneous 132, 134, 135 and homogeneous kinetics in the
system. 147
At the simplest level, curves of the ratio m(oo) against d, provide a way of
distinguishing between conducting and insulating surfaces as illustrated in Figure
1.12(a). Such curves are known as 'approach curves' and constitute a powerful
way of deducing information about surface and solution kinetics,
as
will bediscussed later. By fIxing the initial tip/substrate distance (typically d ~ a) and
raster scanning over the substrate at this height in a plane parallel to the surface it
is possible to build up three-dimensional profiles of the surface reactivity and
topography by monitoring the diffusion-limited current for the electrolysis of a
solution mediator as a function of the tip position in the plane of the surface. The
use of this technique as a reaction rate or topographical imaging method will be
discussed later in sections 1.3.3.2
and
1.3.3.6. Figure 1. 12(b) shows the reactivityprofile produced as a 25 Ilm diameter Pt tip, held at a potential sufficient to oxidise ferrocyanide ions at a diffusion-controlled rate, is scanned at constant
height over the interface between a redox active (pt coated) and inactive (glass)
surface.
1.3.2.2 The Generation Collection Mode
In the generation collection (GC) mode 119,120, 125, 148, 149 a UME is
typically utilised to detect and monitor the flux of electroactive species which have
9.0
7.5
6.0
-
B
4.5
-
...3.0
(a)
1.5
(b)
0.0
0.0
0.5
1.0 1.52.0
2.5
d/a
Figure 1.12(a). Approach curves demonstrating positive (a) and negative (b) feedback of the SEeM.
I/itx»
2.2
2
1
0.8
0.6
-60
-40
-20
Step
y
lJ,Lm
-40
-20
2.2
2
1.2
1
0.8
0.6
-60
Scan x
I J,Lm
1/1fx»
Figure 1.12(b). Current response of the tip UME as it is scanned in a constant
x,
y
UMB. This is specifically called substrate generation/tip collection
(SG/TC).119,120,125,128 Once again the tip/substrate separation, d, is typically
less than
a.
The substrate is usually a macroscopic electrode (mm dimensions)externally biased in the circuit, through the use of a bipotentiostat. In this mode, the SECM has been used to determine the nature of concentration profiles
established at active macroscopic electrodes 119,120 in comparison with theoretical
predictions, to map areas of electrochemical activity on a heterogeneous electrode
surface119 and to determine the lifetime of short lived intermediates generated at
the substrate electrode. 119,120,136,141 Short lived intermediates have also been
generated at the tip UME and collected at the substrate. This mode is referred to as tip generation/substrate collection (TG/SC).149,150
1.3.2.3 SECM Induced Desorption (SECMID) Techniques
This extension of SECM methodolgy was developed originally to
investigate adsorption/desorption kinetics and surface diffusion rates at solidI
liquid interfaces. 132 In contrast to many of the applications above, which involve steady-state current measurements SECMID employs potential step
chronoamperometry151 to make time dependent measurements of the current.
The tip UME is placed close (d < a) to the surface of interest which is bathed in an electroactive mediator which establishes an adsorption equilibrium
with the surface. Upon stepping the potential at the electrode from a value where
no electrode reaction occurs to one where the mediator is removed at a
diffusion-controlled rate, the position of equilibrium between the mediator and the surface is
perturbed. In order to requilibrate, desorption from the solid/liquid interface must
occur, which is reflected in an enhanced diffusion-controlled tip current,
This concept can be illustrated by considering the adsorption of H + on Ti02,132 the principles of which are illustrated in Figure 1.13. A potential step is applied to the tip electrode which is positioned above the substrate, at a fIxed
distance, such that the electrolysis of the solution component of the adsorbate, in
this case H + to H2 is diffusion-controlled. The consequent decrease in the concentration of H+ in the tip/substrate domain both perturbs the
adsorption/desorption equilibrium, which induces desorption of H+ from the Ti~
surface, and promotes diffusion of H+ through solution into the gap region.
Moreover because the desorption process depletes the concentration of H+ on the
substrate surface directly under the tip, surface diffusion can also provide a path
for the transport of H+ into the gap domain if the surface diffusion coeffIcient is
suffIciently high. The flux of protons at the tip UME, and hence resulting
current-time behaviour, is a measure of the rates of these three processes: (i)
adsorption/desorption; (ii) surface diffusion and (iii) solution diffusion.
1.3.3 Applications of SECM Methodology
Through the use of these different modes of operation, and both
potentiometric and amperometric UMEs, the SEeM has been applied extensively
to (i) the determination of surfaceI23 ,134, 135,152-154 and solution 120, 147-150
kinetics (ii) the fabricationl55-158 and modificationl59-165 of metallic and
semiconductor surfaces (iii) imaging and quantifying transport processes166-172
across porous surfaces and biomaterials and (iv) the topographical 114, 173-175 and
reactivity rate imaging l19, 124, 125, 133, 176,177 of surfaces. These studies (i)
-(iv) involve processes which occur at or across the solidlliquid interface for a wide
Tip UME
Solution Diffusion
Ti02 Single Crystal Surface
1.3.3.1 The Study and Quantification of Heterogeneous Electron Transfer
Processes using SECM
The average value of k" for diffusion to a disc UME positioned far from a
surface (i.e. in bulk solution) is given by: 145
kl = 4D 1m (1.5)
Assuming typical values of D
= 1 x 10-
5 cm2 s-1 anda
= 12. 5 x 10⁻⁴ cm,
k, is thus of the order of 0.01 cm s-l. By decreasing the electrode radius it is possibleto further increase the mass transport rate,
e.g.
for an electrode radius of 1 x 10⁻⁴cm, with D as above, kt
=
0.13 cm s-l. When employed in the SECM geometry,kt depends strongly on the tip/substrate distance and the activity of the surface. For a redox active surface, the SECM geometry may be approximated to that of a thin
layer ce11178 for which:
(1.6)
Hence through the very high mass transport rates attainable
in
SECM geometry at very close tip/substrate separations previously uncharacterised rates ofheterogeneous electron transfer (et) become rate limiting and hence quantifiable.
Initial work
in
this area was initiated by Wipf and Bard 134 whoinvestigated the effect of the heterogeneous et rate at a substrate on the tip current
using the feedback mode. A schematic model defining this system is given
in
Figure 1. 14(a). In this application the substrate is generally a second working
electrode,
kr,t
is a potential dependent rate constant for the tip reaction, kb,s is arate constant for electrolysis (in the schematic: oxidation) at the substrate and kf,s
is a rate constant for reduction at the substrate. The magnitude of the rate constant
for the tip electrode reaction
kr,t
is such that the reduction of Ox to Red occurs at adiffusion-controlled rate. kb,s and kf,s are equated to the standard rate constant of
the et process and the substrate potential by the Butler-Volmer equation. 134