In
ternship rep
ort
: 05/
2016
- 0
7/2016
DAME
N SONG
CAM SHI
PYAR
D CO.,
LT
D
.
Key Pe
rf
orma
nce I
n
dicato
rs
Report about the standardized method to determine KPI targets, use these targets for budgeting new build vessels at Damen Song Cam Shipyard and reflect the workshop performance based on these targets. This report is part of an internship at Damen Song Cam.
Author: Koen Sedee
Study: Mechanical Engineering University of Twente Date: 05/2016 - 07/2016
Internship report: 05/2016 - 07/2016 1
Contents
1. Introduction ... 2
2. Overview ... 3
3. Key Performance Indicators ... 5
3.1. Calculation sheet ... 5
4. Production support ... 7
4.1. Calculation sheet ... 7
5. Workshop performance ... 8
5.1. Calculation sheet ... 9
5.2. Remarks ... 9
6. Damen Standard Calculation Sheet ... 10
6.1. Calculation sheet ... 10
7. Results ... 11
7.1 KPI targets ... 11
7.2. Workshop performance ... 12
7.3. Damen Standard Calculation Sheet ... 13
7.4. Quality results ... 14
8. Conclusion and recommendations ... 16
8.1. Recommendations ... 16
9. Appendices ... 18
Appendix A: KPI Overview ... 19
Appendix B: Production support ... 20
Appendix C: Production rates ... 21
Appendix D: Work instruction: KPI Calculation Sheet ... 23
Internship report: 05/2016 - 07/2016 2
1.
Introduction
This report describes the result of an assignment carried out of Damen Song Cam Shipyard (DSCS). Damen Song Cam Shipyard was opened in March 2014 and is the latest addition to the Damen Shipyards Group. It will be the preferred production location for Damen tug boats up to 60 meters long. With an initial production capacity of 40 boats per year, DSCS is one of the largest yards of the Group and represents Damen’s first Joint Venture yards in Vietnam.
Damen Song Cam Shipyards needs to determine their cost price for outfitting new ships following Integral Direct Cost (IDC) codes in the Damen Standard Calculation Sheet. In this calculation sheet production rates for several IDC codes are required. These should match the production capabilities at DSCS. To determine these values so called Key Performance Indicators (KPI’s) are introduced.
The goal of this report is to create a model in which the inputs for the Damen Standard Calculation Sheet are determined. It provides a description of how KPI’s for DSCS are calculated and how these will be updated and evaluated in the future. The KPI’s are calculated with use of registered hours in the yards’ ERP system, shop orders and engineering data of three ship types: ASD2810, ATD2412 and ASD3212. These types are chosen because of their similarity and the expectation of DSCS to mainly build these types of vessels in the near future. The report also describes the measurements of the performances at the yard and the method to use both the performances and the KPI values to determine the input values for the Damen Standard Calculation Sheet.
This assignment was carried out over a period of 10 weeks. The main deliverables are two standardized calculation templates which are set up in such a way that they are easy to use for DSCS in the future. The assignment is divided in several sub-assignments:
1) Improve KPI’s by extending data
a. Collect data of more yard numbers
b. Standardize the template and update the KPI’s automatically based on finished projects 2) Research how to measure production support
a. Find out which general factors can be used to specify production support 3) Workshop Performance
a. Determine output factor (hours/physical output) for every workshop based on KPI’s b. Determine output for every workshop based actual performance expressed in KPI’s c. Create an overview of performances/efficiencies
4) Ship type budgeting with use of the Damen Standard Calculation Sheet
a. Review the calculation sheet and discuss feedback with Damen Shipyards Gorinchem (DSGo)
b. Determine inputs based on KPI’s and workshop performances c. Determine targets based on contracted budget
Internship report: 05/2016 - 07/2016 3
2.
Overview
In this chapter an overview of the work performed in this assignment is given. The coherence between the subjects is made clear in the graphical overview below.
Engineering data ERP data:
hours + shop orders
IN
P
UT
C
ALCU
LATIO
N
S
KPI Calculation:Finished projects
Workshop Performance: Time dependent
KPI targets
R
EV
IEW
O
UTP
UT
Damen Standard Calculation Sheet
Performance & Efficiency Planning KPI’s per
ship type
ANALYSI
Internship report: 05/2016 - 07/2016 4 As can be seen in the figure, the main inputs are the data collected form the yards’ ERP system and the Engineering data of three ship types. The ERP data consists of hours booked on activities and shop orders. A data dump with hours of all projects is made and used as input for the calculations. The engineering data of the ASD2810, the ATD2412 and the ASD3212 is gathered from the Engineering Department within DSCS and contains specific specifications.
Calculations are made in two separate Excel sheets. The KPI Calculation sheet combines hours from shop orders with engineering data per ship type and calculates the required number of hours per metric unit. In this calculation sheet only the hours from finished projects are taken into account. The outcome is compared with the target KPI.
In the Workshop Performance sheet the output of the six workshops is determined and displayed per quarter. This way the performance, efficiency and the planning status can be analyzed over the year for every workshop.
By analyzing the results of the KPI calculation and the workshop performances, the target KPI’s can be determined. These will be chosen such that the total number of contracted hours for a ship type is not exceeded.
The KPI’s are rewritten into production rate such that this can be implemented in the Damen Standard Calculation Sheet. This sheet is used to calculate the total budget for building a new vessel. Therefore, the production rates and thereby the hours and costs are linked to a prescribed IDC code.
Internship report: 05/2016 - 07/2016 5
3.
Key Performance Indicators
Key Performance Indicators (KPI’s) are defined as variables which are used to evaluate the performance of a particular activity. At DSCS these KPI’s are used to measure the performance at six workshops: the steel the piping, the mechanical, the electrical & HVAC, the carpentry and the painting workshop. The KPI values at DSCS are given in hours per physical output. In the previous assignment 21 KPI’s are determined to use in the production. These KPI expressions are directly linked to shop orders. A shop order contains a budgeted amount of hours, the quantity of required materials, a time schedule and the actual hours spent on the operation description. The complete list of KPI’s can be found in Appendix A: KPI Overview. The KPI’s are defined as followed:
𝐾𝑃𝐼 = 𝐴𝑚𝑜𝑢𝑛𝑡 𝑜𝑓 ℎ𝑜𝑢𝑟𝑠
𝑀𝑒𝑡𝑟𝑖𝑐 𝑢𝑛𝑖𝑡𝑠
In this first set up, the KPI values are determined based on historical data of finished yard numbers. For these vessels the engineering data is assumed to be equal. The calculation sheet is created in such a way that changes in engineering data can be applied easily. Engineering data can changes over time due to design changes or a decrease or increase of production tasks which are taken over by or from an other yard.
In cooperation with the Engineering and Work Preparation department this engineering data is collected from different sources. It is important to collect this data for all ship types in a structured way to get a reliable KPI. In the previous assignment report, the sources of the engineering data can be found. Because of the expectation to build mainly the ASD2810, ATD2412 and the ASD3212, only these vessels are taken into account. Therefore, the KPI values are only calculated based on these ship types.
The KPI’s are used to determine standards, or norms, in the production facilities at DSCS, based on registered hours in the ERP system of a finished project. The KPI’s will be updated when a yard number is finished, which makes the calculation time independent. More data will lead to a more reliable KPI value for workshop performance measurements and budgeting purposes.
In section 6.1, target KPI values are determined based on the total contracted hour budget. These target KPI’s should be reached by production to complete the vessel within the contracted number of hours.
3.1.
Calculation sheet
In the previous assignment a calculation method was set up to determine KPI values for DSCS. During this assignment KPI values were calculated manually and based on only two yard numbers. In this assignment an automated calculation sheet is made to simplify the updating process of the KPI’s. In comparison with the previous assignment also more data (finished yard numbers) is taken into account to determine a more reliable KPI value. In the Excel file ‘KPI_Calculation_Sheet.xlsx’ the calculation can be found.
Internship report: 05/2016 - 07/2016 7
4.
Production support
The KPI values are all linked to shop orders and the production facilities at DSCS. However, for a complete project more hours are required. These hours are not booked on shop orders, but only on activities. To complete the price calculation also these hours should be taken into account.
The production support hours are divided into two groups: technical department and production. The hours which are not made in production but mainly in the office are assigned to the technical department group. Production hours, which are not directly linked to a workshop, are assigned to the production group. For these hours a standard needs to be found per ship type. This is done in two ways. The production support are bookend on activities. With use of available data of previous projects an average can be taken to determine the standard. The hours can be extracted from the ERP system. Further, it is stated that the production support hours should be equal to 30% of the direct production hours. Therefore, averages are taken as a starting point and later adjusted to comply this rule.
Production support consists of different 18 activities. The full list can be found in Appendix B: Production support.
4.1.
Calculation sheet
To define a standard for the production support, data is extracted from the ERP system and inserted in the ‘KPI_Calculation_Sheet.xlsx’ Excel file at the ‘DataProdSup’ tab. From this tab the hours are automatically copied to the tabs with the hours per yard number. The average values per ship type can be found in the ‘KPI Overview’ tab again.
It should be noted, that the hours booked on the activities of previous projects do not represent all the required hours per activity. Due to standardization and changing of activities at DSCS, hours are adjusted to new budgets. This is done in cooperation with the Work Preparation department.
Internship report: 05/2016 - 07/2016 8
5.
Workshop performance
After determining the KPI values based on finished projects, a similar method can be used to measure the performance in the workshop over time. With use of the shop orders of all the yard numbers, an analysis can be made about the output, the efficiency and the planning. It should be noticed that the method to measure the workshop performance is a first setup, and is done with the available historical data. Using this method as a guideline, together with the production department the collection of data should be improved.
The workshop performance will be determined every month and measured over a period of 3 months. Only the shop orders which are closed in this time period are taken into account in the calculation. This information can be extracted from the ERP system.
The output of a workshop is linked to the engineering data, which is determined for three ship types. When the total number of yard numbers and their engineering data are summed, a total output for these ship types is found. This is used to calculate the actual KPI value for that quarter. The KPI value for this quarter can now be compared with target KPI. It should be noted that this value does not represent all the actual output of the workshop since vessel type of which the engineering data is unknown are not taken into account. But considering the building portfolio the selection of shop orders is expected to be large enough to provide a representative KPI value.
The efficiency of a workshop can be calculated using the planned and the actual hours related to a shop order. Since DSCS is standardizing the operation descriptions, which are part of the shop orders, for every ship type, the efficiency of a certain operation description can be analyzed. Therefore, the total sum of all budgeted hours are compared to total sum of the actual hours. This analysis is done monthly for all the ship type and for only the ASD2810, ATD2412 and ASD3212. Besides, the efficiency of the complete yard is determined by comparing all the actual and budgeted hours over a selected period of time. The efficiency is defined as:
𝐸𝑓𝑓𝑖𝑐𝑖𝑒𝑛𝑐𝑦 = 𝐴𝑐𝑡𝑢𝑎𝑙 ℎ𝑜𝑢𝑟𝑠
𝑃𝑙𝑎𝑛𝑛𝑒𝑑 ℎ𝑜𝑢𝑟𝑠
Based on the performances and the efficiencies it can be concluded which operations need attention or should be adjusted. In cooperation with workshop managers it can be decided which actions should be taken to increase the efficiency. Further, based on overall efficiency it can be concluded if the yard is improving in general. This could be due to experiences of the employees or general improvements due to for example the implementation of lean six sigma standards.
Internship report: 05/2016 - 07/2016 9
5.1.
Calculation sheet
In the Excel file ‘WS_Performance.xlsx’ the calculations are made. The main input is an data dump from the ERP system, the same as used in the KPI Calculation sheet. This data is inserted in the ‘DataProd’ tab. In the ‘FilterQx’ tabs the data of the shop orders, which are closed in this certain quarter, are filtered out. This rough information is used in the ‘SortingQx’ tabs. Here the shop orders are sorted based on operation description and ship type. Per operation description the number of shop orders per ship type and the total sum of planned and actual hours are showed. Based on the known engineering data of the three ship types, the output in metric values is determined. Furthermore, the average number of days of the shop order differing from the planned start and finish date is calculated.
At the top of the sheet the total number of shop orders per ship type can be found. Also the total number of filtered shop orders in this period of time is shown. The percentage shows which part of the total amount of shop orders is taken into account. The percentage which is not taken into account consists of shop orders of other ship types or with an not standardized operation description. The higher the percentage, the more reliable the results.
In the ‘Calculation’ tab the sorted data is used to analyze the performance, efficiency and the planning. First the efficiency is calculated, comparing planned and actual hours. The performance is calculated based on total amount of planned and actual hours and the total output. The outcome should be equal to the KPI value, both the planned KPI and actual KPI. At the top of the sheet, the year can be filled in. This is used to determine the start and end date of the 4 time periods and filter and sort the data. In the ‘Performance’, ’Efficiency’ and ‘Planning’ tabs the results are graphically shown. A work instruction for this sheet can be found in Appendix E: Work Instruction: Workshop Performance.
5.2.
Remarks
The Workshop Performance calculation sheet analyzes the performance in the workshops based on planned and actual hours and on assumed standard engineering data. Of course, in reality the booked hours could contain some extra work due to for example design changes or mistakes. This could be seen as a form of inefficient work. However, the reasons of the inefficiency cannot directly be concluded from the analysis. The results should therefore always be discussed with the workshop managers.
Further, the engineering data should be kept up to date. The Production, Engineering and Work preparation department should therefore work closely together. Improper engineering data noticed in production needs to be reported to the Work Preparation and Engineering department. Drawings need to be adjusted and major changes in the design influences the KPI value. Because a large value is taken for the metric units to calculate the KPI, small changes in engineering data will not influence the KPI value.
Internship report: 05/2016 - 07/2016 10
6.
Damen Standard Calculation Sheet
The Damen Standard Calculation Sheet is used for pricing a new build vessel. The sheet is standardized in such a way that it usable for every Damen shipyard. The costs are sorted based on Integral Direct Cost (IDC) codes. By filling in all the parameters the total price is determined based on material and labor costs. The outcome is the total contracted budget with DSGo.
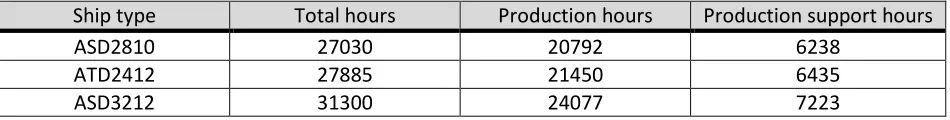
Since Damen Song Cam Shipyards only carries out the outfitting of delivered hulls, not the full sheet is used. This assignment thereby focusses only on hours, which are used to determine the labor costs, and material budget for a project. Therefore, a major part of the sheet is hidden because this is not used. The total amount of hours for every ship type is defined on forehand. This amount of hours should not be exceeded. An overview of total hours per ship type can be seen in Table 1. The production support are estimated to should be 30% of the total production hours.
Ship type Total hours Production hours Production support hours
ASD2810 27030 20792 6238
ATD2412 27885 21450 6435
[image:11.612.67.542.265.325.2]ASD3212 31300 24077 7223
Table 1: Target hours per ship types
6.1.
Calculation sheet
To fill in the sheet correctly, first the right production rates definition should be determined. This is done by redefining the KPI values such that they can be filled in the calculation sheet directly. Therefore, the operation descriptions are linked as a group to a certain IDC number, see Appendix C: Production rates for the details. This is done in cooperation with the contracting managers in DSGo. The IDC number is linked to the production rates and amounts of hours used in the Damen Standard Calculation Sheet. The calculation sheet can be found in the Excel file ‘KPI_Calculation_Sheet.xlsx’ in the ‘Input Calc. Sheet’ tab. Per IDC number, and for the three ship types, the KPI is calculated based on average and best performing vessel (B.P.V.), the best performing yard number. Then, the targets are chosen such that the total budget of hours matches the total contracted hours as can be found above. With use of these targets the total amount of hours per group of operation descriptions can be calculated. The targets are determined in cooperation with the Planning department.
Theoretically, the budget for the three ship types could be determined now by combining the targets and the engineering data. An overview of the total amount of hours per workshop can be found on the right sight of the sheet. Also the differences with the B.P.V. are given.
Internship report: 05/2016 - 07/2016 11
7.
Results
The outputs of both the KPI Calculation sheet and the Workshop Performance sheet could be useful for DSCS. The main output of the KPI calculation sheet are the targets which can be used in combination with the Damen Standard Calculation sheet and to analyze the workshop performance. The results in the workshop performance sheet could be used to point out where DSCS should improve their performance and reduce costs. Also the influence of the implementation of improvements could be analyzed. Based on the current available data the following results are found.
7.1 KPI targets
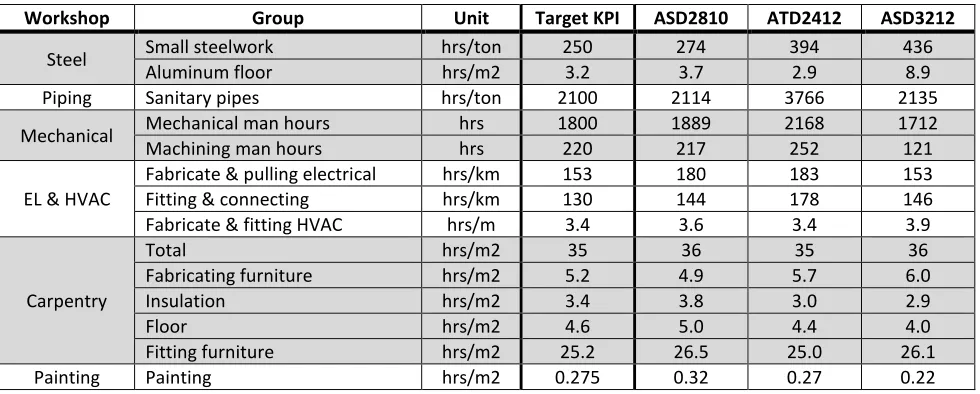
In the KPI Calculation sheet the differences between the actual KPI’s per ship type and the target KPI’s can be seen. Since the targets are based on IDC codes and the KPI values are based on groups of operation descriptions, not all targets can be translated back into the predefined KPI’s. For the targets which can be translated back into the KPI’s, an overview is given in Table 2. For some of the groups a KPI cannot be set, mainly in the Mechanical workshop. Since there are major differences in mechanical work for the ships, it is chosen to set hour budgets instead of KPI.
In this assignment, it is assumed that the production targets for every ship type are the same. However, since the targets are based on the ASD2810, for the ATD2412 and the ASD3212 a difficulty factor may be taken into account, because a similar operation could be more difficult to execute on another ship. This has been done for calculating the total budget, but not for showing the differences between the actual KPI and the target KPI for all ship types. Therefore, some compared KPI values may be not fully representative.
Workshop Group Unit Target KPI ASD2810 ATD2412 ASD3212
Steel Small steelwork hrs/ton 250 274 394 436
Aluminum floor hrs/m2 3.2 3.7 2.9 8.9
Piping Sanitary pipes hrs/ton 2100 2114 3766 2135
Mechanical Mechanical man hours hrs 1800 1889 2168 1712
Machining man hours hrs 220 217 252 121
EL & HVAC
Fabricate & pulling electrical hrs/km 153 180 183 153
Fitting & connecting hrs/km 130 144 178 146
Fabricate & fitting HVAC hrs/m 3.4 3.6 3.4 3.9
Carpentry
Total hrs/m2 35 36 35 36
Fabricating furniture hrs/m2 5.2 4.9 5.7 6.0
Insulation hrs/m2 3.4 3.8 3.0 2.9
Floor hrs/m2 4.6 5.0 4.4 4.0
Fitting furniture hrs/m2 25.2 26.5 25.0 26.1
[image:12.612.67.557.413.610.2]Painting Painting hrs/m2 0.275 0.32 0.27 0.22
Table 2: KPI targets and actual KPI per ship type
Internship report: 05/2016 - 07/2016 12 0% 50% 100% 150% 0 0,1 0,2 0,3 0,4
Target KPI Q1 Q2 Q3 Q4
h
rs
/m
2
[image:13.612.79.361.315.449.2]Painting
Figure 1: Graphical representation of the performance in the paint workshop
0% 50% 100% 150%
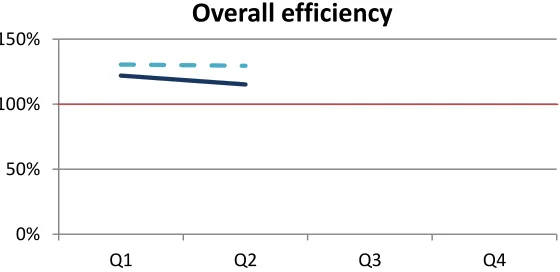
Q1 Q2 Q3 Q4
Overall efficiency
Figure 2: Graphical representation of the overall efficiency at DSCS
group. Based on the chosen targets, it is not possible to translate the mechanical and machining man hours into these groups. For these groups hour budgets are used instead of KPI’s.
7.2. Workshop performance
The performance of a workshop is measured in two ways. The output at the workshop is measured and compared to the KPI target, the efficiency is determined by comparing the planned and actual hours. Per workshop a graph is made which displays the target KPI, the planned and actual output , the efficiency based on planned and actual hours for the three ship types and the efficiency based on all planned and actual hours for every ship type.
In Figure 1, as an example, the graph for the painting workshop can be found. It can be seen that in the first quarter the actual output is above the target and above the planned KPI. Thereby, also the efficiency is above 100% which means that more time was spent on this operation than planned. In the second quarter, the actual KPI is more or less equal to the target KPI. However, the planned output is still lower than the actual. Therefore, the efficiency is still above 100%. In reality this means that the planned KPI is too low and should be adjusted to the target KPI.
[image:13.612.271.551.540.676.2]In the calculation sheet, the results for other workshops can be found. This sheet should be updated every month. Important is to discuss with the workshop managers the reasons why the actual hours are higher than the planned hours. Based on this information steps could be taken to improve the process. Figure 1 displays the performance based
on the KPI groups. To show the overall efficiency per workshop, all the planned and actual hours are added and used to calculate the overall efficiency. In Figure 2 this efficiency for the whole yard can be seen. It could be expected that this line will slightly approach the 100% due to experience of the employees and improvement in the process.
Target KPI
Planned output
Actual output
Efficiency 3 ship types
Internship report: 05/2016 - 07/2016 13
7.3. Damen Standard Calculation Sheet
Three tabs of the Damen Standard Calculation Sheet need to be filled in to get the total budget for a new build ship. First the vessel details, these are derived from the engineering package of the ship. Because it is not sure whether the engineering data for the ATD2412 and the ASD3212 is valid, only the results for the ASD2810 are shown. Since the model will only work correctly with using the same data source, the engineering data for these ship should be rechecked and be based only on shop orders instead of drawings. The engineering data for the ASD2810 is based on shop orders and based on the percentage of work that will be executed by DSCS in the future. Since more work will be done by Song Cam, less work will be done at DSCS.
In Table 3 the required inputs per tab in the calculation sheet are shown. Also the corresponding IDC code is given. A full list of projects rates and the operations included is given in Appendix C: Production rates.
Tab IDC code Description Unit Value/Target
V
es
se
l d
et
a
ils
101 Hull outfitting weight (steel) metric ton 2.168
101 Hull outfitting weight (aluminum) metric ton 1.037
301 System pipes (class I, II, III) metric ton 3.747
301 Special pipes st.st., cu, conifer metric ton 0.066
402 Cable length km 14.642
401 Cable tray length km 14.642
701 Joinery/accommodation m2 82.5
Pro
je
ct
ra
tes
169 Paint application hrs/m2 0.275
Average plate thickness steel mm 10
Average plate thickness aluminum mm 6
Density steel kg/m3 7850
Density aluminum kg/m3 2755
169 Total surface for paint system m2 15509
101 Outfitting/small steel hrs/ton 250
101 Outfitting/small aluminum hrs/ton 192
301 System pipes (class I, II,III) hrs/ton 1450
301 Special pipes st.st., cu, cunifer hrs/ton 3500
401 Mounting cable trays hrs/km 130
402 Cable pulling and connecting hrs/km 153
701 Carpentry hrs/m2 35
101 Mounting buyer supply/seller purchase hrs 1040
Ca
lc
u
la
tio
n
1 Project Manager hrs 360
3 Engineering hrs 270
4 Procurement hrs 150
5 Material coordinator hrs 360
6 Distribution logistics hrs 700
9 Transport and cusoms coordinator hrs 135
9 Crane operator hrs 54
14 Work preparation hrs 360
Internship report: 05/2016 - 07/2016 14
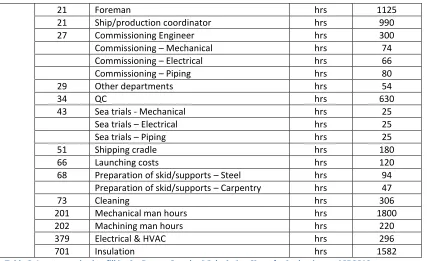
21 Foreman hrs 1125
21 Ship/production coordinator hrs 990
27 Commissioning Engineer hrs 300
Commissioning – Mechanical hrs 74
Commissioning – Electrical hrs 66
Commissioning – Piping hrs 80
29 Other departments hrs 54
34 QC hrs 630
43 Sea trials - Mechanical hrs 25
Sea trials – Electrical hrs 25
Sea trials – Piping hrs 25
51 Shipping cradle hrs 180
66 Launching costs hrs 120
68 Preparation of skid/supports – Steel hrs 94
Preparation of skid/supports – Carpentry hrs 47
73 Cleaning hrs 306
201 Mechanical man hours hrs 1800
202 Machining man hours hrs 220
379 Electrical & HVAC hrs 296
[image:15.612.67.494.69.330.2]701 Insulation hrs 1582
Table 3: Inputs required to fill in the Damen Standard Calculation Sheet for budgeting an ASD2810
Using these values in the Damen Standard Calculation Sheet gives the total amount of budgeted hours. An overview of the hours per workshop are given in Table 4.
Workshop Target hours
Steel 1875
Piping 3449
Mechanical 2119
EL & HVAC 4531
Carpentry 4517
Painting 4265
Total production 20756
Total production support 6274
Total overall 27030
Table 4: Overview total hours per workshop regarding an ASD2810
It can be concluded that using the chosen targets results in a total budget which is equal to the contracted budget. Also the production support hours are 30% of the total production hours.
7.4. Quality results
The files could be used now to analyze the data. However, the validity of the data should be discussed. Improper use of the data will lead to a wrong analysis. The quality of the data, and thereby the results, depends on several inputs.
[image:15.612.67.272.389.520.2]Internship report: 05/2016 - 07/2016 15 are not included in the calculation, the percentage is about 80%. For the ASD3212 the standard operations are not used, the hours are filled in manually. Therefore, it is difficult to draw conclusions for this ship type. Standard operations should be used to make a reliable analysis.
In the workshop performance sheet, the percentage of shop orders which are used in the calculation is determined. Therefore, the total number of shop orders used in the calculation is compared to the total number of shop orders processed in a certain quarter. The result for year 2016 can be found in Table 5. It should be said that the total amount of closed shop orders is quarter 1 is much more than in quarter 2.
Quarter 1 Quarter 2 Quarter 3 Quarter 4
[image:16.612.79.379.215.244.2]44% 40% - -
Table 5: Percentage of shop orders taken into account in the calculation for 2016
The actual hours booked on a shop order can be higher than planned for several reasons. For example, changes in the design during the outfitting process will costs extra time. Changes charged to DSGo are booked on the Extra Works operation. Extra work due to mistakes or non-charged changes are booked on the same shop order. Therefore, to draw conclusions regarding efficiency it is important to interpret the data together with the workshop managers.
Internship report: 05/2016 - 07/2016 16
8.
Conclusion and recommendations
The goal of this assignment was to create a tool to measure workshop performance expressed in KPI values, to set targets based on the workshop performance and use historical workshop performances to validate budgets per IDC group used in the Damen Standard Calculation sheet at Damen Song Cam Shipyard. Thereby a standard working method is created for budgeting.
It can be concluded that the created worksheets are suitable to determine KPI targets for both the production and the production support. The KPI factors determined before are combined and rewritten to production rates for the Damen Standard Calculation Sheet. These production rates are therefore coupled to IDC codes following the Damen standards. The calculation worksheets are made such that the values can be updated quick and easily. From now on, every month the sheets can be updated and the results be presented to the management team and the workshop managers.
The chosen targets are useful for budgeting the ASD2810. The total amount of budgeted hours calculated using the Damen Standard Calculation Sheet equals the total target budget. The production rate targets can be used as a target in the workshops. However, when using the targets for budgeting the ATD2412 and the ASD3212 the total amount of hours is much lower than the target. This could be due to incomplete engineering data or not reachable targets. In that case the difficulty factors should be used, these should be chosen in cooperation with the production department and work preparation. The engineering data should be checked using only the information on the shop orders.
The graphs regarding the workshop performance give a clear indication about the measurement method. The results should be discussed with the workshop managers to improve the input data for this analysis in the future. However, when the input data could be optimized this could be a useful tool the determine the performance at DSCS. For now, it is a first step for using the available data to start discussions. Based on these discussions between management, production, engineering, planning and work preparation actions to improve the process should be determined.
8.1.
Recommendations
Several recommendation are stated to improve the measuring method of KPI’s and workshop performances:
- It is important to keep the files up to date by adding new data. In the near future more yard numbers will be finished and thereby more data will be available. Having a bigger data base, with more historical data, will improve the quality of the KPI’s. Since the operation descriptions are more standardized, more shop orders will be taken into account in the calculations.
Internship report: 05/2016 - 07/2016 17 - Hours should be booked correctly. A clear difference should be made between extra hours due
to rework because of mistakes made by DSCS, and extra hours due to changes in clients requests. The extra hours due to DSCS should be booked on the shop order, the other hours should be booked on the ‘ Extra work’ operation description.
- Workshop managers should focus more on the opening and closing date of the shop orders. This will give a more representative workshop performance per month. It will also help to adjust the planning, if a shop order is constantly opened or closed after planned, the planning should be adjusted. Now, the shop orders are often kept open because of a delay in the delivery of the materials. Since more often materials are pulled to DSCS, the delay will be reduced.
- Workshop managers should be involved in the process. They need to understand how the engineering data and the registered hours are used and what the importance is to gather this data strictly. They must also understand that ‘inefficiency’ is not always directly related to production.
- In the current analysis it is hard to determine the cause of inefficiency or a too high KPI value. By introducing a factor, which determines what percentage of the available time is used to add value to the product, it could be measured how efficient the time is used.
Internship report: 05/2016 - 07/2016 18
9.
Appendices
- Appendix A: KPI values overview - Appendix B: Production support - Appendix C: Production rates
Internship report: 05/2016 - 07/2016 19
Appendix A: KPI Overview
Workshop KPI group Operation description Unit
Steel
Small steelwork Fitting floor frames hrs/ton
Fabrication & installing railing hrs/ton
Steel work whole vessel hrs/ton
Aluminum floor Fitting alum. floor plates hrs/m2
Thruster Fitting RP and shaft bearing /Welding support for Propulsion hrs
General Fitting zinc anodes %
Fitting tyre fenders %
Inventory for sea trials %
Fitting life saving equipment %
Fitting text plates & hull marking %
Fitting inventory %
Fitting small deck equip. %
Install fixed ballast %
Piping
Steel pipes Fabricating pipes + Pressure test hrs/ton
Fitting pipes & components + Test hrs/ton
Fitting dis. sanitary hrs/ton
Hydraulics Fitting hydraulic sys + Flushing hrs/ton
Sanitary pipes Fitting sup. sanitary hrs/ton
General Fitting text plates for pipes %
Mechanical
Fitting equipment Fitting Propulsion hrs
Fitting winches hrs
Fitting main equipment hrs
Fitting small equipment hrs
Fitting deck equipment hrs
Fitting vent. equipment hrs
Fitting life saving equipment hrs
Alignment Final alignment hrs
Machining double plates hrs
General Machine small steel parts hrs
Filling lubricants and ELC hrs
Electrical & HVAC
Fabricate & pulling electrical Cutting cables hrs/km
Pulling cables hrs/km
Fitting & connecting Fitting & connect elec. equipment hrs
Fitting switchboards hrs
Fitting nautical equipment hrs
Fitting copper anodes hrs
Fitting batteries hrs
Fabricate & fitting HVAC Fabricate HVAC ducting hrs/m
Fitting HVAC system hrs/m
Carpentry
Fabricating furniture Fabricate furniture hrs/m2
Insulation Fit insulation walls & san. pipes hrs/m2
Fitting insulation exhaust sys. hrs/m2
Floor Fitting synthetic floor hrs/m2
Fitting furniture Fitting carpentry hrs/m2
Fitting equip. for carpentry hrs/m2
Painting
Painting Paint in outfitting hall hrs/m2
Final painting hrs/m2
Internship report: 05/2016 - 07/2016 20
Appendix B: Production support
Workshop KPI group Including Unit
Technical department
Project Manager hrs
Purchaser hrs
Material Coordinator hrs
Planner hrs
Job Preparator hrs
QC Controller/Supervisor hrs
Commissioning Engineer hrs
Engineering support PROD SUP hrs
PROD SUP on 225 hrs
Photo surveyor hrs
Custom Transport Coordinator + Staff hrs
Warehouse Employee hrs
Production
Crane Operator hrs
Foreman hrs
Ship Coordinator hrs
Scaffolding Worker/Ship transport/Re-block hrs
Launcher hrs
Internship report: 05/2016 - 07/2016 21
Appendix C: Production rates
IDC Project rates KPI group Operation description Unit
169 Paint application Painting
Paint in outfitting hall
hrs/m2 Final painting
Final touch up and cleaning
101 Outfitting/small steel Small steelwork
Fitting floor frames
hrs/ton Fabrication and installing railing
Steel work whole vessel
101 Outfitting/small aluminum Aluminum floor Fitting alum. floor plates hrs/ton
301 System pipes (class I, II,III)
Steel pipes
Fabricating pipes + Pressure test
hrs/ton Fitting pipes & components + Test
Fitting dis. Sanitary
Hydraulics Fitting hydraulic sys + Flushing
General Fitting text plates for pipes
301 Special pipes st.st., cu, cunifer Sanitary pipes Fitting sup. Sanitary hrs/ton
401 Mounting cable trays Fitting & connecting
Fitting & connect elec. Equipment
hrs/km Fitting switchboards
Fitting nautical equipment Fitting copper anodes Fitting batteries
402 Cable pulling and connecting Fabricate & pulling electrical Cutting cables hrs/km
Pulling cables
701 Carpentry
Fabricating furniture Fabricate furniture
hrs/m2
Floor Fitting synthetic floor
Fitting furniture Fitting carpentry
Fitting equip. for carpentry
General Inventory for sea trials
Install fixed ballast
101 Mounting buyer supply/seller
purchase
Thruster Welding support for propulsion
hrs General
Fitting zinc anodes Fitting tyre fenders Inventory for sea trials Fitting life saving equipment Fitting text plates & hull marking Fitting inventory
Fitting small deck equip. Install fixed ballast
201 Mechanical manhours Fitting equipment
Fitting Propulsion
hrs Fitting winches
Fitting main equipment Fitting small equipment Fitting deck equipment Fitting vent. equipment Fitting life saving equipment
Internship report: 05/2016 - 07/2016 22
General Filling lubricants and ELC
202 Machining manhours Alignment Machining double plates hrs
General Machine small steel parts
379 Electrical & HVAC Fabricate & fitting HVAC
Fabricate HVAC ducting
hrs/m Fitting HVAC system
General Tack weld 370 support
701 Insulation Insulation Fit insulation walls & san. pipes hrs/m2
Internship report: 05/2016 - 07/2016 23
Appendix D: Work instruction: KPI Calculation Sheet
The KPI values should be updated after a project is finished. In this section is described how to do this properly. The Excel file ‘KPI_Calculation_Sheet’ is used here.
KPI Calculation
1) Insert new production data
a. Extract shop order data of all finished projects from the ERP system into an Excel file. b. Copy all data, except the first row with titles. So A2:W2 till the end.
c. Open the the ‘KPI_Calculation_Sheet’ file, tab ‘DataProd’. d. Paste the data in cell A2.
2) Insert new production support data
a. Extract data of finished project from the ERP system into an Excel file and copy. b. Add yard number of the project at the first row in the ‘DataProdSup’ tab. c. Paste hours at corresponding row underneath.
3) Hours tab
a. Open the hours tab of the considered ship type.
b. Copy the last added column, paste it next to it and change the yard number. c. Add the activity hours manually.
d. At the top, change the number of finished yard numbers to the right amount. The averages are taken over this amount of finished yard numbers.
Input Calculation Sheet
1) Unhide the columns to be considered, based on ship type.
2) In the Actual KPI values column, the KPI is determined based on the average hours of finished projects and based on the B.P.V.
a. Choose the best performing vessel (B.P.V.) yard number. Therefore, use the ‘hours sheet’.
b. Change input column, based on B.P.V., by selecting the column and replace the column character.
3) In the Targets column first the new engineering data is determined. This changed because some work is moved to the Song Cam yard.
a. New engineering data is based on percentage of work that is still executed by DSCS. This percentage could be changed.
b. If the engineering data is changed in the Engineering tab based on new shop orders, the percentage should be reset to 100%.
4) The Target KPI’s can be chosen. By changing this value, automatically the total amount of hours and the difference with the B.P.V. changes. Also the total amount of target hours related to the workshop changes in the table on the right side.
Internship report: 05/2016 - 07/2016 24
Appendix E: Work Instruction: Workshop Performance
The workshop performance sheet should be updated every month. How to do this properly is described in this chapter. The Excel file ‘WS_Performance’ is used.
1) Insert new production data
a. Extract shop order data of all finished projects from the ERP system into an Excel file. b. Copy all data, except the first row with titles. So A2:W2 till the end.
c. Open the the ‘WS_Performance’ file, tab ‘DataProd’. d. Paste the data in cell A2.
2) Insert target KPI’s in the ‘Calculation’ tab
a. Copy the target KPI’s from the KPI Calculation sheet and paste these in the ‘Target KPI’ column R
3) Add the current year in the ‘Calculation’ tab. Calculations are made automatically.
a. The ‘FilterQx’ tabs filter out all the closed shop order in the corresponding quarter. b. The ‘SortingQx’ sort and take out all the required data from the ‘FilterQx’ tab.
c. In the ‘Calculation’ tab the Overall Efficiency is calculated based on all planned and actual hours for every ship type.
d. The Performance is calculated, based on only the ASD2810, ATD2412 and ASD3212. e. The number of days deviating from the planning for the start and finish data is
determined.