Munich Personal RePEc Archive
To Root or Not to Root? The Economics
of Jailbreak
Leung, Tin Cheuk and Ng, Travis and Ho, Chun-Yu and
Chao, Hong
5 June 2013
Online at
https://mpra.ub.uni-muenchen.de/47409/
To Root or Not to Root?
The Economics of Jailbreak
Hong Chao
Shanghai Jiao Tong University
Chun-Yu Ho
Shanghai Jiao Tong University
Tin Cheuk Leung
CUHK
Travis Ng
CUHK
∗June 5, 2013
Abstract
We construct a structural model that allows us to jointly estimate the demand for smartphones and paid apps using a Bayesian approach. Our data comes from more than 500 college students in Hong Kong and Shanghai. We find that the moral cost rather than the monetary cost of jailbreaking smartphones determines its prevalence. Users mainly jailbreak smartphones to use paid apps for free, a reason more important among Android users than iPhone users. Paid apps contribute the lion’s share of the profits (between 53% and 71%) for both the Android and iPhone. Strictly prohibiting jailbreaking would decrease the aggregate market share of smartphones in the cell phone market. Apple, however, would sell even more iPhones at the expense of Android smartphones.
JEL Code: L14, L86, K42, O34
Keywords: jailbreak; demand estimation; smartphones
∗We would like to thank Vincci Pun of Cherrypicks for sharing her insight on the apps industry. We also
1
Introduction
Jailbreaking is a process that unlocks restrictions on smartphones imposed by either the
manufacturers or carriers.1 Jailbreaking enables the user of a smartphone to personalize
the phone settings (e.g., the strength of the Wifi antenna). Users of jailbroken iPhones can
also sideload unauthorized apps, legal or illegal, from platforms other than the iTunes App Store. Jailbreaking can be deemed a violation of the 1998 Digital Millenium Copyright Act
(DMCA). In 2010, the U.S. Library of Congress granted an exemption to jailbreaking from the DMCA. In 2012, the exemption was renewed. During the hearings and public comments
surrounding the 2012 exemption, the Joint Creators, composed of app developers such as the Association of American Publishers, opposed the renewal of the exemption based on the
ground that it may facilitate app piracy.
What drives users to jailbreak their smartphones? How does a change in copyright policy
on jailbreaking affect the smartphone market? Would the effects differ between Apple and Android smartphones? We address these problems by constructing a random-coefficient
discrete-choice demand model of smartphones and apps. Within the model, consumers choose whether to jailbreak the smartphones of their choice. Jailbreaking a smartphone
within our model enables users to download, install and use paid apps for free and unof-ficial apps not endorsed by either Apple or Google. We estimate the model using a unique
dataset collected from more than 500 college students in Hong Kong and Shanghai through conjoint surveys, and find several interesting results.
First, paid apps contribute significantly to the market shares of smartphones. While vary-ing their prices is inconsequential, the availability of paid apps matters significantly to the
smartphones’ market shares. Second, because paid apps are important to smartphone users, using paid apps for free is a main reason for jailbreaking, a reason more decisive among
Android users than Apple iPhone users. Third, the monetary cost of jailbreaking a smart-phone plays a much smaller role than the moral cost in explaining its prevalence. Fourth,
strictly prohibiting jailbreaking would bring down the aggregate market share of smart-phones. More people would switch back to using traditional cell smart-phones. However, Apple’s
1“Jailbreaking” is a term applied to Apple’s iOS devices such as the iPhone. A similar term for Android
sales of iPhones would surprisingly strengthen at the expense of Android smartphones, and Apple would make even more profit. This suggests that Apple should have tried its best to
fight the exemption and make it costly to jailbreak not only iPhones but also Android smart-phones. This result is at odds with Apple’s lack of effort in objecting against the 2012 renewal
of the DMCA exemption.
A caveat of our study should be stated up-front. While we acknowledge that the
smart-phone industry is two-sided (strictly speaking, it is richer than that), we do not study the changes in app supply across different copyright regimes for two reasons. First, we do
not have data that would allow us to account for the app developers’ responses to differ-ent hypothetical copyright regimes. In particular, app developers’ responses are inherdiffer-ently
dynamic. Changes in the copyright regimes, smartphone demand, app demand and jail-breaking propensity are all factors that enter into the calculation of app developers when
they decide whether to develop apps. Not only would the data be hard to come by, but these dynamic responses would be extremely difficult to model. Second, we find it is important to
single out the responses of consumers and how phone producers respond to them. Without addressing app developers’ responses, we would not be able to estimate the overall profit of
phone producers, as the important component of app income would be missing.
Our paper relates to studies on the effect of counterfeits and digital goods piracy on
legiti-mate markets. Grossman and Shapiro (1988a) and Grossman and Shapiro (1988b) are the first to analyze this issue. There have also been numerous studies on the effect of music piracy on
album sales. Most have found that music piracy has a significantly negative effect on album sales, with the exception of Oberholzer-Gee and Strumpf (2007).2 However, with the
excep-tion of Leung (2013a), which quantifies the effect of music piracy on iPod sales, none of these studies has examined the effect of piracy in a two-sided market framework.
Some papers have examined counterfeit and piracy in China. For instance, Qian (2008) shows that in the Chinese shoe industry, firms with less government protection
differen-tiate their products through innovation, self-enforcement and subtle high-price signals to decrease counterfeit sales. Bai and Waldfogel (2012) conduct surveys in China and find that
2See Blackburn (2004), Hui and Png (2003), Leung (2013a), Liebowitz (2006), Peitz and Waelbroeck (2004),
unpaid movie consumption comprises about 75% of Chinese respondents’ movie consump-tion (compared with approximately 5% reported in the U.S. sample). Further, they find that
sales displacement is far smaller for the Chinese sample than U.S. sample.
Our study also contributes to the growing literature on the complementarity between
apps and smartphones. Waterson and Doyle (2012) look into eBay auctions on iPhone 4 in the U.K. and show that transaction prices are higher when the phone is unlocked and can be
sold overseas. Sun (2012) estimates a consumer demand for the smartphone and app supply and shows that apps contribute to the growing value of smartphones. Kim (2012) estimates
consumer demands for both smartphones and apps and shows that Apple provides more app benefits to its users and that Android’s stronger sales come entirely from advantages in
the price-adjusted quality of its hardware. Our study differs by looking into the effects of jailbreaking on the joint demand of smartphones and apps.
In the next section, we describe the background of the DMCA exemption and the smart-phone industry and explain the concept of jailbreaking in more detail. Section 3 describes the
data. Section 4 details the model and explains that the conjoint survey provides it with iden-tification by exogenously varying the different prices and attributes of smartphones. Section
5 discusses the results. Section 6 discusses counterfactuals that correspond to different prices, availability of paid apps and that correspond to different copyright regimes.
2
Jailbreaking Smartphones under the Digital Millennium
Copyright Act
Introducing apps, a move Apple first made in the summer of 2008, is key to the iPhone’s
success. The average quarterly worldwide sales of iPhones before apps were born were ap-proximately $1.2 million. On July 10, 2008, Apple launched the App Store, which sells
pre-approved apps. In the following year, the average quarterly sales surged to over $5 million. Apps are also key to the skyrocket sales of Android smartphones.
The idea implies that a car owner has the right to choose where to change tires and parts, or that an apartment owner has the right to decide to whom the apartment is leased or sold.
Restricting users to obtaining apps from the App Store is analogous to restricting car owners to purchasing tires from designated stores only. Thus, the concept of jailbreaking emerges.
Jailbreaking is a process that unlocks the restrictions on a smartphone imposed by either the manufacturer or carrier. The restrictions are software codes hidden somewhere in the
operating system. For example, the non-jailbroken iPhones can only download pre-approved apps from Apple’s App Store. Their users cannot tweak their iPhones to alter the speed of
the GPU or the strength of the Wifi antenna. They may be stuck at one carrier. If they switch to another carrier or move to another country, they must obtain another phone.3 However,
jailbreaking is not costless. There are certain risks involved. One may “brick” her phone, meaning a “total loss” of the phone. An Apple fan may also feel as if she is betraying Steve
Jobs, in which case she suffers morally. One may also have to take certain steps that many may find incomprehensible, tedious and time consuming. If someone else does it for her, she
must pay a certain amount in service fees.
Jailbreaking imposes serious legal implications that the DMCA, which was signed by
President Bill Clinton in 1998, was not originally intended to deal with. The DMCA imple-ments certain provisions of the World Intellectual Property Organization (WIPO) Copyright
Treaty and WIPO Performances and Phonograms Treaty. It amends Title 17 of the United States Code, in which Chapter 12 (section 1201) prohibits “the circumvention of certain
tech-nological measures employed by or on behalf of copyright owners to protect their works.” Section 1201(a)(1) of the DMCA requires the Library of Congress to grant exemption from
the prohibition when the access-control technology has a substantial adverse effect on peo-ple’s ability to make non-infringing uses of copyrighted works. Between 2000 and 2012, the
Copyright Office approved 23 exemptions (two in 2000; four in 2003; six in 2006; six in 2010 and five in 2012). In each case, the public submitted an exemption proposal to the Registrar
3The technical terminology can be even more confusing than economics jargon. First, the term
of Copyrights that initiated a process of hearings and public comments. The Registrar then made a recommendation and the Librarian issued the final rule.
While Apple has never liked the idea of jailbreaking, some groups, most notably the Elec-tronic Frontier Foundation (EFF), have actively sought for the legal right of users in the U.S.
to jailbreak their iPhones. The EFF argues that the intended use of jailbreaking, i.e. “to ren-der certain lawfully acquired applications interoperable with the handset’s software,” is fair
and that the access controls imposed by smartphone developers adversely affects that use. Because jailbreaking enables users to “circumvent a technological measure that effectively
controls access to a work protected” by the Copyright Act, according to Section 1201(a)(1)(A), it requires an exemption or could be deemed a violation of the DMCA. The fight ended when
an explicit exemption of the DMCA was granted by the U.S. Copyright Office in 2010.4 The
exemption officially says that jailbreaking one’s iPhone is not an imprisonable offense in the
U.S.
As the exemption of jailbreaking expired in 2012, the EEF along with New America
Foun-dation, Open Technology Initiative, New Media Rights, Mozilla Corporation, the Free Soft-ware Foundation, and several hundred individual supporters requested its continuation.
Their argument was the same as that put forward by the EEF in 2009: “jailbreaking a smart-phone to lawfully acquire apps inter-operable with the smartsmart-phone was fair use.”
Apple did not file an objection this time. Instead, trade groups representing app de-velopers such as the Association of American Publishers, the American Society of Media
Photographers, the Business Software Alliance, the Entertainment Software Association, the Motion Picture Association of American, the Picture Archive Council of America and the
Recording Industry Association of America challenged the EEF’s proposal. They argued that jailbreaking “increases piracy of applications and is detrimental to the secure and
trustwor-thy innovation platforms that mainstream consumers demand.”
While app piracy is widespread, the Copyright Office wrote in the Final Report that
re-newed the exemption in 2012 that the trade groups “did not demonstrate any significant relationship between jailbreaking and piracy.” Indeed, they pointed out one major difficulty
4Apple opposed the proposal at the time. Their main argument against the granting of the exemption was
that we fully acknowledge but do not intend to tackle in our paper: even the trade groups representing the app developers themselves cannot come up with evidence showing exactly
how jailbreaking would injure their businesses, let alone prove that app piracy activities have increased (for app developers not represented by those trade groups) because of jailbreaking.
3
The Data
Jailbreaking an iPhone enables the user to install unapproved (and possibly illegal) apps. The resulting less-restrictive set of property rights associated with buying an iPhone would
in principle make it more appealing to smartphone users. Because the exemption makes it legal to jailbreak, all else being equal, the demand for iPhones should increase.
Of course, all else is never equal. The whole analysis becomes complicated when Apple does not monopolize the market. In fact, the exemption also means that Android users can
legally jailbreak (root) their Android smartphones. It makes it difficult to predict whether iPhone sales and profits would truly increase because of the exemption.
To address these issues, we designed a conjoint survey to collect a unique dataset on the consumption of different smartphones. We collected our survey data from Hong Kong and
Shanghai. There are several reasons for using Chinese data. First, the smartphone market in China is huge. According to UMeng, a Chinese marketing analysis firm specializing in
smartphones and the apps market, the number of smartphone users has grown exponentially in recent years, reaching 200 million in October 2012. Second, app piracy is rampant in China.
MadFinger Games, a small Czech Republic-based company, said that its Shadowgun had a 39% piracy rate on the iOS platform and a nearly 100% piracy rate on the Android platform
in China. It is thus interesting to compare the jailbreaking behavior between Hong Kong, in which intellectual property rights are better enforced, and Shanghai, in which the piracy
problem is more serious.
The survey data comprise responses from 328 college students in Hong Kong and 242
students in Shanghai. Students answered two types of questions. First, they provided infor-mation on their demographics, the brands of cellphones they used, and whether they had
hy-pothetical tasks. In each of the 16 tasks, factors including smartphone prices, the prices of paid apps, and costs of jailbreaking of different smartphones were exogenously randomized
within a pre-specified range.
This exogenous randomization provides identification for our random-coefficient
discrete-choice demand model. We follow Rossi, Allenby, and McCulloch (2005) to set up a hierarchi-cal Bayesian discrete demand model for smartphones, with a mixture of normal priors. The
implementation of the posterior inference takes the form of a hybrid of Gibbs sampling and the Metropolis-Hasting algorithm. We then use the estimates to conduct counterfactuals to
evaluate the effectiveness of various copyright regimes.
The lack of real market data on jailbreaking led to the conjoint analysis approach adopted
in this paper. There are several advantages to using conjoint survey data instead of real market data in this research. First, real market data on the consumption of smartphones and
jailbreaking are difficult to come by, and conjoint surveys are possibly the only way to create a panel dataset. To the best of our knowledge, no study has constructed such a panel dataset.
Second, a conjoint survey analysis provides good instruments. There are two potential problems inherent in using real market price data. First, prices are endogenous. As Berry,
Levinsohn, and Pakes (1995) and Nevo (2000) illustrate, prices can be a function of unob-served product characteristics and can be correlated with unobunob-served product heterogeneity.
This leads to biased estimation. Second, the actual price variation is small for jailbreaking and apps. A conjoint survey analysis can circumvent these problems because it draws prices
as a product attribute exogenously and independently (using the orthogonality principle de-scribed in the next subsection). Moreover, as the designers of the survey, we could vary the
prices within a pre-specified range to ensure sufficient variations.
However, a conjoint survey has limitations. For instance, a conjoint analysis requires
quantifiable attributes. Some attributes such as the availability of free apps are difficult to quantify. These attributes are absorbed in the brand fixed effect in our estimation.
Moreover, one may prefer real market data over conjoint survey data. After all, a revealed preference sounds more reliable. However, various studies in marketing and economics have
there is compelling evidence showing that conjoint survey data can generate reliable demand estimates. Carlsson and Martinsson (2001) collect both real market data and conjoint survey
data on donation choice. Their estimates are statistically the same across the two data sources. Hensher, Louviere, and Swait (1999) arrive at the same conclusion in a freight shipper choice
problem. Finally, Leung (2013a) and Leung (2013b) extend the application of the conjoint analysis to the study of piracy.
3.1
Details of the Conjoint Survey
We follow Louviere and Woodworth (1983) by using an choice-based conjoint analysis to
collect our data. We conducted the survey in Fall 2012 at the Chinese University of Hong Kong and Shanghai Jiao Tong University. The survey was administered during the last 15
minutes of classes. In total, 570 students returned their completed surveys (328 from Hong Kong and 242 from Shanghai).
Before the survey, we conducted a pilot study using a sample of 20 undergraduate stu-dents. We included their three most popular cell phones in the survey (Google Galaxy Nexus,
Samsung Galaxy S3, and iPhone 5). To determine a viable range of cell phone and app prices, we asked students to state the maximum price they would be willing to pay for a 4G cell
phone, a 2G cell phone and an app. From the results, we identified HK$1,500 to HK$7,500 as a feasible range for a 4G cell phone, HK$100 to HK$2,000 as a feasible range for a 2G cell
phone, and HK$0 to HK$30 as a feasible range for each app.
We also asked students to indicate the two most important attributes when choosing a
cell phone. Based on their answers, we selected five attributes to construct the conjoint pro-files: (1) the price of the cell phone; (2) the price per paid app; (3) the price of jailbreaking;
(4) the display resolution (pixel per inch (PPI)); and (5) the camera configuration (megapix-els). At the beginning of the study, participants were given the survey containing a sequence
of 16 individualized choice sets and definitions of the five attributes. Each choice set had four cell phones, described using the five attributes.5 A participant has to choose one option
from each choice set (none is permitted) and indicates whether he would jailbreak his
cho-5For other cell phone features the participants may have considered, they were told to assume that those
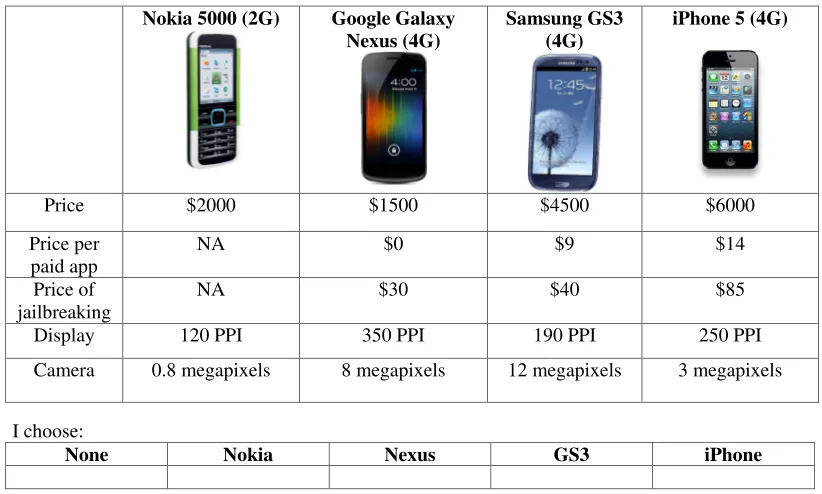
sen smartphone. Note that the students were told to interpret jailbreaking as a process that enabled them to download paid apps for free. Figure 1 presents a sample of a conjoint task
[image:11.612.92.503.220.467.2]in our survey.6
Figure 1: A Sample Conjoint Task
Nokia 5000 (2G) Google Galaxy Nexus (4G)
Samsung GS3 (4G)
iPhone 5 (4G)
Price $2000 $1500 $4500 $6000
Price per paid app
NA $0 $9 $14
Price of jailbreaking
NA $30 $40 $85
Display 120 PPI 350 PPI 190 PPI 250 PPI
Camera 0.8 megapixels 8 megapixels 12 megapixels 3 megapixels
I choose:
None Nokia Nexus GS3 iPhone
Jailbreak your cell phone? Yes/ No (You don’t need to answer if you choose None or Nokia)
We constructed four versions of the survey for our study. In each version, the order of the alternatives in each choice set were different. The first alternatives within each choice
set represented a 16-profile, orthogonal array with five alternatives and four attribute levels (see Addelman (1962)). We then followed Bunch, Louviere, and Anderson (1994)’s approach
to use cyclic designs to generate the other alternatives in each choice set. In particular, we
6When we conducted the survey in Shanghai, we converted the nominal value by using the exchange rate
constructed subsequent alternatives by adding cyclically generated alternatives to each set. The attribute level of a new alternative added one to the level of the previous alternative.
If the previous alternative was at the highest level, the assignment re-cycled to the lowest level. This construction method satisfied the three properties of efficient choice design (see
Sawtooth Software (2008)): (i) minimal overlap; (ii) orthogonality; and (iii) level balance.
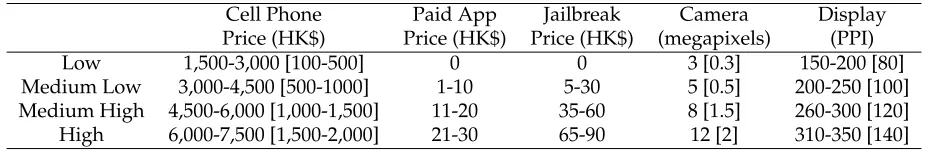
In specifying the attribute levels, we divided the range of each attribute into “low,” “medium
low,” “medium high,” and “high” categories. Table 1 presents the ranges of all of the at-tributes. We randomly selected a value from the corresponding range for each attribute level
[image:12.612.65.531.298.374.2]appearing in each cell phone option.
Table 1: Specification of Attribute Levels
Cell Phone Paid App Jailbreak Camera Display Price (HK$) Price (HK$) Price (HK$) (megapixels) (PPI) Low 1,500-3,000 [100-500] 0 0 3 [0.3] 150-200 [80] Medium Low 3,000-4,500 [500-1000] 1-10 5-30 5 [0.5] 200-250 [100] Medium High 4,500-6,000 [1,000-1,500] 11-20 35-60 8 [1.5] 260-300 [120] High 6,000-7,500 [1,500-2,000] 21-30 65-90 12 [2] 310-350 [140] The ranges in brackets are for 2G cell phones.
3.2
Summary Statistics
Table 2 describes the demographics and some of the behavior of the students in the sample. The Hong Kong students’ demographics are similar to those from Shanghai. They share
[image:12.612.104.492.574.666.2]similar ages (averaging 20.57 and 23.08 in Hong Kong and Shanghai, respectively). Males compose a slight majority of the sample (59% in Hong Kong and 54% in Shanghai).
Table 2: Summary Statistics
Hong Kong Shanghai
Mean (s.d.) Min Max Mean (s.d.) Min Max Age 20.57 (1.59) 17 27 23.08 (2.48) 18 38 Male 0.59 (0.49) 0 1 0.54 (0.50) 0 1 Have Used BT Recently 0.61 (0.49) 0 1 0.71 (0.46) 0 1 Hours Spent on Internet/Day 4.80 (3.62) 1 24 5.18 (2.91) 0.3 20
Jailbreak 0.13 (0.34) 0 1 0.29 (0.45) 0 1
Almost all of the students had access to the Internet, and spent approximately 5 hours
students had recently used BitTorrent (BT), an application used to share (mostly illegal) files on the Internet. BT was more prevalent among the Shanghai students, more than 71% of
whom had experience with BT. Consistently, Shanghai students were more likely to jailbreak their smartphones (29% did so) compared with Hong Kong students (13%).
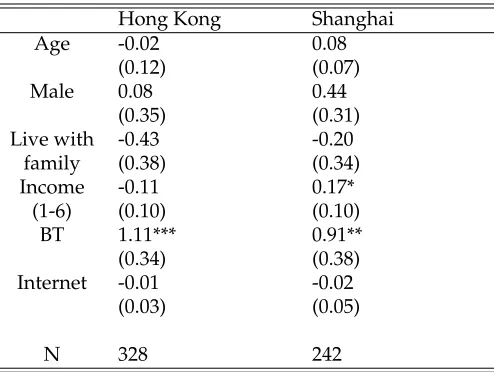
To understand the underlying demographics of jailbreakers, we run separate logit regres-sions for the Hong Kong and Shanghai students. As Table 3 shows, students who have recent
BT experience are more likely to jailbreak their smartphones. While students with higher family incomes are also more likely to engage in jailbreaking, income does not correlate with
jailbreaking behavior in Hong Kong. Further, although it is marginally insignificant, male Shanghai students tend to be more likely to jailbreak their smartphones, there is no
[image:13.612.174.421.334.520.2]signifi-cant difference in jailbreaking behavior across genders in Hong Kong.
Table 3: Logit Regression of Jailbreakinga
Hong Kong Shanghai
Age -0.02 0.08
(0.12) (0.07)
Male 0.08 0.44
(0.35) (0.31) Live with -0.43 -0.20
family (0.38) (0.34) Income -0.11 0.17*
(1-6) (0.10) (0.10) BT 1.11*** 0.91** (0.34) (0.38) Internet -0.01 -0.02
(0.03) (0.05)
N 328 242
aStandard errors are reported in brackets. ***, **, and
* indicate significance at the 1%, 5% and 10% levels.
4
The Demand Model and Estimation
We build a demand model for cell phones following Iyengar, Jedidi, and Kohli (2008).
First, letxj be a vector of non-price attributes associated with cell phonejwhere the first
does not depend on price, for consumeri, where
ˆ
uij =αixj. (1)
We assume that consumer i can at most choose one cell phone. She has a budget wi
that she can spend on cell phones, apps (which we denote asnij), and an individual-specific
composite (outside) good (which we denote aszij).
There are two prices for cell phonej depending on whether consumerijailbreaks the cell
phone. If she does not jailbreak the cell phone, she pays fa
j for the cell phone itself. If she
jailbreaks the cell phone, she pays fja+fjb, where fjb is the monetary price for jailbreaking.
There is also a (fixed) utility cost,ρij, of jailbreaking. Whereas the price for each legal app in
cell phonej is paj, the price for each app after jailbreak ispbj (which we assume to be zero).
The price of the individual-specific composite good iswi, which is normalized at one.
The budget constraint for consumerichoosing cell phonej is
pwi zij +1{jailbreak= 0}(fja+p a jn
a
ij) +1{jailbreak= 1}(f a j +f
b j +p
b jn
b
ij) = wi. (2)
We model the individual utility using the nested logit framework by nesting both the “no jailbreak” and “jailbreak” options of each cell phone j. In particular, we assume that the
utility shock forichoosing cell phonejwith jailbreak optionkisζij+ (1−σi)ǫijk. We assume
ǫijk to be distributed i.i.d. extreme value and thatζij has a distribution that depends on σi
such thatσi ∈ [0,1]and assumeζij + (1−σi)ǫijk to be distributed extreme value. Thus, the
utility of consumerichoosing cell phonejwith jailbreak optionkis
ukij = ˆuij +βi1nijk +βi2(nkij)2+βi3zijk −1{k =b}ρij +ζij + (1−σi)ǫijk, (3)
where
zija = wi−fja−p a jn
a ij;
zijb = wi−fja−f b j −p
b jn
We can determine the number of apps that consumer i would download from the first order conditions with respect tonkij that maximize (3) subject to (2):
na∗
ij = max{
βi3paj −βi1 2βi2
,0}, (4)
nb∗
ij = max{
βi3pbj −βi1 2βi2
,0}. (5)
We can express the utility for consumerichoosing cell phonej with jailbreak choicekas
ukij = ˆuij +βi1nijk∗ +βi2(nkij∗)2+βi3zijk∗−1{k=b}ρij+ζij + (1−σi)ǫijk
≡ u¯kij +ζij + (1−σi)ǫijk (6)
LetP= [pa
1;. . .;paJ;pb1;. . .;pbJ;f1a;. . .;fJa;f1b;. . .;fJb]be a vector of prices andΘ = [αi;βi1;βi2;βi3;ρi;θi;σi]
be a vector of parameters. Integrating out the individual taste shock, we can derive the fol-lowing expression for consumeri’s demand for cell phonejwith jailbreak choicek:
Dijk(P|Θ) =
exp u¯kij
1−σi
Gσi
j
h P
jG
(1−σi)
j
i, (7)
whereGj =P
k=a,bexp
u¯k ij
1−σi
.
4.1
Estimation
To exploit the panel structure of our data, we follow Rossi, Allenby, and McCulloch (2005)
and use a hierarchical Bayesian model with a mixture of K components of normal priors to flexibly estimate the random coefficients. In addition to thehyperparametersthat describe
the distribution of the heterogeneity, the hierarchical Bayesian approach can also make an inference on theindividual-levelparameters as follows.
In the survey, we asked students to provide demographic information. Therefore, we include aspects of that information to control for observed heterogeneity across students. We
define Zi as a1×nz vector of observable characteristics of i, which hasnz elements, and Z
unobserved heterogeneity is distributed as aK mixture of normal. The demand model can therefore be expressed as follows:
Dij(P|Θ) =
Y
t
Dijt(Pt|Θ),
Θi = Zi△+ui,
ui ∼ N(µindi,Σindi),
indi ∼ MultinomialK(γ),
whereγis a vector giving the mixture probabilities for each of the K components.△is annz×
6matrix of parameters that determines the effects of demographics on each utility coefficient.
We defineδ = vec(△)for ease of illustration. The individual-level demand parameters for studenti,Θi, is therefore a function of her demographics (including family income, recent BT
experience and age) and an unobserved factor,ui. The unobserved factor,ui, is drawn from a
K-component mixture of normal distributions. The set of hyperparameters that describes the
distribution of the heterogeneity includes δ (the demographics parameters), γ (the mixture probabilities for each of theKcomponents) andµkandΣk(the mean and variance-covariance
matrix of thekth-component of the distribution of the unobserved heterogeneity,ui).
The complete specification with priors over the hyperparameters, including the mixture
probabilities (τ), the demographic coefficients (δ¯anda−1
δ ), the means of the unobserved
het-erogeneity (µ¯anda−1
µ ) and the covariance matrices for the unobserved heterogeneity (v and
V), can be taken in convenient conditionally conjugate forms:
δ ∼ N(¯δ, a−1
δ ),
γ ∼ Dirichlet(τ),
µk|Σk ∼ N(¯µ,Σk×a−µ1),
Σk ∼ IW(v, V),
{µk,Σk} independent,
We follow the standard Bayesian estimation of the multinomial logit model as in Rossi, Allenby, and McCulloch (2005) except for several differences. First, we do not observe nk
and thus need to calculate its value using the draws ofβi1, βi2, βi3, θi from each MCMC draw.
Second, to ensure the quasi-concavity of the utility function, we put the following restrictions
on the parameters:σi <1,βi2 <0, andβi3 >0. We enforce the restrictions by reparametrizing
σi = 1−exp(si), βi2 = −exp(bi2), andβi3 = exp(bi3), wheresi, bi2, andbi3 are unconstrained
individual-level parameters.
5
Estimation Results
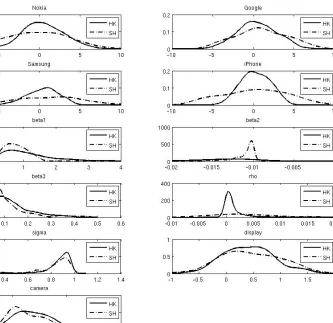
Figure 2 displays the kernel density of the individual-level coefficients from the two-component
model. There are several things to note. First, in both cities, the distributions of the dummy coefficients for Nokia are not very different from those of other smartphones. This indicates
that the availability of apps contributes significantly to the higher market shares of smart-phones.
Second, σ is smaller and more spread out in the Shanghai sample, which indicates that
ζij is a stronger driving force for smartphone choices in Hong Kong than in Shanghai. In
other words, Hong Kong students have a stronger brand preference than Shanghai students. Copyright policies on jailbreaking, therefore, may have a bigger effect in Shanghai than in
Hong Kong. We test this in Section 6.
Third, the price coefficients are smaller in Shanghai. The parameterβ3for Hong Kong
stu-dents is higher than for Shanghai stustu-dents, perhaps because most college stustu-dents in Shang-hai do not earn a living working part-time jobs. This indicates that ShangShang-hai students may
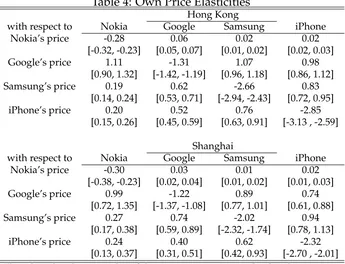
be less sensitive to price changes in phones. To test this observation, we compute the price elasticities of the various cell phones.
Table 4 reports the estimates of the price elasticities. The elasticity estimates are at brand level, i.e., the percentage change in the demand for the brand (jailbroken and non-jailbroken)
in terms of a 1% increase in the prices of various brands. The upper (lower) panel displays the demand elasticities from the Hong Kong (Shanghai) sample. In both samples, the own
Figure 2: Kernel Density of Coefficients Estimates
They are all above one, indicating a positive marginal cost according to the inverse elasticity rule. The demand for Nokia is inelastic, with elasticities of -0.28 and -0.3 in Hong Kong and
Shanghai, respectively.
Hong Kong students are more price sensitive. When the price of Samsung goes up by
1%, Hong Kong students’ demand for Samsung drops by 2.66%, and Shanghai students’ demand drops by only 2.02%. When the price of the iPhone goes up by 1%, Hong Kong
students’ demand for the iPhone drops by 2.85%, and Shanghai students’ demand drops by only 2.32%.
Table 4: Own Price Elasticities
Hong Kong
with respect to Nokia Google Samsung iPhone Nokia’s price -0.28 0.06 0.02 0.02
[-0.32, -0.23] [0.05, 0.07] [0.01, 0.02] [0.02, 0.03] Google’s price 1.11 -1.31 1.07 0.98
[0.90, 1.32] [-1.42, -1.19] [0.96, 1.18] [0.86, 1.12] Samsung’s price 0.19 0.62 -2.66 0.83
[0.14, 0.24] [0.53, 0.71] [-2.94, -2.43] [0.72, 0.95] iPhone’s price 0.20 0.52 0.76 -2.85
[0.15, 0.26] [0.45, 0.59] [0.63, 0.91] [-3.13 , -2.59]
Shanghai
with respect to Nokia Google Samsung iPhone Nokia’s price -0.30 0.03 0.01 0.02
[-0.38, -0.23] [0.02, 0.04] [0.01, 0.02] [0.01, 0.03] Google’s price 0.99 -1.22 0.89 0.74
[0.72, 1.35] [-1.37, -1.08] [0.77, 1.01] [0.61, 0.88] Samsung’s price 0.27 0.74 -2.02 0.94
[0.17, 0.38] [0.59, 0.89] [-2.32, -1.74] [0.78, 1.13] iPhone’s price 0.24 0.40 0.62 -2.32
[0.13, 0.37] [0.31, 0.51] [0.42, 0.93] [-2.70 , -2.01] The 5th and 95th percentiles of the estimates are reported in brackets.
the only 2G cell phone in the study. Judging from the cross-price elasticities, students are
more likely to substitute an iPhone for another smartphone like a Google phone, rather than a Nokia. For instance, a 1% increase in the iPhone’s price in Hong Kong (Shanghai) would
lead to an approximate 0.5%-0.7% increase in demand for the Google phone and Samsung, but only an approximate 0.2% increase in demand for the Nokia.
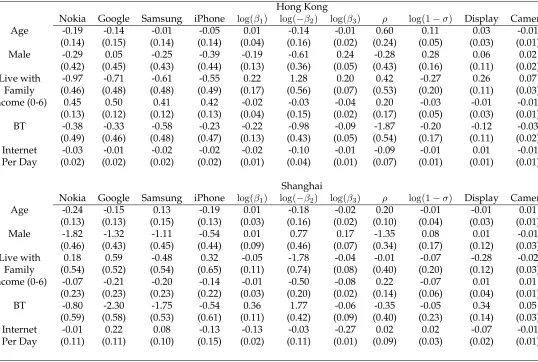
Table 5 reports the variations of the coefficient estimates that are explained by the demo-graphics. Several things are noteworthy. First, age does not explain much of the coefficient
variation, probably because it does not vary much among the college students.
Second, the price coefficient (β3) is correlated with some of the demographics. For
in-stance, the male students in both cities are (statistically) more price sensitive with a higher price coefficient (β3). Further, students with a higher family income tend to have a smaller
price coefficient (β3) and are therefore less price sensitive.
Third, the psychological cost of jailbreaking (ρ) is correlated with some of the
demograph-ics. Male students in both Hong Kong and Shangai have a lower utility cost of jailbreaking (ρ). Whereas Hong Kong male and female students do not differ significantly, Shanghai male
stu-Table 5: Coefficients Explained by Demographics
Hong Kong
Nokia Google Samsung iPhone log(β1) log(−β2) log(β3) ρ log(1−σ) Display Camera Age -0.19 -0.14 -0.01 -0.05 0.01 -0.14 -0.01 0.60 0.11 0.03 -0.01
(0.14) (0.15) (0.14) (0.14) (0.04) (0.16) (0.02) (0.24) (0.05) (0.03) (0.01) Male -0.29 0.05 -0.25 -0.39 -0.19 -0.61 0.24 -0.28 0.28 0.06 0.02
(0.42) (0.45) (0.43) (0.44) (0.13) (0.36) (0.05) (0.43) (0.16) (0.11) (0.02) Live with -0.97 -0.71 -0.61 -0.55 0.22 1.28 0.20 0.42 -0.27 0.26 0.07
Family (0.46) (0.48) (0.48) (0.49) (0.17) (0.56) (0.07) (0.53) (0.20) (0.11) (0.03) Income (0-6) 0.45 0.50 0.41 0.42 -0.02 -0.03 -0.04 0.20 -0.03 -0.01 -0.01
(0.13) (0.12) (0.12) (0.13) (0.04) (0.15) (0.02) (0.17) (0.05) (0.03) (0.01) BT -0.38 -0.33 -0.58 -0.23 -0.22 -0.98 -0.09 -1.87 -0.20 -0.12 -0.03
(0.49) (0.46) (0.48) (0.47) (0.13) (0.43) (0.05) (0.54) (0.17) (0.11) (0.02) Internet -0.03 -0.01 -0.02 -0.02 -0.02 -0.10 -0.01 -0.09 -0.01 0.01 -0.01 Per Day (0.02) (0.02) (0.02) (0.02) (0.01) (0.04) (0.01) (0.07) (0.01) (0.01) (0.01)
Shanghai
Nokia Google Samsung iPhone log(β1) log(−β2) log(β3) ρ log(1−σ) Display Camera Age -0.24 -0.15 0.13 -0.19 0.01 -0.18 -0.02 0.20 -0.01 -0.01 0.01
(0.13) (0.13) (0.15) (0.13) (0.03) (0.16) (0.02) (0.10) (0.04) (0.03) (0.01) Male -1.82 -1.32 -1.11 -0.54 0.01 0.77 0.17 -1.35 0.08 0.01 -0.01
(0.46) (0.43) (0.45) (0.44) (0.09) (0.46) (0.07) (0.34) (0.17) (0.12) (0.03) Live with 0.18 0.59 -0.48 0.32 -0.05 -1.78 -0.04 -0.01 -0.07 -0.28 -0.02
Family (0.54) (0.52) (0.54) (0.65) (0.11) (0.74) (0.08) (0.40) (0.20) (0.12) (0.03) Income (0-6) -0.07 -0.21 -0.20 -0.14 -0.01 -0.50 -0.08 0.22 -0.07 0.01 0.01
(0.23) (0.23) (0.23) (0.22) (0.03) (0.20) (0.02) (0.14) (0.06) (0.04) (0.01) BT -0.80 -2.30 -1.75 -0.54 0.36 1.77 -0.06 -0.35 -0.05 0.34 0.05
(0.59) (0.58) (0.53) (0.61) (0.11) (0.42) (0.09) (0.40) (0.23) (0.14) (0.03) Internet -0.01 0.22 0.08 -0.13 -0.13 -0.03 -0.27 0.02 0.02 -0.07 -0.01 Per Day (0.11) (0.11) (0.10) (0.15) (0.02) (0.11) (0.01) (0.09) (0.03) (0.02) (0.01)
The standard deviations of the estimates are reported in brackets.
dents with recent experience using BitTorrent (BT) have a lower utility cost of jailbreaking.
This relationship is more significant in Hong Kong.
6
Counterfactuals
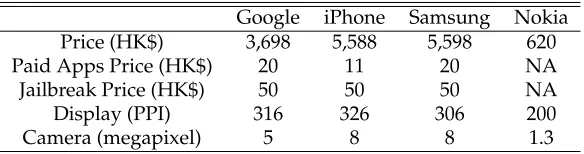
We conduct several counterfactuals to examine the importance of paid apps and the effects
of different copyright regimes. Table 6 describes the current regime in both Hong Kong and Shanghai.
We calculate the predicted market shares and profits of the different smartphones and the predicted prevalence of jailbreaking in seven regimes. Among each of these, the users’
[image:20.612.68.606.96.458.2]Table 6: Current Cellphone Market
Google iPhone Samsung Nokia Price (HK$) 3,698 5,588 5,598 620 Paid Apps Price (HK$) 20 11 20 NA Jailbreak Price (HK$) 50 50 50 NA Display (PPI) 316 326 306 200 Camera (megapixel) 5 8 8 1.3
corresponding profit-maximizing prices of the phone manufacturers are all endogenously determined.
6.1
Do Paid Apps Determine Jailbreaking?
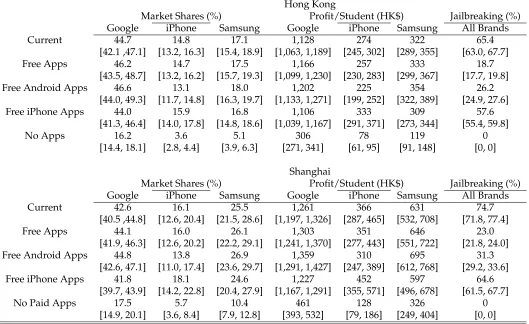
Apps are key to smartphones. Table 7 reports the estimated market shares of various smart-phones in four different regimes. These regimes differ in the price of paid apps and their
availability across the different platforms. The first three columns show the market shares of the three smartphones (Google, iPhone, and Samsung) in different regimes. Columns 4-6
show the expected profits per student for the three smartphones. Column 7 computes the corresponding prevalence of jailbreaking among smartphone users. Row 1 shows those of
the current regime for ease of comparison.
Free Apps Regime. Under this regime, we set the price of all of the paid apps (for both Android and Apple) to zero. A few results emerge; we stress two that at first glance may appear to contradict to each other. First, the priceof paid apps is not a crucial determinant
of the market shares (and therefore the profits) of different smartphones. This suggests that some other factors are more important in determining users’ demand for smartphones, such
as, free apps, the design, the brand, etc.7 Does that mean that paid apps are therefore not
important? The second result suggests otherwise. Column 7 shows that the prevalance of
jailbreaking falls significantly (from 65.4% to 18.7% in Hong Kong and from 74.7% to 23% in Shanghai). This suggests thatconsumingpaid apps must be an important factor in
deter-mining smartphone demand. When prices rise, more people choose to jailbreak their
smart-7However, there are only slight changes in the market shares and profits of smartphones. This is likely
Table 7: Market Shares, Profits, and Overall Jailbreaking Percentage under the Different Regimes
Hong Kong
Market Shares (%) Profit/Student (HK$) Jailbreaking (%) Google iPhone Samsung Google iPhone Samsung All Brands
Current 44.7 14.8 17.1 1,128 274 322 65.4
[42.1 ,47.1] [13.2, 16.3] [15.4, 18.9] [1,063, 1,189] [245, 302] [289, 355] [63.0, 67.7]
Free Apps 46.2 14.7 17.5 1,166 257 333 18.7
[43.5, 48.7] [13.2, 16.2] [15.7, 19.3] [1,099, 1,230] [230, 283] [299, 367] [17.7, 19.8] Free Android Apps 46.6 13.1 18.0 1,202 225 354 26.2
[44.0, 49.3] [11.7, 14.8] [16.3, 19.7] [1,133, 1,271] [199, 252] [322, 389] [24.9, 27.6] Free iPhone Apps 44.0 15.9 16.8 1,106 333 309 57.6
[41.3, 46.4] [14.0, 17.8] [14.8, 18.6] [1,039, 1,167] [291, 371] [273, 344] [55.4, 59.8]
No Apps 16.2 3.6 5.1 306 78 119 0
[14.4, 18.1] [2.8, 4.4] [3.9, 6.3] [271, 341] [61, 95] [91, 148] [0, 0]
Shanghai
Market Shares (%) Profit/Student (HK$) Jailbreaking (%) Google iPhone Samsung Google iPhone Samsung All Brands
Current 42.6 16.1 25.5 1,261 366 631 74.7
[40.5 ,44.8] [12.6, 20.4] [21.5, 28.6] [1,197, 1,326] [287, 465] [532, 708] [71.8, 77.4]
Free Apps 44.1 16.0 26.1 1,303 351 646 23.0
[41.9, 46.3] [12.6, 20.2] [22.2, 29.1] [1,241, 1,370] [277, 443] [551, 722] [21.8, 24.0] Free Android Apps 44.8 13.8 26.9 1,359 310 695 31.3
[42.6, 47.1] [11.0, 17.4] [23.6, 29.7] [1,291, 1,427] [247, 389] [612, 768] [29.2, 33.6] Free iPhone Apps 41.8 18.1 24.6 1,227 452 597 64.6
[39.7, 43.9] [14.2, 22.8] [20.4, 27.9] [1,167, 1,291] [355, 571] [496, 678] [61.5, 67.7]
No Paid Apps 17.5 5.7 10.4 461 128 326 0
[14.9, 20.1] [3.6, 8.4] [7.9, 12.8] [393, 532] [79, 186] [249, 404] [0, 0] The 5th and 95th percentiles of the estimates are reported in brackets.
phones. The estimate suggests that raising the prices of paid apps from $0 to the current
prices would lead to three times the amount of jailbreaking.
The total market shares of smartphones (the sum of the three smartphones examined in
this study) increase by only 1.8% and 2% in Hong Kong and Shanghai, respectively. This reflects the low substitutability between smartphones and Nokia, as shown in Table 4. The
small increases in the total market shares lead to small changes in the total profits of smart-phones. The total profits of all smartphones increase slightly in Hong Kong (HK$32 per
student) and in Shanghai (HK$42 per student). However, there are slight differences among Apple and Android phones. Whereas the market shares and profits of the Android phones
iPhone.8
Free Android/iPhone Apps Regime. In the case where either Android or Apple’s apps become free, the total market share and profits of smartphones would also increase, at the expense of the smartphones that still charge their apps at a positive price. However, they
would not change much.
The more important result, however, comes from comparing the figures in Column 7.
Setting HK$0 for Android paid apps alone would significantly lower the prevalence of jail-breaking compared with setting a HK$0 amount for iPhone paid apps. This suggests that
using Android paid apps for free would be a more important driver for jailbreaking than using iPhone paid apps for free. Another interpretation is that iPhone users are less likely to
jailbreak their phones because they have to pay for paid apps, which are cheaper in iPhones relative to Android phones.
No Paid Apps Regime. The availability of apps is key to the success of smartphones. We assess the importance of paid apps in the No Paid Apps Regime by setting the prices of
paid apps at a high level such that no one would purchase any app.9 The total market shares
of smartphones in the No Paid Apps Regime would decrease dramatically from 76.6% to
24.9% in Hong Kong, and from 84.2% to 33.6% in Shanghai. The total expected profits would also drop significantly (HK$1,221 per student in Hong Kong, and HK$1,343 per student in
Shanghai). Paid apps contribute a lion’s share of the smartphone profits (71% in Hong Kong and 59% in Shanghai). If there were no paid apps, the free apps would not be enough to make
smartphones sufficiently attractive. Our results reflect that the worldwide sales of iPhones have increased four times since the opening of the App Store in 2008.
6.2
Effects of Alternative Copyrights Policies
To assess the effects of different copyright policies, we evaluate the market shares of
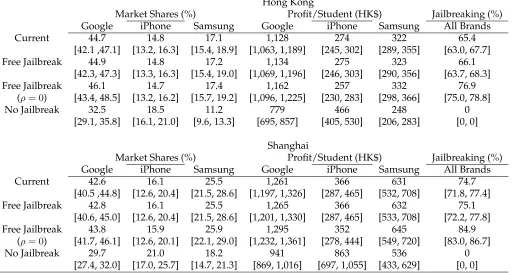
smart-phones in three different regimes. Table 8 reports the results.
Free Jailbreak. If the DMCA exemption were to draw the monetary cost of jailbreaking
8This may relate to the price decline in apps for Android phones being larger than that of the iPhone. 9To shut down the option of using paid apps, we must also shut down the option to jailbreak smartphones.
Table 8: Market Shares, Profits, and Overall Jailbreaking Percentage under Different Copy-right Regimes
Hong Kong
Market Shares (%) Profit/Student (HK$) Jailbreaking (%) Google iPhone Samsung Google iPhone Samsung All Brands
Current 44.7 14.8 17.1 1,128 274 322 65.4
[42.1 ,47.1] [13.2, 16.3] [15.4, 18.9] [1,063, 1,189] [245, 302] [289, 355] [63.0, 67.7] Free Jailbreak 44.9 14.8 17.2 1,134 275 323 66.1
[42.3, 47.3] [13.3, 16.3] [15.4, 19.0] [1,069, 1,196] [246, 303] [290, 356] [63.7, 68.3] Free Jailbreak 46.1 14.7 17.4 1,162 257 332 76.9
(ρ= 0) [43.4, 48.5] [13.2, 16.2] [15.7, 19.2] [1,096, 1,225] [230, 283] [298, 366] [75.0, 78.8]
No Jailbreak 32.5 18.5 11.2 779 466 248 0
[29.1, 35.8] [16.1, 21.0] [9.6, 13.3] [695, 857] [405, 530] [206, 283] [0, 0]
Shanghai
Market Shares (%) Profit/Student (HK$) Jailbreaking (%) Google iPhone Samsung Google iPhone Samsung All Brands
Current 42.6 16.1 25.5 1,261 366 631 74.7
[40.5 ,44.8] [12.6, 20.4] [21.5, 28.6] [1,197, 1,326] [287, 465] [532, 708] [71.8, 77.4] Free Jailbreak 42.8 16.1 25.5 1,265 366 632 75.1
[40.6, 45.0] [12.6, 20.4] [21.5, 28.6] [1,201, 1,330] [287, 465] [533, 708] [72.2, 77.8] Free Jailbreak 43.8 15.9 25.9 1,295 352 645 84.9
(ρ= 0) [41.7, 46.1] [12.6, 20.1] [22.1, 29.0] [1,232, 1,361] [278, 444] [549, 720] [83.0, 86.7]
No Jailbreak 29.7 21.0 18.2 941 863 536 0
[27.4, 32.0] [17.0, 25.7] [14.7, 21.3] [869, 1,016] [697, 1,055] [433, 629] [0, 0] The 5th and 95th percentiles of the estimates are reported in brackets.
down, we would expect the monetary cost to be very small.10 However, it is unclear whether
a lower monetary cost would be the only effect. It may also significantly lower users’
psy-chological cost of jailbreaking. Users may believe that if were not appropriate, the Library of Congress would not have given it the “go-ahead.”
In the first two regimes, therefore, we set the price of jailbreaking at zero. The first regime differs from the second in that in the second regime, both the monetary cost of jailbreaking
and the utility cost,ρ, are set at zero.
In both regimes, the prevalence of jailbreaking rises. The utility cost of jailbreaking,ρ, has
a much larger effect on users’ decisions to jailbreak. The percentage of jailbreaking increases more than 10% when both the monetary and utility costs of jailbreaking are set at zero.
How-ever, it increases by only less than 1% when only the monetary cost of jailbreaking is set at zero.
10This is perhaps because more technical experts are willing to engage their time in breaking the software code
Therefore, moral cost is a more important determinant of jailbreaking than monetary cost. This implies that smartphone manufacturers should combat the problem of jailbreaking by
raising the moral cost instead. The iPhone’s major sales strategy relies consistently on one single person: the legendary Steve Jobs, who introduced every iPhone that was on the market
when he was alive. Some Apple fans who fell for his charm perceive jailbreaking an iPhone as betraying their idol.
This also suggests that when the exemption of the DMCA was up for renewal in 2012, Apple should have fought hard on it instead of being silent. While Steve Jobs had already
passed away, Apple would have appealed to his fans, and protested against the exemption and tried hard to link jailbreaking emotionally to the betrayal of the deceased iconic figure.
Doing so would not have overturned the Library of Congress’s decision, but it would have made a difference to iPhone users.
No Jailbreak. What would happen if jailbreaking were prohibitively expensive? This case corresponds to a hypothetical situation in which the copyright policies strictly prohibit
jailbreaking and are perfectly enforced.
To address this question, in the preceding regime, we shut down the option by raising the
monetary cost of jailbreaking to a level such that no one would choose to jailbreak. The results are consistent with the prediction that depriving the right to choose which complementary
products (in our case, apps) to use is going to decrease the attractiveness of smartphones. The total market shares of smartphones would drop dramatically in both Hong Kong (to
only 14.4%) and in Shanghai (to only 15.3%).
It is also worth noting that iPhone’s market share would increase in both markets (from
14.8% to 18.5% in Hong Kong, and from 16.1% to 21.0% in Shanghai) even if iPhone users were prohibited from jailbreaking their smartphones. If jailbreaking were not an option for
Android users, some of those who still wanted to purchase a smartphone would switch to an iPhone, which offers cheaper paid apps. The iPhone’s profit would increase as a result (from
7
Conclusion
While jailbreaking can hurt revenue income from the apps market, it may enhance the value
of and demand for smartphones. In this paper, we attempt to quantify the gains for smart-phone sales in the presence of jailbreaking. We designed a conjoint survey to collect a unique
dataset on the consumption of different smartphones, and use it to set up and estimate a random-coeffcient discrete demand model for smartphones.
We obtain several results. First, applications and smartphones are close complements to each other. When paid apps are not available, the total market shares of smartphones drop
from 74.7% to 21.9% in Hong Kong and from 80% to 33.7% in Shanghai. The total profits of all of the smartphones also drop significantly in both samples (71% in Hong Kong and 53%
in Shanghai). Second, because paid apps are important to smartphone users, installing paid apps for free is an important reason for users to jailbreak. Third, while the monetary cost
of jailbreaking is a determinant, it is much less important than the psychological cost users perceive. Fourth, there are heterogeneous effects on smartphone suppliers when the
copy-right regime shuts down jailbreaking completely. While the total market shares and profits of smartphones would decrease if jailbreaking were not possible, Apple’s iPhone profits would
increase 36% in Hong Kong and 84% in Shanghai.
Our results provide policy and managerial implications. First, policymakers can not only
raise the monetary cost of jailbreaking (such as by penalty) as a deterrent, but also deter jailbreaking by raising its stigma through promoting copyright awareness. Second, the
im-portance of moral cost in jailbreaking suggests that Apple should liken jailbreaking to an emotional betrayal of Steve Jobs or the entire Apple creative team as a deterrent instead of
reiterating the pros and cons rationally. Finally, as consumers are less likely to jailbreak under a better enforced copyright regime, firms should focus on their price advantage in the apps
References
ADDELMAN, S. (1962): “Symmetrical and Asymmetrical Fractional Factorial Plans,”
Techno-metrics, 4(1), 47–58.
BAI, J., AND J. WALDFOGEL(2012): “Movie Piracy and Sales Displacement in Two Samples
of Chinese Consumers,”Information Economics and Policy, 24(3-4), 187–196.
BERRY, S., J. LEVINSOHN,ANDA. PAKES(1995): “Automobile Prices in Market Equilibrium,”
Econometrica, 63(4), 841–890.
BLACKBURN, D. (2004): “Does File Sharing Affect Record Sales?,” Ph.D. thesis, Harvard
University.
BUNCH, D. S., J. J. LOUVIERE, AND D. ANDERSON (1994): “A Comparison of Experimental
Design Strategies for Multinomial Logit Models: The Case of Generic Attributes,” working paper, Graduate School of Management, University of California at Davis.
CARLSSON, F.,ANDP. MARTINSSON(2001): “Do Hypothetical and Actual Marginal Willing-ness to Pay Differ in Choice Experiments?,” Journal of Environmental Economics and
Man-agement, 41(2), 179–192.
GREEN, P. E., AND V. R. RAO (1971): “Conjoint Measurement for Quantifying Judgment
Data,”Journal of Marketing Research, 8(3), 355–363.
GROSSMAN, G. M., AND C. SHAPIRO (1988a): “Counterfeit-Product Trade,” American
Eco-nomic Review, 78(1), 59–75.
(1988b): “Foreign Counterfeiting of Status Goods,”The Quaterly Journal of Economics, 103(1), 79–100.
HENSHER, D., J. LOUVIERE, ANDJ. SWAIT (1999): “Combining Sources of Preference Data,” Journal of Econometrics, 89(1-2), 197–221.
IYENGAR, R., K. JEDIDI,ANDR. KOHLI(2008): “A Conjoint Approach to Multi-Part Pricing,” Journal of Marketing Research, 45(2), 195–210.
KIM, M. J. (2012): “The Interdependence between Smartphones and Applications: The Role of Platforms,” working paper.
LEUNG, T. C. (2013a): “Music Piracy: Bad for Record Sales but Good for the iPod?,” Mimeo, Chinese University of Hong Kong.
(2013b): “What is the True Loss Due to Piracy? Evidence from Microsoft Office in
Hong Kong,”Review of Economics and Statistics, forthcoming.
LIEBOWITZ, S. J. (2006): “File Sharing: Creative Destruction or Just Plain Destruction?,”
Jour-nal of Law and Economics, 49(1), 1–28.
LOUVIERE, J., AND G. WOODWORTH (1983): “Design and Analysis of Simulated Consumer
Choice or Allocation Experiments: An Approach Based on Aggregate Data,” Journal of Marketing Research, 20(4), 350–367.
NEVO, A. (2000): “A Practitioner’s Guide to Estimation of Random Coefficients Logit Models of Demand,”Journal of Economics and Management Strategy, 9(4), 513–548.
OBERHOLZER-GEE, F., ANDK. STRUMPF(2007): “Effect of File Sharing on Record Sales: An
Empirical Analysis,”Journal of Political Economy, 115(1), 1–42.
PEITZ, M.,ANDP. WAELBROECK(2004): “The Effect of Internet Piracy on Music Sales:
Cross-Section Evidence,”Review of Economics Research on Copyright Issues, 1(2), 71–79.
QIAN, Y. (2008): “Impacts of Entry by Counterfeiters,” The Quaterly Journal of Economics,
123(4), 1577–1609.
ROB, R., AND J. WALDFOGEL (2006): “Piracy on the High C’s: Music Downloading, Sales
Displacement, and Social Welfare in a Sample of College Students,” Journal of Law and Economics, 49(1), 29–62.
ROSSI, P., G. ALLENBY, AND R. MCCULLOCH(2005): Bayesian Statistics and Marketing. John
SAWTOOTHSOFTWARE(2008): “The CBC System for Choice-Based Conjoint Analysis,” Saw-tooth Software Technical Paper Series.
SMITH, M. D., AND R. TELANG (2012): “Assessing The Academic Literature Regard-ing the Impact of Media Piracy on Sales,” http://papers.ssrn.com/sol3/papers.cfm?
abstract_id=2132153.
SUN, Y. (2012): “The Value of Branding in Two-Sided Platforms,” working paper.
WATERSON, M., AND C. DOYLE (2012): “Your Call: eBay and Demand for the iPhone 4,” International Journal of the Economics of Business, 19(1), 141–152.