UNIVERSITY OF CANTERBURY
Department of Mechanical Engineering
Christchurch New Zealand
Acoustic Absorber Design
by
Jerome P Parkinson
Master of Engilleering
Thesis
by
Jerome P Parkinson
A thesis submitted in
fulfilment of the requirements for
the Degree of.Master of Engineering
in the
Department of Mechanical Engineering
University of Canterbury
Christchurch, New Zealand
Project Summary
Firstly, I would like to thank Dr John Pearse for providing comprehensive project supervision, from administration through to technical support; for ensuring that the project was completed on schedule.
I wish to extend special thanks to Mr Mike Latimer of D.G.Latimer and Associates for the prompt supply, specifications and selection of materials for use as absorbers.
I would also like to thank Professor Cliff Stevenson for his thorough analysis and advice with regard to many aspects of the absorber project.
I would like to thank Professor Walter Eversman, Professor Jeremy Astley and Professor Stuart Bolton for timely advice and comments on the modelling of acoustical materials.
Finally, I wish to thank various people for technical support during the project; Mr Graeme Harris for help in building the flow resistance apparatus; Mr Otto Bolt and many postgraduate students, especially Kent Roache, for help when installing diffuser panels.
Opening Quotation
If such optimality properties exist, and it seems they do, then still further questions arise: Can we show that the usable expressions do not raise problems of unfeasible computation, while unusable ones may do so - perhaps the source of their unusability? These are hard and interesting questions. We understand enough to formulate them intelligibly today, but not much more.
i
Table of Contents
Conventions ,., ... , ... , ... ,., ... ' ... ,.' ... , .. , ... , ... iv
Project Objectives ... v
Project Outline ... v
Chapter 1 Absorber Survey Table of Contents ... vi
List of Figures ... vii
1. Requirements ... 1
2. Porous Absorbers ... 1
3. Membrane/panel absorbers ... 3
4. Helmholtz/cavity absorbers ... 5
5. Multi-layered Absorbers ... 5
6. Materials ... 8
7. Commercially Available Absorbers ... : ... 9
References ... 10
Bibliography ... 12
Summary of Commercial Absorbers ... : ... 13
Chapter 2 Reverberation Room Calibration Table of Contents ... viii
List of Figures ... ix
List of Tables ... ix
1. Introduction ... 14
2. Aims ... 15
3. Theory ... 15
4. Equipment ... 16
5. Procedures ... 20
6. Results and Discussion ... 23
7. Conclusions ... 29
Chapter 3 Absorber Materials
Table of Contents ... , ... x
List of Figures ... xi
List of Tables ... xi
1. Introduction ... 32
2. Aims ... 32
3. Theory ... 33
4. Equipment ... 33
5. Procedure ... 36
6. Results and Discussion ... 37
7. Conclusions ... 42
References ... 43
Bibliography ... 43
Chapter 4 Absorption Testing Table of Contents ... xii
List of Figures ... xiii
List of Tables ... xiii
1. Introduction ... 44
2. Aims ... 45
3. Theory ... 45
4. Equipment ... 45
5. Procedure ... 46
6. Results ... 46
7. Conclusions ... 68
References ... 69
Bibliography ... 69
Chapter 5 Modelling Table of Contents ... xiv
List of Tables ... xv
1. Introduction ... 70
2. Aims ... 70
3. Rigid Framed Fibrous Materials ... 70
4. Elastic Framed Porous Materials ... 71
5. Layered Porous Materials ... 76
6. A Matrix Representation of Layered Materials ... 78
7. Model Comparisons ... 84
8. Conclusion ... 93
References ... 94
Bibliography ... 95
Chapter 6 Project Findings Table of Contents ... xvi
List of Tables ... xvi
1. Introduction ... '" 97 2. Aims ... 97
3. Results ... 97'
4. Conclusions ... 100
Project Conclusion ... 101
Further Work ... 101
Appendices ... 103
Appendix A ... 103
Appendix B ... 107
Appendix C ... : ... 113
Conventions
Porous absorbing materials, such as CMSG foam and polyester, are sometimes referred to in
the text as bulk materials or substrate.
The measured results are in one third octave frequency bands and hence should be referred to
as frequency bands. To avoid needless repetition much of the discussion refers to frequencies
and frequency ranges instead of frequency bands and frequency band ranges.
The Reverberation Room is located in the Department of Mechanical Engineering, University
of Canterbury. It is referred to in capitals, "Reverberation Room" or in some cases, "Room".
The project is presented in chapters. A table of contents, list of figures and list of tables are
included at the start of each chapter which relate to that chapter. Similarly, a list of references
v
Project Objectives
The objective of the Absorber Project was to analyse the acoustic performance of a range of materials as acoustic absorbers. The significant parameters were to be identified and the application of these materials in tuned and wideband absorbers considered.
The outcome from the project was the acoustic performance of a range of absorbers using optimised materials to achieve a user specified performance.
Project Outline
1
Absorber Survey
Summary
The Absorber Survey is comprised of a literature search on absorbers and a summary of
commercially available absorbers. This research was carried out to gather knowledge on
absorber theory and to ascertain the performance of existing absorber technologies. The main
types of absorbers in the literature were porous, membrane, helmholtz and multilayered
absorbers. These were described in terms of the materials commonly used and their acoustic
performance. A theoretical optimum flow resistance has been found for rigidly backed bulk
porous materials and is equal to 3pc (1235 mks rayls) where p is the density of air and c is the
speed of sound in air. Similarly, an optimum flow resistance for fabric coverings has been
found to be Ipc (412 mks rayls). An extensive range of absorbers are currently available.
Most of these use fibreglass or foam as the bulk absorbing layer and are sometimes combined·
with impervious films or perforated metal coverings. The highest NRC (arithmetic average of
absorption coefficients in octave bands from 125 Hz to 2 kHz) at 25 mm thickness was 0.87
for a polyester in fill covered with a porous acoustic textile. The acoustic characteristics of
vi Acoustic Absorber
Table of Contents
Table of Contents ... vi
List of Figures ... vii
1. Requirements ... 1
2. Porous Absorbers ... 1
2.1 Description ... 1
2.2 Theoretical performance ... 2
3. Membrane/panel absorbers ... "' ... 3
3.1 Description ... 3
3.2 Theoretical performance ... 4
4. Helmholtz/cavity absorbers ... 5
4.1 Description ... ... 5
4.2 Theoretical performance ... 5
5. Multi-layered Absorbers ... 5
5.1 Description ... 5
5.2 Theoretical performance ... 6
5.3 Practical performance ... 7
6. Materials ... 8
7. Commercially Available Absorbers ... 9
References ... 10
Bibliography ... 12
list of Figures
Figure No.
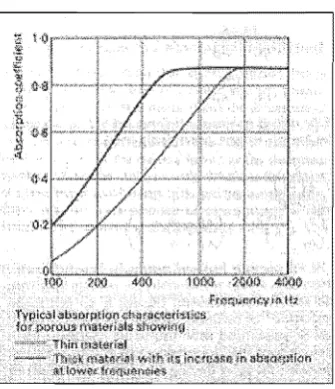
Figure 1.1 Typical absorption curve for a porous material. ... 2
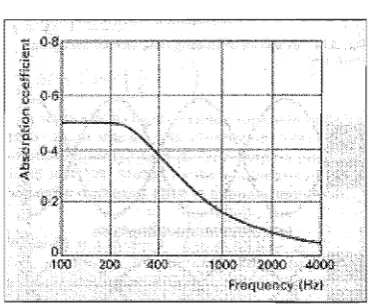
Figure 2.1 Typical absorption curve for a membrane or panel absorber. ... 4
CH 1 Absorber 1
1. Requirements
Absorbers are required:
1. To control the reverberation time and reduce the reverberant sound levels within a
room.
2. To reduce the undesirable effects of standing wave resonance.
3. To attenuate noise inside ductwork.
4. To have a low unit cost (preferably less than $80/m2).
5. To be aesthetically pleasing.
6. To meet the relevant fire standards.
In a typical room, carpet and curtains absorb high frequency sound while walls absorb low
frequency sound. Absorbers are usually required for the mid-frequency range, 100 to 5000
Hz. Within this range, absorption is often required at 300 Hz.
Acoustically sensitive rooms, such as TV studios, usually have specific absorption
requirements. Wide band, highly absorbing wall treatments of limited depth are often
necessary. The ability to tune the absorbers to particular frequencies is also desirable.
2. Porous Absorbers
2.1 Description
Porous absorbers typically consist of a network of interlocking pores that convert sound
energy into heat. Granular or fibrous substances combined with adhesives are compacted into
layers by pressing or weaving. Fibreboard, wools, fibregJass panels, foams and tiles are
common examples of porous absorbers. These generally absorb more sound at higher
Figure 2.1 Typical absorption curve for a porous material.
2.2 Theoretical performance
Delany and Bazley (1969) measured the acoustic properties of many fibrous absorbent materials. They found that the characteristic impedance and propagation constant of these materials normalised as a function of frequency divided by flow resistance. Hence, power laws were used to model the measured results. The impedance and propagation constants were then used to predict normal incidence absorption coefficients for rigidly backed porous materials; see section 3 in Chapter 5 for more details.
New expressions to model sound propagation in fibrous' materials were developed by Allard and Champoux (1991). These theoretical equations were based on the general frequency dependence of viscous forces in porous materials. The predictions were valid at low frequencies whereas Delany and Bazley's model was less accurate at low frequencies.
CH 1 Absorber 3
material thickness was also investigated. A one to one ratio was found to be optimal for a
total flow resistance of 2.8pc to 3.5pc.
Ingard (1994) carried out an in-depth investigation into theoretical absorption. His study showed, similarly to Bies and Hansen, that the frequency dependence of absorption coefficient for a rigid porous layer backed by a wall was predominantly determined by its thickness and flow resistance. The material's porosity and structure factor had a small effect on absorption for a given flow resistance. Absorption of 80% was achieved with a layer flow resistance of 4pc and a layer thickness larger than 111 0 of the wavelength of interest. At 300Hz the wavelength of sound in air is 1.1m. Hence, a 110 mm thick rigid porous absorber is required to attain at least 80% absorption at 300Hz. An absorber this size is generally too thick for typical application as it has high material costs and uses valuable room space. Ingard showed that multi-layered absorbers can reduce this thickness; see section 5.
Flexible porous absorbers such as foams were also considered by Ingard. An open cell absorber's flexibility tended to reduce its low frequency absorption but increased its mid-frequency absorption. Open cell foams with large flow resistances could be programmed to give large resonant type absorption at low frequencies. Closed cell foams typically gave narrow bandwidth absorption.
3. Membrane/panel absorbers
3.1 Description
Figure 3.1 Typical absorption curve for a membrane absorber.
3.2 Theoretical performance
The acoustic properties of permeable membranes were studied by Sakagami, Morimoto and
Takahashi (1995). In particular, the density, thickness, tension and permeability of the
membranes were investigated. The membranes were often used as coverings for building
materials or porous absorbent materials due to their transmissibility and reflective properties.
Membrane tension and density had a small effect on absorption. Again, it was found that
flow resistance was critical to acoustic performance.
Ingard (1994) modelled the acoustical performance of thin porous sheets backed by an air
cavity. He found that a 14 wavelength air cavity gave around 70-80% absorption over an
octave around the resonant frequency. In a diffuse field the optimum flow resistance was 2pc
at the 14 wavelength. He found that a sheet absorber was inferior to a uniform porous layer as
the sheet's absorption dropped to zero at certain frequencies. Similar to the rigid porous
layer, absorption of 80% was possible if the air cavity was larger than 1/10 of the wavelength
of interest with a sheet flow resistance of 4pc. A 110 mm air cavity would be Fequired to
absorb 80% of the sound at 300Hz. Ingard suggested an optimum sheet flow resistance of 2
to 4pc for all frequencies and larger resistances for low frequencies. This raises the idea of a
thin porous sheet in combination with a rigid porous layer to give wideband absorption; see
section 5.
Ingard also modelled parallel, porous sheet absorbers. These consisted of alternating sheet
and air cavity layers. Using unequal separations between the sheets and gradually increasing
the flow resistance per sheet gave more absorption than a uniform porous layer of the same
CH 1 Absorber
5
4. Helmholtz/cavity absorbers
4.1 Description
These absorbers consist of an air volume enclosed by rigid boundaries and coupled to a surrounding space by an aperture. Containers with small open necks are generally used. Absorption takes place through air resonance within the cavity. In practice, cavity absorbers consist of a panel with many holes backed by an air space or fibrous absorbing material. Slotted or perforated boards are similarly used. These absorbers give narrow bandwidth absorption as shown in Figure 4.1.
Figure 4.1 Typical absorption curve for a cavity absorber.
4.2 Theoretical performance
Maa (1987) investigated the acoustical performance of microperforated-panel wideband absorbers. The frequency band of predominant sound absorption depended on the perforation diameter. Large theoretical absorption was attained in one to two octaves with submillimetre holes. These resonators were programmed to give peak absorption at certain frequencies. Double resonators were found to extend the absorption to lower frequencies without affecting high frequencies. Microperforated-panel double resonators gave good absorption covering four octaves. In general, these panels gave good medium to low frequency absorption but performed poorly in frequencies greater than 1600Hz.
5. Multi-layered absorbers
5.1 Description
or film. Air cavities behind the absorber can also be incorporated to improve the performance.
5.2 Theoretical performance
Sakagami, Morimoto and Takahashi (1995) modelled the combination of permeable membranes with fibreglass and air layers.. A membrane was combined with 50 mm of 32
kg/m3 glass wool and a 300 mm air cavity. Membrane flow resistances of 240 and 680 mks rayls coincided with the most absorption while those with infinite resistance (impermeable) gave the least absorption. This agrees with a Dunn and Davern (1986) hypothesis that multi-layered absorbers should have low frontal reflectance to allow easy entrance of the sound into
the absorber while second or third layers provide the attenuation. The predictions were verified experimentally in a reverberation room. Agreement between the model and practice was very good except for deviations at frequencies less than 250Hz.
Dunn and Davern (1986) developed a method for calculating the acoustic impedance of multi-layered systems. A database of wave impedances and propagation constants was used to generate the absorption coefficients of different layer combinations. They recommended the selection of a low flow resistance material to minimise frontal reflections for solid backed single layers. Systems using air cavities were studied. In general, for the same amount of material it was better to have an air space than not to have one. For the same overall thickness (> 1 00 mm) it was better to have solid material than incorporating an air cavity. Dunn and Davern also compared their model to experimental results and found good agreement.
Brouard, Allard, Bruneau, et al (1992) modelled the acoustical impedance and absorption characteristics of porous layers with slotted facings. They found that an absorber with good low frequency absorption and limited depth could be made by modifying slit width and separation. However these absorbers produced a typical narrow band resonant peak. Similarly, Ballagh (1997) presented a method for predicting random incidence absorption of porous materials with slotted, perforated or panel facings. In both cases good agreement was found between the theoretical and experimental results.
CH 1 Absorber 7
lends further credence to the Dunn and Davern (1986) hypothesis that multi-layered absorbers
should have low frontal reflectance to allow sound into the absorber while deeper layers
provide the attenuation. He also found that layers of different flow resistance .gave more
absorption than a material with uniform flow resistance for the same thickness.
A rigid porous layer in combination with a thin porous sheet was modelled by Ingard. He
found that adding a thin porous cover screen gave a significant increase in low frequency
absorption. The porous layer's high frequency absorption started to reduce when the screen's
flow resistance reached Ipc (412 mks rayls).
Ingard also studied the effect of air layers on porous absorbers. Incorporating an air cavity
into an absorber while retaining the same overall flow resistance always gave less absorption
than a solid absorber.
Most multilayered absorbers have their layers aligned parallel to the backing surface.
Takahashi (1989) studied the phenomenon of excess sound absorption of periodically
arranged flat surfaces. He carried out a theoretical and experimental investigation into the
effect of surface impedance discontinuity on absorption. An absorber made of alternating
strips of wood and fibreglass was modelled. Excess sound absorption is present if more
sound is absorbed from the combination of materia~s than just the average of each material's
absorption. He found that excess sound absorption occurred in all cases of periodically
arranged surfaces. The material's flow resistance affected excess absorption at mid to high
frequencies. The thickness of the rigidly backed layer was related to absorption at low
frequencies. Absorption at high frequencies was affected by the period of the two materials.
The width of the materials affected the absorption in all frequencies. The results showed that
a combined material width of 0.125 to 0.5 m and a width ratio of 0.25 gave the most
absorption in all frequencies gave the best wideband absorption.
5.3 Practical performance
Dodd, Ballagh and Camp (1991) investigated "tandem" absorbers aiming for a
multi-layered, low cost, wideband absorber of reduced depth. A variety of systems were trialed
based on combinations of fibreglass, rigid board and air cavities. A combination of 25 mm
fibreglass, 5 mm Kappa board and 25 mm fibreglass gave peak absorption from 125 to 250Hz
with 25 rnm fibreglass, 2 rnm Kappa board and 25 rnm fibreglass. In general, high absorption peaks were attainable but with a narrow bandwidth.
Dodd and Trimble continued the "tandem" absorber investigation. They aimed to combine the separate performance of panel absorbers with porous absorbers. This was achieved with 20 rnm fibreglass and hardboard. This tandem system had a narrow peak at 200Hz and a typical porous layer absorption trend in the high frequencies. The effect of fibreglass position within the cavity was also studied. This system had a peak at 630Hz but poor absorption on either side. There was small variation in absorption with fibreglass position. As the fibreglass moved closer to the septum, the bandwidth of absorption increased, as did the effective flow resistance. With fibreglass in the middle of the cavity, doubling the septum mass moved the resonance frequency down by ~2 but narrowed the bandwidth by 2.
6. Materials
The use of foam additives to reduce sound transmission was investigated by Cushman (1995). Common polymers with additives demonstrated excellent bulk acoustic absorption. Attenuation is based on the mechanism of phase cancellation. High impedance particles produce in-phase acoustic reflections while lower impedance particles give out of phase reflections. Simultaneous in-phase and out of phase r~flections increase the probability of phase cancellation. Hence, a combination of high and low impedance particles gives good attenuation. It was found that if the correct proportions of high and low impedance particles were mixed in a polymer matrix more attenuation was possible than the sum of the particle's individual attenuations. He suggested using a mix of iron powder and glass microspheres, for high and low impedance particles respectively, in a polymer foam matrix.
CH 1 Absorber 9
7. Commercially Available Absorbers
References
Allard, J.F., Champoux, Y. (1991), "New empirical equations for sound propagation in rigid frame fibrous materials", J. Acoust. Soc. Am., v91, 1992:3346-3353.
Ballagh, K. (1997), "Predicting sound absorption of perforated and slotted absorbers", NZ Acoustics, v9, 1997: 15-22.
Bies, D.A., Hansen, CoH. (1979), "Flow resistance information for acoustical design", Applied Acoustics, 13, 1980:357-391.
Brouard, B., Allard, J.F., Bruneau, H., Lauriks, W., Verhaegen, Co (1992), "Acoustical impedance and absorption coefficients of porous layers covered by a facing perforated by parallel slits", Noise Control Engineering Journal, v41, 1993:289-296.
Cushman, W.B. (1995), "Using additives to reduce sound transmission", Modern Plastics, April, 1995:75-79.
Delany, M., Bazley, (1969), "Acoustical properties of fibrous absorbent materials", Applied Acoustics, v3, 1970:105-116.
Dodd, G., Ballagh, K., Camp, S. (1991), "The tandem absorber a programmable wide-band absorptive treatment.", Proceedings, Internoise 1991:593.
Dunn, I.P., Davern, W.A. (1986), "Calculation of acoustic impedance of multi-layer absorbers", Applied Acoustics, 19, 1986:321-334.
Maa, D.Y. (1987), "Microperforated-panel wideband absorbers", Noise Control Engineering Journal, v29, 1987:77-84.
CH 1 Absorber 11 Morimoto, M., Sakagaroi, K., Takahashi, D., (1995), "Acoustic properties of permeable membranes", J. Acoust. Soc. Am., v99, 1996:3003-3009.
Bibliography
TA Allard, J.F., "Propagation of sound in porous media: modelling sound 418.9 absorbing materials", Elsevier, New York, 1993 .
. P6 .A419
TD
892 .n784QC 233 .144
Beranek, L.L., "Noise and vibration control", McGraw Hill, 1988.
Ingard, U., "Notes on sound absorption technology", Noise Control Foundation, 1994.
NA Kuttruff, H., "Room acoustics", Applied Science Publishers, London,
2800 1979 .
. K97
TA 365 . S643a
QC 233 .z98
Smith, B.J., Peters, R.J., Owen, S., "Acoustics and noise control", Addison Wesley Longman, 1996 .
Summary of Commercial
Absorbers
---TYPE MANUFACTURER DESCRIPTION PERFORMANCErrYPE NRC
POROUS
Wall panels Acoustical Solutions Semi-rigid glass wool90kglm3 (24,48,80,130 kglm3 Typical high frequency avail) at 2S,SO,7S,100mm thickness. Optional
aluminium foil backing available.
Perforated metal packed with high density polyester Typical high frequency blanket, faced with fabric. Optional mount away from
walL 2S,SOmm thickness.
Wall panel Armstrong Perforated mineral or fibreglass substrate. Fabric or 0.7
vinyl finish
Decifill P INC Polyester in fill laminated to textile SOmmcavity 0.71*
Corridor Panel Euroacoustic Rigid stonewoollined with fibreglass tissue. 2Smm 2S0-1000Hz a=0.8
thick. > 1000Hz a=0.9
Wall panel Euroacoustic Rigid stonewool with fibreglass mat facings. SO,80mm. 300mmplenum, >2S0Hz a=0.9-LO
Notice board Acoustical Solutions Semi-rigid glass wool 90kglm3• Optional aluminium foil Typical high frequency
backing or 4mm perforated/plain MDF available. Baffles Acoustical Solutions Acoustic foam
Hygiene panel Acoustical Solutions 48kglmj
polyester board 50mm thick or 32-34kglmj
Typical high frequency with resonant glass wool board 50mm thick. 30micron facing film. peak at 500Hz.
Aluminium frame.
Ceiling panel Euroacoustic Stonewool panel lined with fibreglass tissue. 20mm 300mm plenum, >250Hz a=0.8-0.9 thick
Foam Acoustical Solutions Rectangular 32-35kglm3• 25,50mm thick. Optional Resonance peak at 1000Hz**
3,6mm perforated/plain MDF backing. Plain/convoluted facings. Optional nylon fibre finish
Decifoam ALR INC 25mm foam faced with aluminium foil. Resonance peaks at 315,1600Hz 0.61*
DecifoamF INC 12,25,50mm foam faced with film Typical high frequency. 12mm 0.51*
25mm 0.78*
50mm 1.0*
DecifoamFl INC Foam with impermeable film. 12,25,50mm thick. Peak at 400Hz 0.65*
DecifoamM INC Foam with metallised polyester film M12 Peak at 600, 2000Hz 0.49*
M25 at 315Hz 0.59*
M50 Peak at 125-250,1000,3000Hz 0.60*
Decifoam T
rc
Foam with textile facing. T12 0.51*T25 0.73*
-TYPE MANUFACTURER DESCRIPTION PERFORMANCErrYPE NRC
Decifoam V INC Foam with perlorated vinyl facing V12 Peak at 800Hz 0.48*
V25 Peak at 1000Hz 0.74*
V50 Peak at 500Hz 0.94*
Rigid foam Novio Pty Phenolic 50kglm5 rigid open cell foam Resonance peak at 4-500Hz and typical , high frequency.
I MEMBRANE
Decitex P16 INC Acoustic textile (porous) with air space. Typical high frequency. 25mm cavity 0.24*
sheet 100mm cavity 0.65*
HELMHOLTZ
Decitex P52 INC Perlorated metal 11-30% open area. 25,50,250,500mm 25,50mm cavities - Typ. high frequency
cavities. 250mm cavity - peak at 250-500Hz
500mm cavity - peak at 200Hz .~~~~~~~.
MULTILAYER
Wall panel Euroacoustic Stonewool with fibreglass tissue glued to perlorated >500Hz 0;=1.0 metal sheet. 40mm thick.
Decipol INC As per Decitex P16 CINC) with polyester infill Decifill P350 25mm cavity 0.68*
Decipol 25mmcavity 0.87*
Ceiling panel Fjord Armstrong Mineral wool faced with fibre fabric. 18,25mm thick.
Ceiling panel ACI Sonoacoustic Fibreglass faced with pin perforated vinyl facing. 17,22mm thick
Duct liner CSR Bradford Fibreglass with various perforated metal facings. 32kglm3. 13,25,50,75,100mm thick.
* Tested according to AS 1045-1971 or 1988, reverberation chamber.
**
Tested according to AS 1935-1976.a
= Absorption coefficient.Typical high frequency
250 and 500 Hz peaks - 17mm 0.75*
22mm 0.80*
25mm perf. facing. Peak at 2000Hz 0.75* 50mm perf. facing >500Hz a>O.97 1.0*
25mm glass tissue facing 0.65*
v rb r
alibr
ti
II
I
m
Summary
Table of Contents
Table of Contents ... viii
List of Figures ... ix
List of Tables ... ix
1. Introduction ... 14
1.1 Reverberation ... ... 14
1.2 Reverberation rooms ... ... 14
1.3 Diffusivity ... ... 14
1.4 Measurements ... 14
2. Aims ... 15
3. Theory ... 15
3.1 Calculation of absorption ... 15
3.2 Calibration of reverberation rooms ... 15
4. Equipment ... 16
4.1 Reverberation Room ... 16
4.2 Dijfusers ... ... 17
4.3 Modular precision sound analyser, Type 2260B ... 18
4.4 IBL EON Power 10 ... 19
4.5 Sound intensity analyser, Type 4433 ... 19
4.6 Materialsfor calibration ... ... ... 20
5. Procedures ... 20
5.1 Dijfusivity ... 20
5.2 Reverberation ... ... 22
5.3 Uniformity ... .' ... 22
5.4 Benchmark ... 22
6. Results and Discussion ... 23
6.1 Diffusivity ... ... 23
6.2 Reverberation ... ... 26
6.3 Uniformity ... 27
6.4 Benchmark ... :: ... 28
7. Conclusions ... 29
CH 2 Reverberation Room Calibration ix
List of Figures
Figure No.
Figure 4.1 Reverberation Room dimensions, modifications and diffuser locations ... 17
Figure 5.1 Test specimen - Bonded foil on foam (foam up) in (a) refurbished Room, (b) refurbished Room with
diffusers ... 23
Figure 6.1 Standard deviation of intensity in the Reverberation Room ... 23
Figure 6.2 Diffuser installation - average absorption versus diffuser area ... 24
Figure 6.3 Standard deviation of reverberation times in original Room ... 25
Figure 6.4 Standard deviation of reverberation times in, (a) original Room; (b) refurbished Room ... 25
Figure 6.5 Reverberation times in the original Room and the Refurbished Room ... "" ... 26
Figure 6.6 Normalised reverberation times in the original Room and refurbished Room ... 27
Figure 6. 7 Variation of pressure levels in the refurbished Reverberation Room ... 27
Figure 6.8 Benchmark absorption test for Tedlar™ film on foam ... 28
Figure 6.9 Benchmark absorption test for Bonded foil on foam (foam up) ... 28
Figure 6.10 Effect of curvature on test specimen ... 29
List of Tables
Table No.
Table 4.1 Reverberation Room areas and volume ... 16
Table 4.2 Diffuser area percentages ... 18
Table 4.3 Software settings ... "' ... 19
Table 4.4 Calibration materials ... 20
Table 5.1 Intensity measurements - speaker and microphone locations ... 20
Table 5.2 Reverberation time speaker and microphone locations ... 21
1. Introduction
1.1 Reverberation
Sound does not die away the instant it is produced but continues to be heard for some time due to reflections from walls, floors, ceilings and other surfaces. It mixes with later direct sound and is called reverberant sound. Reverberant sound can convey atmosphere to an audience, from the haunted house with a long reverberation time to the padded cell. Reverberation time is the time it takes for a sound to decay by 60 dB. This is found by generating a noise of large amplitude and measuring its rate of decay. In practice, this is difficult to measure and so 20 dB and 30 dB decays are used and extrapolated to find the 60 dB decay.
1.2 Reverberation rooms
Reverberation rooms are typically large empty rooms with long reverberation times. These usually have volumes greater than 200m3 and non-parallel wall and ceiling surfaces. A truly reverberant room is one where energy from a noise source is diffused throughout the room so that the sound pressure level is the same everywhere. Absorption coefficients of an item can be calculated by measuring reverberation times in a reverberation room, with and without the item present.
1.3 Diffusivity
In a diffuse field sound is reflected many times so that it travels in all directions with equal magnitude and probability. A perfectly diffuse room should have equal intensity in all directions. It is important that a reverberation room is diffuse to ensure accurate measurements.
1.4 Measurements
The variation of sound intensity and reverberation time within a room is inversely related to the degree of diffusivity in the room. The correct amount of diffusers can be obtained from the diffuser installation procedure outlined in ISO 354:19881. An ideal amount of reverberation is specified by ISO 3743: 19882. The variation in sound pressure level within a room is inversely related to the sound field uniformity. A room's performance can also be
I Acoustics - Measurement of sound absorption in a reverberation room.
2 Sound power levels of noise sources. Part 3: Engineering methods for determination of sound power levels for
CH 2 Reverberation Room Calibration 15
benchmarked by measuring the absorption of materials that have been previously tested in
other laboratories.
2. Aims
The main aim of the Reverberation Room calibration was to improve the Room's acoustic
characteristics so that accurate absorption measurements could be carried out. This was to be
achieved by:
1. Improving the diffusivity. This was identified as critical to the validity and
repeatability of absorption measurements.
2. Improving the reverberation times. The aim was to move the normalised times closer
to the limits as specified in the international standard ISO 3743:1988 - especially in
the frequency band of interest (300Hz).
3. Improving the sound field uniformity.
4. Benchmarking the Room against a Telarc registered room. This would be done by
comparing the absorption of a test specimen in the registered room and in the
Reverberation Room.
3. Theory
3.1 Calculation of absorption, ISO 354: 1988
a =
55.3~
(_1 ___ 1 ) cA T2 Tla
=
absorption coefficient.V = volume of empty Reverberation Room, m3.
c
=
speed of sound in air (343m1s).A
=
area of test specimen, m2•Tl = reverberation time of empty Reverberation Room (s).
T2
=
reverberation time of Reverberation Room with test specimen present (s).3.2 Calibration of reverberation rooms
(3.1)
An in-depth study was carried by Warnock (1983) on the practical aspects of absorption
measurements in reverberation rooms. . He carried out a series of computer controlled
measurements of absorption coefficients in a single reverberation room of similar size and
C423-813 diffusivity requirements in the room with only fixed diffusers. Several microphone positions were required for precise measurements. He found strong variations in reverberation time with position in the room, especially at low frequencies. It was concluded that ISO 354 met the requirements for precise reverberation time measurements by specifying multiple source, absorber and microphone positions.
4. Equipment
4.1 Reverberation Room
4.1.1 Dimensions
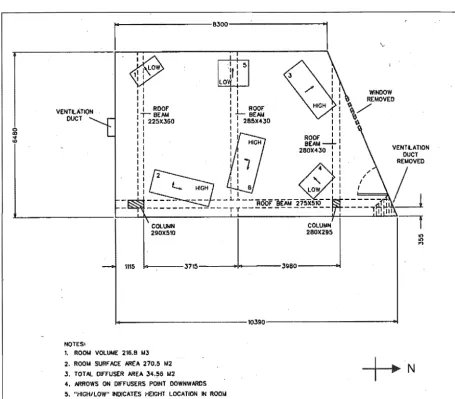
See Figure 4.1 for the Room's size and shape. Table 4.1 shows the area and volume of the original and refurbished rooms.
Table 4.1 Reverberation Room areas and volume.
Original Room Refurbished Room Floor area (m2) 59.7 +/- 0.1 60.1 +/- 0.1 Total surface area (mt) 266.9 +/- 0.7 270.5 +/- 0.6
Room volume (mj) 215.7 +/- 0.7 216.8 +/- 0.7
4.1.2 Refurbishment
The Reverberation Room was refurbished to improve its acoustic performance. The floor was levelled with a self levelling compound. This was done so that the test specimen would lie flat on the Room's floor. An observation window was removed and bricked up as it was thought that sound was being transmitted through the window. An air conditioning duct was removed and all surfaces in the Room were repainted, Figure 4.1 and Figure 5.1 (b).
CH 2 Reverberation Room Calibration
17
VENTILATION DUCT
1115 I I I I
: : ROOF" I ' - BEMI I I 225X360
I I
I I
COLUMN 290)(510
COLUMN 280)(295
1 + - - - 3 7 1 5 - - - 1 + 0 - - - - 3 9 8 0 - - -....
VENTILATION DUCT REIAOVED
1 0 - - - 1 0 3 9 0 - - - < 0 1
NOTES'
1. ROOM VOLUME 216. II 1.43
2. ROOIA SURF" ACE AREA 270.5 M2
3. TOTAl DIF"F"USER AREA 34.56 M2 4. ARROWS ON DIfF"USERS POINT DOWNWARDS
[image:35.609.76.532.54.453.2]5. "HIGH/LOW" INDICATES HEIGHT lOCATION IN ROOM
Figure 4.1 Reverberation Room dimensions, modifications and diffuser locations.
4.2 Diffusers
International standard, ISO 354-1985 recommends diffusers: 1. Using damped sheets with low absorption.
2. Having a mass/unit area of greater than 5kglm2. 3. With a size range of 0.8-3 m2 (on one side).
4. Having an area (both sides) 15-25% of the total surface area in rectangular rooms.
Table 4.2 Diffuser area percentages.
University of ISO 354 RMIT* NRCC** Canterbury Recommendation
Total diffuser area / Total 12.8 % 15-25% 12.8 % 8.2% Room surface area
* Royal Melbourne Institute of Technology.
** National Research Council Canada, Warnock (1983).
The diffusers used (17.4 kg/m2) were heavier than recommended by ISO 354:1988 (5kg/m2) to reduce the effect of panel resonances. This was important as the diffusers were supported at three points by flexible steel wire. Diffusers with a large area were used (2.88m2) to ensure that low frequency sound waves were interrupted. Six diffusers were added to the room -three located high and -three located low. Each diffuser was placed at random angles in the Room but avoiding 30 and 45 degree standing wave reflections. Six diffusers were used as this represented a total diffuser area, 12.8% of the total Room surface area. ISO 354: 1988 recommends 15-25% area ratio for rectangular rooms. The Reverberation Room has one angled wall and so a smaller area ratio was chosen. The area ratio used is also the same used at RMIT* and more than the ratio used at NRCC * *, both of which were comparable in volume and surface area to the Reverberation Room.
4.3 Modular precision sound analyser, Type 22608.
This is a Bruel and Kjaer hand held, battery operated, two channel instrument comprising hardware and embedded operating system software. It meets IEC and ANSI type 1 sound level meter standards.
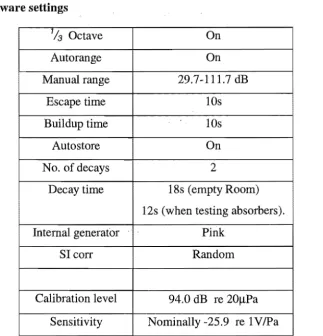
Enhanced Sound Analysis Software, type BZ 7202 was used for pressure level measurements. Building Acoustics Software, type BZ 7204 was used for reverberation time measurements, with the settings of Table 4.3.
CH 2 Reverberation Room Calibration 19
Table 4.3 Software settings
1/3 Octave On
Autorange On
Manual range 29.7-111.7 dB
Escape time lOs
Buildup time lOs
Auto store On
No. of decays 2
Decay time 18s (empty Room) 12s (when testing absorbers).
Internal generator Pink
SI corr Random
Calibration level 94.0 dB re 20!lPa
Sensitivity Nominally -25.9 re IVlPa
4.4 JBL EON Power 10
A 1 lOW portable speaker and amplifier (tilted at 30 degrees).
4.5 Sound intensity analyser, Type 4433
The sound intensity analyser is a Bruel and Kjaer portable, battery operated instrument designed to measure sound pressure level, particle velocity level and sound intensity level in single octave bands. It fulfils IEC 651 type 1 requirements.
[image:37.609.153.477.72.408.2]4.6 Materials for calibration
Table 4.4 Calibration materials.
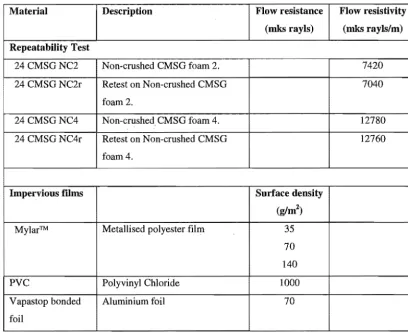
Material Mass Thickness Flow resistivity
FoamSPF 29 kg/mJ 25mm 13820 mks rayls/m
TedlarTM film 56.4 g/m2 37.5 ~m Impervious
Aluminium foil 70 g/m2 120 !lm Impervious
SPF foam is an open cell flexible polyurethane foam of the polyether type. It typically has 35-40 cells per 25 mm and a density of 27-29 kg/m3.
5. Procedures
5.1 Diffusivity
5.1.1 Intensity
Sound intensity measurements were made in the Reverberation Room with the Sound Intensity Analyser probe 1.5m from the floor in six microphone directions (north, south, east, west, up and down) in the positions shown in Table 5.1. The measurements were repeated for each microphone direction. Pink noise, generated by the 2260 sound analyser, was played through the JBL speaker which was tilted at approximately 30 degrees. Tests were carried out in the original Room and in the refurbished Room, with and without diffusers. The Intensity Analyser's autorange and autoscan functions were used along with a 2s averaging time.
Table 5.1 Intensity measurements - speaker and microphone locations.
Original Room Refurbished Room
Speaker Mic. Speaker Mic.
CH 2 Reverberation Room Calibration 21
5.1.2 Diffuser installation
Diffusers were installed in the Reverberation Room according to the procedure outlined in
Annex A of ISO 354-1985. Sound absorption measurements were carried out, as in section
5.4, on a foam test specimen:
i. without diffusers in the Room;
ii. with one stationary diffuser in the Room; and
111. with increasing quantities of diffusers (up to six diffusers).
The test specimen comprised 125 mm of polyurethane foam. See Figure A2 in Appendix A
for its absorption characteristics. Figure 4.1 shows the diffuser positions in the Room.
Average absorption coefficients were calculated for the range, 500 to 4000Hz, for each
diffuser installed. A plot of mean absorption versus diffuser area should approach a
maximum and thereafter remain constant with increasing diffuser area (ISO 354:1988). The
optimum number of diffusers is obtained at the point where the mean absorption reaches a
constant value.
5.1.3 Variation of reverberation times
The 2260 sound analyser, building acoustics software and JBL speaker were used to measure
reverberation times in the Reverberation Room. The 2260 analyser was calibrated externally
and internally before each set of measurements. Measurements were made at a variety of
speaker and microphone locations within the Room as shown in Table 5.2. See Figure Al in
Appendix A for point locations in the Room. The noise level was nominally 85 dB(A).
Reverberation times were measured with the microphone at 1m and 1.5m from the floor for
each speaker and microphone combination.
Table 5.2 Reverberation time speaker and microphone locations.
Original Room Original Room Refurbished Refurbished + four diffusers + six diffusers Speaker
I
Mic Speaker MicI
Speaker Mic Speaker MicPt 6 East
I
Pt 19 Pt 6 East Pt19 Pt 6 East Pts 2,17,33 Pt 6 East Pts 2,17,33Pt 9 Northwest Pt 9 Northwest Pt14 Pt 9 Northwest Pts 35, 19,4 Pt 9 Northwest Pts 19,4
Pt 19 North Pt14 Pt 19 North Pt14 Pt 29 South Pts 6, 21, 37 Pt 29 South Pts 6, 21, 37
Pt 38 South Pt12 Pt 38 South Pt12 Pt 11 North Pts 39,24 Pt 11 North Pts 39,24
Pt 13 West Pt22
Pt 16 South
~
Pt 6 East5.2 Reverberation
Average reverberation times were calculated, for the original and refurbished Room, from the positions in Table 5.2 .. These were normalised according to ISO 3743:1988.
5.3 Uniformity
Sound pressure levels were measured in the refurbished Room with six diffusers installed. The 2260 analyser was used to generate pink noise and to measure 15s Leq pressure levels. The JBL speaker and amplifier were used to produce a nominal sound pressure of 85 dB (A). Pressure levels were measured at 1m and 1.5m heights in seven positions throughout the Room.
5.4 Benchmark
The absorption coefficients of four different specimen were measured in a Telarc registered laboratory in Auckland. These specimen were then tested in the Reverberation Room.
The 2260 sound analyser, building acoustics software and JBL speaker were used to measure reverberation times in the Room, with and without the test specimen present. The 2260 analyser was calibrated externally and internally before each set of measurements. A variety of speaker and microphone positions were used within the Room as shown in Table 5.3. The JBL amplifier and speaker was set to produce approximately 85 dB(A). Reverberation times were measured with the 2260 analyser's microphone at 1m and 1.5m heights for each speaker and microphone combination. Two reverberation decays were measured at each microphone height. A total of 12 reverberation decays were measured for each test specimen.
Table 5.3 Benchmark speaker and microphone positions
Speaker Microphone Pt 4 South Pt 23 Pt 17 East Pt 6
Pt 38 Northwest Pt 30
See Figure A.1 in Appendix A for the point locations in the Room.
CH 2 Reverberation Room Calibration 23
[image:41.609.94.528.428.744.2](a) (b)
Figure 5.1 Test specimen - Bonded foil on foam (foam up) in (a) refurbished Room, (b)
refurbished Room with diffusers.
6. Results and Discussion
6.1 Diffusivity
6.1.1 Intensity
It was difficult to draw any general conclusions from the intensity results. Refurbishing the
Room seems to have improved the diffusivity at 125, 500 and 1000 Hz; as seen by smaller
deviations in intensity, Figure 6.1.
Standard deviation of intensity in the Reverberation Room
6 r---,---,r---,---,---~----_,
5 ~----~----~---+---+---~----~
~ 4 r---~----~---+---~---~~~~
It!
'> Q)
"C3+---,~-+~~--+__--"'*_+_----~~,£...~~---"'>.,c___l
"C .... to "C
; 2 ·~----~----~T_----+_--~~~----~----~ Cii
o -~---+---~---+---~---+---~
-+-Original Room, Empty
,---Refurbished Room, Empty
~ Refurbished +
Six diffusers
I
125 250 500 1000
Freq. (Hz)
2000 4000 8000
This is probably due to longer reverberation times, especially at lower frequencies, in the refurbished Room. The deviations from 2000 to 8000 Hz were increased by the Room refurbishment. These results, especially the large increase at 8000 Hz, were difficult to explain. Adding diffusers to the Room improved the diffusivity further at 125,250,500,4000 and 8000 Hz but impaired it at 1000 and 2000 Hz. The addition of diffusers seemed to improve the diffusivity but anomalies were present at 1000 and 2000 Hz. The diffusers may have set up some standing waves in the Room. But, as described below, the diffusers were carefully placed to reduce the chance of standing wave reflections.
6.1.2 Diffuser insta.llation
It would appear that the characteristic absorption peak occurred with three to four diffusers, Figure 6.2. However, it is clear that with the addition of diffusers five and six that the absorption increased further. The individual frequency versus diffuser area plots, Figure A.3 (a) to (c) in Appendix A, show that the secondary increase is due to absorption in the 630 to 1000 Hz and 2500 to 4000 Hz frequency bands. These results would indicate that one to two more diffusers are required to reach maximum absorption.
'N' 1.3
1.3
~ 1.2
~ 1.2
8
e
1.1c .~ 1.1
a
~ 1.0
~
Q) 1.0
~
Qj 0.9
>
« 0.9 0.8
o
0.0 0.0
Diffuser installation procedure
2 3 4 5
5.8 11.5 17.3 23.0 28.8
2.1 4.3 6.4 8.5 10.6
Diffuser number; Diffuser area I Room surface area (%);
Total diffuser Area (m2)
Figure 6.2 Diffuser installation - average absorption versus diffuser area.
CH 2 Reverberation Room Calibration 25
6.1.3 Reverberation time variation
Figure 6.3 shows that the addition of four diffusers to the original Room had the most effect at lower frequencies (100-250 Hz). The diffusers vastly improved the Room's performance at low frequencies. This was due to the large size of the diffusers used.
2.50 2.00 1.50 ~ 0 iii 1.00 0.50 0.00
Standard deviation of reverberation times in original Room
o ~ 0 0 0 ~ ~ 00 0 0 0 0 0 0 0 0 0 0
o ~ ~ ~ ~ M ~ ~ ~ ~ 8 ~ g 0",° g ~ 8 8
C\I M v LO
Freq. (Hz)
--+-Empty Room St Dev. (4positions x 2hts)
.... 0 .... · 4 Diffusers St Dev. (7positions x 2hts)
Figure 6.3 Standard deviation of reverberation times in original Room.
Addition of six diffusers to the refurbished Room decreased the variation in reverberation time in the 100 to 125 Hz and 315 to 5000 Hz frequency ranges, Figure 6.4. However, between 160 and 250 Hz the deviations were quite similar. The diffusers have improved the· Room's performance across most of the frequency range.
2.50 2.00 1.50 ,,: Q) 0 ii5 1.00 0.50 0.00 8 ~
Standard deviation of reverberation times in refurbished Room
io(l 0 0 0 ~ 0 0 0 0 0
~ 0 ~ cry 0 0 &l 0 0
'" '"
..,. ~ co ~ Freq. (Hz)0 0 0 0 0
~ 0 0 0 ~
~ ~ 0 io(l cry
'"
0 8
0
0 0
..,. ~
--+-Empty Room St Dev. (11 positions x 2hts)
- 0 - 6 Diffusers St Dev (1Opositions x 2hts)
The refurbished Room's variation in reverberation times were generally higher than in the original room. This is thought to be due to a larger number of measurements made in the refurbished Room (10 to 11 positions) than in the original Room (4 and 7 positions). The increase in variation towards lower frequencies may be due to the variation of a function of a random variable being greater at lower frequencies. A similar trend is apparent in the standard deviation of pressure levels in the refurbished Room, section 6.3. These results would indicate that the Reverberation Room is less diffuse at frequencies lower than 315 Hz.
6.2 Reverberation
Refurbishing the Room dramatically increased the amount of reverberation at low frequencies but had a lesser effect at high frequencies, Figure 6.5. The refurbishment significantly increased the normalised times below 1000 Hz and decreased those above 1000 Hz, Figure 6.6. The large increases in reverberation time at low frequencies were attributed to the removal of the observation window and ventilation duct. Painting the Room's surfaces would account for the increase in times at mid to high frequencies. It can be seen that with diffusers present, the 100 to 160 Hz and 1000 to 1250 Hz frequency bands meet ISO 354:1988 requirements. However, it is clear that the other frequency bands do not fit within the standard's limits. Meeting the standard's requirements does not appear to be critical for the Room's performance, as seen by the benchmark results, section 6.4.
16
14
12
10
6
4
2
Effect of refurbishing the Reverberation Room on reverberation
g 8 0 m Q 8 0 0 a 0
N ~ M ~ m ~ g § ~
Freq. (Hz)
-+-Ortginal
-0--Refurbished
1.80
1,80
1AO
1,20
§ 1,00
c;
~ 0,80 0,60
DAD
0,20
0.00 0
'"
0 0 0'"
;:! ~ ;!! ~ ~ C;;
CH 2 Reverberation Room Calibration 27
Normalised reverberation times
0 0 0 0 0
~ 0
'" 0 0 '" CD co ;:!
Freq. (Hz)
0 0
L() 0
~ ;!! 0 0 0
'"
--+-Original-1:r- Refurbished + six diffusers
-Upper ISO limit
[image:45.609.97.523.443.723.2]-Lower ISO limit
Figure 6.6 Normalised reverberation times in the original Room and refurbished Room.
6.3 Uniformity
The sound field uniformity is seen by the standard deviation of sound pressure in the Reverberation Room, Figure 6.7. The general increase of standard deviation with lower frequencies was again thought to be due to the variation of a function of a random variable increasing with lower frequencies. However, itdoes appear that the Room was less uniform at frequencies lower than 250 Hz.
2.50
2.00
lil 1.50
B
0.50
0.00
Standard deviation of pressure levels in refurbished (with 6 diffusers) Reverberation Room (6positions x 2hts @85dB(A»
o <0 ~ Freq. (Hz) o ::5
6.4 Benchmark
1E o
u 1.2
0.8
.§ 0.6
e-
o .2 <I: 0.4 0.2 0a LO
~ ~ a ~ a a a ~
C\I
LO a C;; a '<t
Tedlar film on foam
a a a a a a a a a a a
a C') a a LO a a a LO 8 a
LO CD co ~ ~ ~ a ~ C;; a
C\I '<t LO
Freq. (Hz)
Figure 6.8 Benchmark absorption test for Tedlar™ film on foam.
----+-Telarc Reg. Room
-*-Onginal Room
--I:r-Refurbished
Room
The benchmark tests show very good comparison between the University of Canterbury, Department of Mechanical Engineering's Reverberation Room and the Te1arc registered Room. The test on Tedlar™, Figure 6.8, shows a very similar trend in absorption with approximately 10-15% difference between the results. For the most part the differences were less than 1 0%.
:g
o
u 1.2
0.8
.§ 0.6
e-
o.2
<I: 0.4
0.2
0
a ~
~ a ~ a a a LO LO C;; C\I C\I
Bonded foil on foam (foam up)
a a a a a a 8 a a
a a C') a a LO a a
'<t LO CD co ~ ~ ~ a ~
C\I
Freq (Hz)
~ a a a a C;; a '<t a LO
----+-Telarc Reg. Room
.... -iii ... Onginal Room
---6.--Refurbished
Room
CH 2 Reverberation Room Calibration 29
The Bonded foil test, Figure 6.9, shows even closer results. The refurbished Room was at
worst 10% different from the registered laboratory but was generally less than 5% different.
The differences in results between the two laboratories will in part be due to different test
specimen conditions. The specimen were rolled up for transport between laboratories and
held some of this curvature in testing, Figure 6.10. The refurbished Room with diffusers gave
very similar results to the original Room over the whole frequency range and in both tests.
This gave a large amount of confidence in the absorption measurement procedures.
Figure 6.10 Effect of curvature on test specimen.
7. Conclusions
In conclusion, it is clear that the Reverberation Room has been successfully calibrated. Its
sound field diffusivity, reverberation and uniformity have been qualified and have improved
with the Room's refurbishment. Reverberation time and sound pressure variations indicated
poorer performance at lower frequencies but the benchmark tests showed good performance
References
ISO 354:1988, "Acoustics - Measurement of sound absorption in a reverberation room", ISO, International Organisation for Standardisation, Switzerland, 1988.
3
Absor
r
M
t
rl
III
Summary
Table of Contents
Table of Contents ... x
List of Figures ... xi
List of Tables ... xi
1. Introduction ... ~ ... , ... 32
1.1 Absorption ... 32
1.2 Parameters ... 32 2. Aims ... 32
3. Theory ... 33
3.1 Flow resistance ... 33 4. Equipment ... it • • • • • • • • • • • • • • • • • • • • • • • • • • • • • • • • • • • • 33
4.1 Materials ... 33
4.2 Flow resistance Test Rig ... 34
4.3 Annubar calibration ... 36
5. Procedure ... 36
5.1 Annubar calibration ... 36
5.2 Flow resistance tests ... : ... 37
6. Results and Discussion ... 37
6.1 Calibration ... 37
6.2 Fabrics ... 39
6.3 Bulk materials ... 40
7. Conclusions ... 42
References ... 43
CH 3 Absorber Materials xi
list of Figures
Page Figure 4.1 Zoomed view of crushed CMSG, (a); polyester board, (b); and fibreglass, (c). ""'"'''''''''''''''''''''''''' 34
Figure 4.2 Flow resistance Test Rig, (a); enlargement of pipe section, (b); enlargement of annubar, (c) ... 35
Figure 4.3 Annubar calibration ... 36
Figure 6.1 Fabric flow resistance ... " ... 39
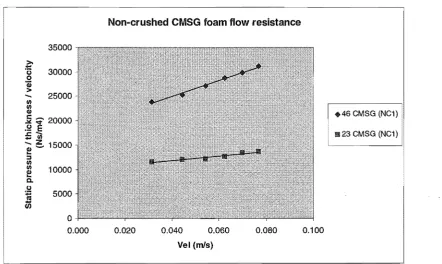
Figure 6.2 Flow resistance of23 mm and 46 mm CMSG ... " ... 40
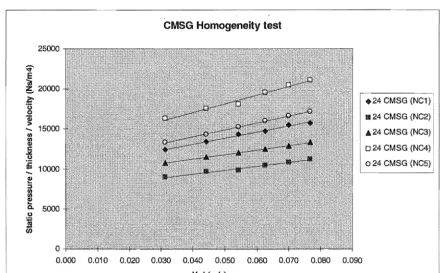
Figure 6.3 Homogeneity test. ... 41
list of Tables
Table No.
1. Introduction
1.1 Absorption
Porous materials, such as glass wools, foams and fabrics are commonly used to absorb sound. Typical examples of these materials include carpet, curtains and thermal insulation. They typically consist of a network of interlocking pores that convert incident sound energy into heat. Fibreglass has frequently been used for its absorption qualities. Recently, its adverse health effects have prompted a move toward other materials such as polyurethane foams, fibrous polyester boards and woollen blankets. Fibreglass can be encapsulated but this generally reduces its sound absorption. An acoustic material's worth depends not only on its absorption but also on its fire resistance, cost and health risk. Much research has been carried out on fibreglass based absorbers and their combination with perforated fibreboard. This study focused on polyurethane foams, and to a lesser extent polyester boards, in combination with impervious films and fabrics.
1.2 Parameters
An acoustic material can be described by many parameters based on its physical properties. Density and thickness are two very basic but critical parameters used to describe these materials. More specialist acoustic parameters include porosity, flow resistance and stiffness. Of these, the flow resistance is considered the most characteristic of a porous material's acoustic absorption. It is also critical to the theoretical modelling of porous materials. Hence, apparatus was built to measure the flow resistance of porous materials such as foams and fabrics.
2. Aims
The aims of the Materials study were to:
1. Establish important materials for use as absorbers (covered some-what in the Absorber Survey).
2. Investigate novel combinations of materials as absorbers.
CH 3 Absorber Materials 33
3. Theory
3. 1 Flow resistance
The steady flow resistance of a porous layer is defined as the ratio of static pressure drop across the layer to mean velocity of flow through the layer. It is usually implied that the velocity is low enough so that the pressure drop is proportional to the velocity. Flow resistance is usually quoted in mks rayls (or Ns/m3). Flow resistivity is quoted in mks rayls per metre (or Ns/m4). Porous materials typically have a flow resistivity of 20,000 mks rayls/m.
At a microscopic scale, the flow resistance is determined by the equivalent width between fibres or pores and the number of these per unit area. In oscillatory flow, as is the case for sound waves, the pressure drop contains a component proportional to the velocity and also a component proportional to the acceleration. This second component becomes apparent in flow resistance measurements at higher velocities.
4. Equipment
4.1 Materials
4.1 .1 Fabrics
The three main fabrics used were Hessian, Charade and Spotlight. These fabrics were chosen more for their aesthetic value than acoustic characteristics. However, it will be shown in the Absorption Testing chapter that these fabrics can significantly improve the performance of bulk porous layers such as foams or fibrous boards. Other fabrics, named Fabric A, Band C, were used for comparing the Test Rig to another flow resistance apparatus.
The Hessian fabric was a rather open weave material with a surface density of 275 g/m2. Charade was made of 100% polypropylene. Spotlight consisted of 92.5% wool and 7.5% viscose, with a surface density of 265 g/m2.
4.1.2 Bulk materials
and is loaded with melamine, Figure 4.1 (a). CMSG typically has 36-38 cells / 25 mm and a
density of 43 kg/m3. CMSG(c) refers to crushed CMSG foam. This foam had been run
through nip-rollers to reduce the amount of closed cells. Otherwise it was exactly the same as
standard CMSG foam.
The polyester board comprised many polyester fibres of varying density, Figure 4.1 (b). An
average fibre density has been taken as 1380 kg/m3. The board had a standard density of 80
kg/m3.
The fibreglass board was tightly packed with a density of 90 kg/m3, Figure 4.1 (c). The fibre
density was taken as 2600 kg/m3. Fibreglass board was included as it has been used
extensively as a thefillal insulator and acoustic absorber. It has been the object of indepth study but can pose a health problem when fibres are inhaled or touched. Hence it was used to
compare against the other bulk materials mentioned above.
..
".
;.'...
'\-
~- 11..,...,.
~-" ..
,
..
'~~1','f -, .\ .':\
"
.
~ " ~4ft 1-', ~'(' ,
.
..
...
.
.
t) ....
,
.'
'.
1:' ,'.
~"'..
-.
.
.... 1.~ ~, ."~'. . .'.'
...
.~
... '.
w,.
"'1('
'
-;t" ~\
r·
•---to .,; t. -'1 :
.
.
~.
.
,
~ ,-
~. I~', .~•.
,
..
-a,)
'...
... ,r, "
..
-.:.'~rt
-
.....'
,"
..
.
-..
...
.'.-...
.
...
~ I,
. N)
• ,
.
''- l•
'"
.~ . t ...(a) (b) (c)
Figure 4.1 Zoomed view of (a) crushed CMSG, (b) polyester board, and (c) flbreglass.
4.1.3 Films
The impervious films used were made from Mylar™, Bonded foil and PVc. Mylar™ is a thin
metallised polyester film. A range of film thicknesses and corresponding surface densities
were used, Bonded foil is made of 7~ aluminium foil backed by a high density
polyethylene mesh. It was 120 ~ thick with a surface density of 70 g/m2. The PVC film
was a relatively thick and heavy material. It had a surface density of 1000 g/m2. The films used had a range of surface densities, 35 g/m2, 140 g/m2 and 1000 g/m2; covenng
approximately two orders of magnitude.
4.2 Flow resistance Test Rig
The Test Rig was built in the Department of Mechanical Engineering, University of
CH 3 Absorber Materials 35
thickness of 5 mm. Two pressure taps, ninety degrees apart, were placed 100 mm from the
open end. The pressures from these two pressure taps were combined to give the average
static pressure inside the tube. A steel cone was used, as shown in Figure 4.2 (a, b), to
increase the diameter from the annubar to the plastic tube. Two wire mesh screens, located at
each end of the steel cone, were used as turbulence generators.
Manometers
Steel cone
Clear plastic tube
Foam sample
(b)
Annubar
Flow regulators
(a)
(c)
Figure 4.2 (a) Flow resistance Test Rig, (b) enlargement of pipe section, (c) enlargement
ofannubar.
4.2.1 Annubar DNT -10, %" SCH40, CB.
The annubar is a primary flow sensor designed to produce a differential pressure that is
proportional to flow. The V2" model used had an internal diameter of 15 nun.
4.2.2 Manometers
Two water manometers were used in the flow resistance Test Rig. One was a Betz
manometer, model AVA, serial number 610132. This one was used to measure the static
pressure drop across each sample. The second manometer, "Aerolab 38" - No. 4948, was