A study into the predictability of business
process models
Submitted August 2019, in fulfilment of
the conditions for the degree of BSc Industrial Engineering & Management.
Frits Sieds Tuininga
s1739409
Supervised by A. Abhishta, S. Kaya & L.O. Meertens
Department of Behavioural, Management & Social Sciences University of Twente
Acknowledgements
Throughout the writing of this bachelor Thesis, I have received support and assistance from numerous people. Firstly, I would like to express my gratitude towards my super-visors, MSc A. Abhishta, Dr. L.O. Meertens and MSc S. Kaya. Abhishta acted as my first UT supervisor and provided valuable insights regarding both the construction this Thesis and the machine learning analysis. Meertens acted as my second UT supervisor and provided very detailed feedback regarding this Thesis. Moreover, Meertens made it possible to access all on-ramp related dataflows from the eMagiz platform. These were of vital importance for this research. Kaya ensured the research followed the right direction, not only regarding the Thesis, but also regarding the prototype. Moreover, Kaya set up a series of important meetings with eMagiz users and developers. The support of these three supervisors was essential for the creation of this Thesis.
During this study a number of fellow students were essential for the creation of this Thesis. Hence, I would like to thank M. Blume, N. Bussmann, W. Klaassen, B. van Tintelen and A. van Vlastuin. Blume provided valuable feedback regarding this Thesis. Bussmann gave insights regarding the use of machine learning algorithms. The translation of dataflows into a table which is suitable for machine learning was established through discussions with both Klaassen and van Vlastuin. Furthermore, both were involved in the creation of this report. Van Tintelen assisted with the understanding and application of machine learning.
From my CAPE Groep colleagues, I would like to thank A. van Brakel and A. Willemsen. Van Brakel created a demo of the assistance tool in action. In the beginning, the assistance tool could not be implemented. Therefore, a demo could demonstrate the inner-workings and appearance of the final product. Willemsen provided the first example dataflow and explained how it worked.
I would like to express my gratitude towards my parents Y. and A. Tuininga. Both have provided valuable feedback on the Thesis. Lastly, I want to thank my dog Koda for her moral support and overall enthusiasm.
In the modern business world, communication between distinct business units is in general achieved by the means of multiple computer systems. In some cases, these systems cannot communicate directly. Hence, an additional program must be added to make communi-cation possible. Typically, the construction of this program can take quite some time. eMagiz is a company which creates such programs by the means of a model-driven plat-form (which is also called eMagiz). This research explores the opportunities of reducing time spent on creating such a program in eMagiz.
To reduce time spent on creating programs in a model-driven platform, an assistance tool is created. This assistance tool helps a user to create programs more effectively and efficiently. The assistance tool is based on a thorough machine learning analysis, which is described in detail within this report. During this study the following research question is answered: How can user actions in a model-driven platform be predicted, with machine learning, to increase modelling speed with the help of an assistance tool?. This question is answered in two phases.
Firstly, the available data (derived from the model-driven platform) is converted into a format which machine learning algorithms can understand.
Secondly, ten machine learning algorithms are tested on the available data. The algo-rithms are compared and the algorithm that makes the best predictions is used as basis for the assistance tool.
The study found that, given the eMagiz data set, the machine learning algorithm Ran-dom Forest performs best. For eMagiz, it is recommended to apply this algorithm to their model driven platform. In that case, the algorithm can act as assistance tool. Future research must show whether the tool does increase modelling speed. eMagiz man-agement has indicated to implement the assistance tool as soon as possible. In addition, if the assistance tool does increase modelling speed, then it could be applicable for other model-driven platforms as well. This makes it applicable not only for eMagiz, but for all corporations that use a model-driven platforms and wish to increase modelling speed. Future research must show whether this hypothesis holds true.
Reader’s Guide
The research described in this report was conducted in fulfilment of the degree of BSc In-dustrial, Engineering and Management. This report is divided into five distinct chapters. These chapters are introduced below:
Chapter 1 introduces the reader to the research. Here, the involved parties, overall problem and the structure of the report are elaborated upon. In addition, the current situation and the opportunities for improvement are discussed. Lastly, the general aim and measurability of the research are described.
Chapter 2 explains which literature from the scientific body of knowledge was applied within this research. This chapter provides the reader with essential knowledge required for the research approach. In addition, a substantiation is given of the choices made.
Chapter 3 outlines the research approach in two distinct phases. The first phase elab-orates on the manner in which data is converted. The second phase shows how machine learning algorithms are compared.
Chapter 4 describes the results of the research conducted. Moreover, the appearance of the prototype is explained.
Chapter 5 provides the reader with the recommendations and conclusions of this re-search. In addition, the opportunities of future research are explored in the section dis-cussion.
Acknowledgements i
Executive Summary ii
Reader’s Guide iii
1 Introduction 1
1.1 Research Aim . . . 1
1.2 Context . . . 1
1.2.1 CAPE Groep . . . 1
1.2.2 eMagiz . . . 2
1.2.3 Stakeholders . . . 2
1.2.4 Current Situation . . . 2
1.2.5 Problem Identification . . . 4
1.3 Scope & Limitations . . . 6
1.4 Research Question . . . 7
1.5 Methodological Framework . . . 7
1.6 Structure of the Thesis . . . 7
2 Theoretical Framework 10 2.1 Brief Summary . . . 10
2.2 Data Analysis . . . 10
2.3 Types of Machine Learning . . . 11
2.4 Applied Machine Learning Algorithms . . . 13
CONTENTS v
2.5.1 Train and Test Sets . . . 14
2.5.2 K-fold Cross-Validation . . . 15
2.5.3 Balance score . . . 16
2.6 ROC Curve . . . 18
3 Design & Development 20 3.1 Brief Summary . . . 20
3.2 Data Conversion . . . 20
3.2.1 Summary Data Conversion . . . 20
3.2.2 XML Conversion . . . 20
3.2.3 Routes . . . 21
3.2.4 Exclusion . . . 22
3.2.5 Tables . . . 23
3.3 Comparing Algorithms . . . 24
3.3.1 Summary Comparing Algorithms . . . 24
3.3.2 Accuracy Scores . . . 24
3.3.3 F-scores . . . 25
3.3.4 Number of Suggestions . . . 25
3.4 ROC Curve Application . . . 26
4 Implementation & Demonstration 27 4.1 Brief Summary . . . 27
4.2 Results . . . 27
4.2.1 One Prediction . . . 27
4.2.2 Impact Number of Suggestions . . . 28
4.2.3 Five Predictions . . . 29
4.2.4 ROC Curve . . . 30
4.3 Design of the Prototype . . . 31
5.2 Recommendations . . . 33
5.2.1 Application . . . 33
5.2.2 Continuous Improvement . . . 33
5.2.3 Applicability to Other eMagiz Components . . . 34
5.2.4 Another Point of Improvement . . . 34
5.3 Discussion . . . 34
5.3.1 Measuring Impact . . . 34
5.3.2 Broader Application . . . 34
5.3.3 Choice of Algorithms . . . 35
5.3.4 Usage of Input Data Sets . . . 35
5.4 Conclusions . . . 35
5.4.1 Answering the Research Question . . . 35
5.4.2 Advantage Routes . . . 36
5.4.3 Advantage Rule Based Learning . . . 36
5.4.4 ROC curve . . . 36
5.4.5 Number of suggestions . . . 36
Bibliography 37
References 38
Appendices 39
A The eMagiz platform 39
B Iris flower data set 41
C XML converter 42
List of Tables
2.1 Labelled data (Fisher’s Iris data set) . . . 12
2.2 Overview of Machine Learning Algorithms . . . 13
3.1 Example of Routes 1 . . . 22
3.2 Example of Routes 2 . . . 22
3.3 Overview of all routes . . . 23
3.4 Input data sets applied . . . 25
4.1 Results Comparison Phase . . . 28
4.2 Results Comparison Phase . . . 29
A.1 Comparison standard system and eMagiz bus . . . 40
1.1 eMagiz Bus . . . 2
1.2 eMagiz bus in detail . . . 3
1.3 Example dataflow . . . 3
1.4 eMagiz editor . . . 4
1.5 BPM Current Situation . . . 4
1.6 Problem Cluster . . . 5
1.7 Framework Design Science Research Methodology . . . 7
2.1 Overview Types Machine Learning . . . 11
2.2 Train and Test Set . . . 15
2.3 K-Fold cross validation (K = 10) . . . 16
2.4 Example Confusion Matrix . . . 16
2.5 Basic Confusion Matrix . . . 18
2.6 ROC Curve . . . 19
3.1 Example route . . . 21
3.2 Wrong assumption . . . 22
4.1 Random Forest ROC . . . 30
4.2 Design of the Prototype . . . 31
A.1 Two nodes with associations . . . 39
A.2 Multiple nodes with associations . . . 39
A.3 eMagiz bus with associations . . . 40
Chapter 1
Introduction
In this chapter, the reader is provided with the 1.1) Research Aim, 1.2) Context, 1.3) Scope & Limitations, 1.4) Research Question, 1.5) Methodological Framework and 1.6) Structure of the Thesis.
1.1
Research Aim
Over the years, computer systems became increasingly important in the business world. Typically within large companies, information is shared between multiple computer sys-tems. Sometimes these systems are able to communicate directly, but sometimes an extra translation step must be taken. From this perspective, computer systems are quite similar to humans. A Dutchman could, for instance, communicate flawlessly with another Dutch-man (direct communication), but when the DutchDutch-man tries to speak with a Japanese, the need for a translator arises (indirect communication). It is essential for businesses that internal computer systems are able to communicate fast without losing relevant informa-tion. Hence, the aim of this study is to make the ’translation process’ between different computer systems as efficient as possible.
1.2
Context
1.2.1
CAPE Groep
The client of this research is CAPE Groep(CAPE Groep, n.d.). This corporation is lo-cated in Enschede and is specialised in digital integration and low-code platforms. Digital integration refers to the ’translation process’ described earlier. If distinct computer sys-tems are able to communicate with the assistance of a ’translation process’, then these systems are digitally integrated.
A low code platform is software that provides an environment in which applications (or apps) can be created. As the name suggests, a low code platform does not require the
user to be well educated in programming. Instead, users that have little or no experience in programming can still develop apps.
1.2.2
eMagiz
CAPE Groep has constructed its own low-code platform, made with the sole purpose of digital integration. This platform is known as eMagiz (eMagiz, n.d.). As time went by, eMagiz became increasingly important. Large customers, such as the Royal BAM Groep, use eMagiz to integrate their internal systems. eMagiz grew so large that it was decided to make it a subsidiary of CAPE Groep. This research is concentrated on optimising one of the internal processes of eMagiz and applying the solution in broader context.
1.2.3
Stakeholders
For this research three distinct stakeholders are of importance: the eMagiz developer, eMagiz user and end-user. The eMagiz developer is responsible for the development and maintenance of the eMagiz platform. This person makes adjustments to the eMagiz plat-form based on feedback received from the customer. The developer assures that platplat-form is of the highest quality, which makes it more appealing for potential customers. Quality, in this sense of the word, refers to both high user-friendliness and high functionality. The eMagiz developer is an employee of the eMagiz corporation.
The second stakeholder is the eMagiz user. This person makes digital integrations within the eMagiz platform. The user wants to create digital integrations as fast as possible while keeping potential malfunctions to an absolute minimum. A series of companies use eMagiz and can hence be described as eMagiz users, but the most important eMagiz user is CAPE Groep.
The third stakeholder is the end-user. This person can be seen as a customer. The end-user outsources the digital integration process to the eMagiz user and requires a ready-made product. The wishes of the end-user are similar to the wishes of the eMagiz user. Both want to implement digital integrations as quickly as possible while keeping potential malfunctions to a minimum. The key difference is that the end-user purchases the product (digital integration) while the eMagiz user sells the product. In general, the end-user is another company.
1.2.4
Current Situation
[image:11.595.130.467.680.734.2]To integrate systems, eMagiz uses a concept known as a ’bus’. Via a bus, systems can be connected relatively easy (APPENDIX A). The bus can be seen as a translation program which makes communication possible between multiple systems.
1.2. Context 3
In Figure 1.1, the bus acts as translator between systems 1 and 2. The arrows represent the direction to which information is sent. Information flowing through the eMagiz bus is known as a ’message’ and shall be referred to as such further on in this report.
[image:12.595.128.471.219.309.2]In Figure 1.2, for two systems, the eMagiz bus is displayed in more detail. Within the eMagiz bus five components are displayed: entry connector, on-ramp, routing, off-ramp and exit connector. Each component performs an action on the message received. This implies that, if necessary, data could be removed or modified. Furthermore, the modified message is sent to the next component (or system). As one might observe, information can flow from system 1 to system 2 and vice versa. So, two ’information flows’ are displayed in this example.
Figure 1.2: eMagiz bus in detail
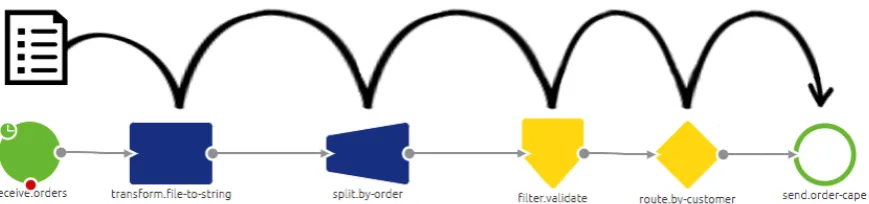
[image:12.595.81.516.465.567.2]Figure 1.2 does not cover all actions taken within the eMagiz bus. Actually, each compo-nent consists of a series of actions. The number of actions and the order in which actions are executed is determined by the eMagiz user. The eMagiz user accomplishes this by the means of a dataflow. A dataflow is a concatenation of actions (visualised in Figure 1.3). In this research, these actions are referred to as ’building blocks’.
Figure 1.3: Example dataflow
In Figure 1.3 a series of building blocks is shown. The building block on the far left (green circle) is referred to as a ’starting block’. Similarly, the building block on the far right (circle with green edge) is referred to as an ’ending block’. Consider the entry connector. If a message enters the entry connector, then it starts at the starting block. Next a series of actions are performed. Finally, the message reaches an ending block and leaves the entry connector. Similar actions take place in the remaining four components.
Figure 1.4: eMagiz editor
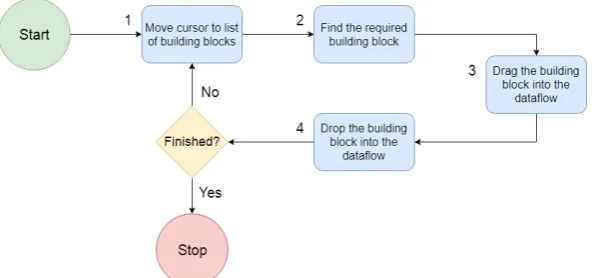
Within this list, a user can search for a specific block. Subsequently, the user drags and adds the building block to the dataflow. This process is repeated until the dataflow meets the expectations of the user. This process is shown in the form of a BPM (Business Process Model) in Figure 1.5.
Figure 1.5: BPM Current Situation
The start block (green) represents the start of the dataflow construction process. Similarly, the end block (red) represents the end of the dataflow construction process. The four blue blocks represent the actions required for constructing the dataflow. The diamond (yellow) represents a decision the eMagiz user must make. This diamond block represents the question: ’Is the dataflow finished of should other building blocks be inserted?’ If the dataflow is not finished, then the cycle continues, and the four actions should be performed again. If the dataflow is finished, then the process stops. To improve the process of constructing dataflows, both the number and duration of tasks could be reduced.
1.2.5
Problem Identification
[image:13.595.151.449.316.455.2]1.2. Context 5
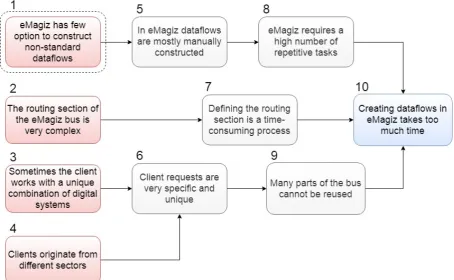
[image:14.595.71.526.149.429.2]to reduce the time spent on constructing dataflows by the means of automation. Logi-cally, if automation is implemented, then productivity of the eMagiz user improves. This idea should be investigated before implemented. Through a series of unstructured inter-views, a set of problems were identified. To obtain more insight in the causality between problems, a problem cluster was created from the relevant problems (Figure 1.6).
Figure 1.6: Problem Cluster
prevent too much dependence on one sector, eMagiz wishes to spread risk. As a result, problem 4 cannot be the core problem. This leaves problem 1. This problem can be influenced and reduces time spend on creating dataflows. Therefore, problem 1 is chosen as the core problem.
Another point of interest is the building blocks displayed to the eMagiz user during the dataflow construction process. As shown in Figure 1.4, a list filled with all different types of building blocks is displayed. It is, however, possible that a high number of blocks are never used within the on-ramp. These blocks could, for instance, be entry-connector related. If this is indeed the case, then building blocks which are not used could be relocated. This makes it easier for the eMagiz user to find the desired building block, because obsolete blocks are removed from the list. As a result, the time spent on constructing dataflows could decrease.
To solve the core problem an assistance tool can be implemented. This tool makes it easier for the eMagiz user to construct dataflows. Also, the modelling speed increases.
1.3
Scope & Limitations
This study focuses exclusively on the on-ramp component of the eMagiz bus. The justifi-cation for this is that not all five components can be automatised in the given time-span of a bachelor thesis. eMagiz created a large number of dataflows for its customers, which are made accessible for this research. As described earlier, the aim of this research is to create an assistance tool. This tool can only make valuable suggestions if these suggestions are based on a thorough analysis. This analysis gives the best results if patterns are visible in the data. From a discussion with the eMagiz competence center (eMagiz developers and users) it became clear that patterns are most visible in both the on-ramp and the off-ramp. Consequently, it does not matter on which component the focus lies. In the end, it was decided that the possibility of an assistance tool for the on-ramp is explored in further depth. Hence, the off-ramp component is excluded.
Machine learning algorithms are very suitable for analysing the data as provided by eMa-giz. An algorithm is a set of instructions to solve a certain problem. Machine learning implies that a computer teaches itself to recognise certain patterns in the data provided. From the recognised patterns, a computer can make valuable predictions. Hence, machine learning is used for analysing dataflows and acting as basis for the assistance tool.
1.4. Research Question 7
1.4
Research Question
Since machine learning is applied to solve the core problem, the research question is formulated as follows:
How can user actions in a model-driven platform be predicted, with machine learning, to increase modelling speed with the help of an assistance tool?
1.5
Methodological Framework
The methodological framework applied for this research is the Design Science Research Methodology (DSRM)(Peffers, 2007). This methodology is used to create ’things’. In this research, these ’things’ are referred to as prototypes. The idea behind the concept of prototypes is that it serves a human purpose and is hence more focused on creation rather than description.
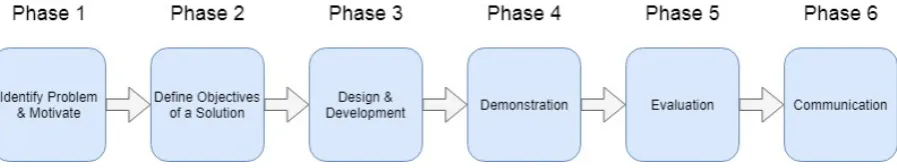
[image:16.595.75.524.376.460.2]The aim of this research is to create an assistance tool for eMagiz. This assistance tool acts as prototype. The overall aim of the assistance tool is to reduce the time spent on constructing dataflows. In other words, the assistance tool is an prototype that serves human purpose. Therefore, the DSRM is the most suitable methodological framework and is used as a guideline throughout this report. The DSRM consists of six phases. These phases are visualised in Figure 1.7.
Figure 1.7: Framework Design Science Research Methodology
The first and second phase are described in this chapter. Chapter 3 is dedicated to the third phase. Similarly, chapter 4 is dedicated to the fourth phase. The fifth phase and sixth phase are captured in chapter 5.
1.6
Structure of the Thesis
After identifying the core problem (section 1.2.5), the research concentrates on building and validating the assistance tool. In chapter 2 Theoretical Framework, the techniques required for building and validating the tool are elaborated upon. Chapter 3 Design & Development describes how the techniques from chapter 2 are applied. Moreover, it describes the problem approach. In chapter 4 Implementation & Development, the results of the research are displayed. In chapter 5 Recommendation & Conclusion, the recommendation, discussion and conclusion are described.
For Chapter 2 Theoretical Framework the following questions are answered:
(a) In general, what does machine learning imply according to literature?
(b) Which machine learning algorithms should be applied according to literature? (c) Which built-in Python library should be used according to literature?
(d) How, according to literature, can machine learning algorithms be compared and evaluated?
For Chapter 3 Design & Development, the focus lies on the research approach and proto-type development. In this chapter, the following questions are answered:
2. What is the research approach and how was the prototype developed? (a) What are the requirements of the desired prototype?
(b) Which type of management framework should be applied to the research ap-proach and design?
(c) Can the mechanisms of the prototype be visualised to make replication of the research possible?
(d) Which data is used? (e) How was the data used?
(f ) If applicable, which data should be excluded? (g) How is the effect of the prototype measured?
For Chapter 4 Implementation & Demonstration, the research is viewed as a process. The usage and effect of the prototype are discussed. Within this chapter, the following questions are answered:
3. How does the assistance tool work? (a) How does the assistance tool appear? (b) What input does the analysis tool require? (c) What output does the analysis tool produce?
4. What results do the machine learning algorithms generate? (a) What is the Ac score for each machine learning algorithm? (b) What is the Fs score for each machine learning algorithm? (c) What is the Dt score for each machine learning algorithm?
1.6. Structure of the Thesis 9
5. What are the recommendations and conclusions of the research? (a) What is the link between results and the conclusions?
(b) How are the recommendations and conclusions substantiated?
(c) For eMagiz, what unexpected points of improvement were encountered during the research?
6. What points of improvement does the research have? (a) In hindsight, was the research design correct?
(b) Could the time spend at constructing dataflows be reduced by other means? How effective would it be?
(c) Could the accuracy be positively influenced by aspects that were left out of ac-count?
Theoretical Framework
In this chapter, the techniques applied for both analysis and validation are discussed. Also, the decisions made are substantiated with literature. The following sections are discussed 1) Data Analysis, 2) Types of Machine Learning, 3) Applied Machine Learning Algorithms, 4) Validation and 5) ROC Curve. In the Data Analysis section, a substantia-tion is given in favour of a machine learning analysis. Furthermore, the different types of machine learning and the algorithms applied are discussed. The section validation elabo-rates on how the machine learning algorithms can be evaluated. Lastly, the section ROC Curve tends to optimise predictions made. All sections are substantiated with existing literature.
2.1
Brief Summary
For the eMagiz data set, supervised machine learning proved to be the most suitable type of machine learning. Therefore, ten supervised machine learning algorithms are chosen for the comparison phase (further explained in chapter 3 Design & Development). The techniques used to compare the algorithms are accuracy and F-score (Sokolova, 2006). In addition, K-fold cross-validation is applied to validate the algorithms. Lastly, the ROC Curve is implemented to determine a threshold that generates the most optimal results.
2.2
Data Analysis
The assistance tool must generate helpful and valuable suggestions. To achieve this, a thorough data analysis must be executed. For the assistance tool to generate the most helpful suggestions, it is essential to select the most suitable form of data analysis. Since suggestions are made based on existing patterns in the data, it would be ideal to implement a form of data analysis which includes pattern recognition. For this reason, machine learning appears to be the reasonable choice. ’There are several applications
2.3. Types of Machine Learning 11
for Machine Learning (ML), the most significant of which is data mining. People are often prone to making mistakes during analyses or, possibly, when trying to establish relationships between multiple features. This makes it difficult for them to find solutions to certain problems. Machine learning can often be successfully applied to these problems, improving the efficiency of systems and the designs of machines.’(Kotsiantis, 2007) For the reasons outlined, it was decided to apply machine learning analysis to the data provided.
2.3
Types of Machine Learning
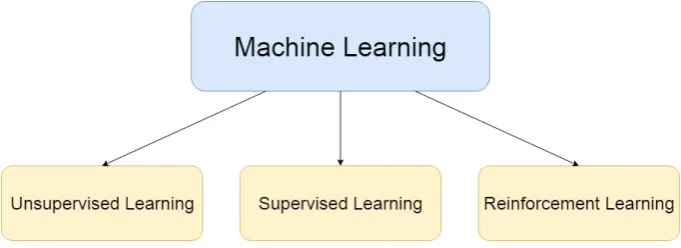
[image:20.595.127.468.264.388.2]In general, there are three types of machine learning: 1) unsupervised, 2) supervised and 3) reinforcement machine learning (Figure 2.1). To select the most appropriate type, the concepts of labelled and unlabelled data must be introduced.
Figure 2.1: Overview Types Machine Learning
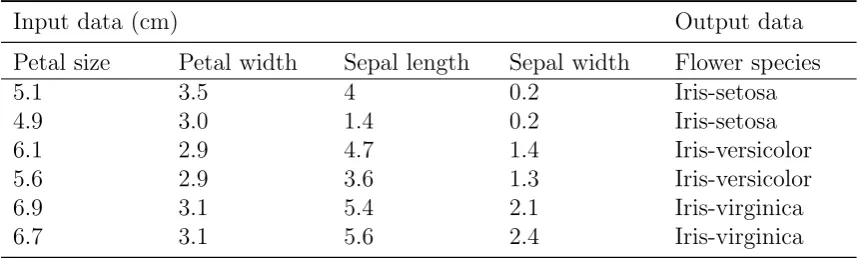
Labelled data implies that the used data set contains both input and (correct) output data(Kotsiantis, 2007). An example of labelled data is given in Table 2.1. In here, a small sample of the famous Iris flower data set(Fisher, 1936) is displayed. A machine learning algorithm can use the input data (Petal size, Petal width, Sepal length and Sepal width) and make predictions based on that. Predictions, in this case, refer to Flower species. For instance, a machine learning algorithm reads that the Petal size, Petal width, Sepal length and Sepal width are 4.9cm, 3.0cm, 1.4cm and 0.2cm respectively. Given this input data, the algorithm predicts that the Flower species is the Iris-setosa. Furthermore, the algorithm can check whether the prediction made was correct and adjust its prediction strategy accordingly. In other words, the machine learns from experience! For more information about the Iris flower data set and its role in within machine learning, please see APPENDIX B.
an environment. This makes supervised learning the most suitable machine learning type to apply to the eMagiz data set.
Input data (cm) Output data
Petal size Petal width Sepal length Sepal width Flower species
5.1 3.5 4 0.2 Iris-setosa
4.9 3.0 1.4 0.2 Iris-setosa
6.1 2.9 4.7 1.4 Iris-versicolor
5.6 2.9 3.6 1.3 Iris-versicolor
6.9 3.1 5.4 2.1 Iris-virginica
[image:21.595.83.514.100.229.2]6.7 3.1 5.6 2.4 Iris-virginica
2.4. Applied Machine Learning Algorithms 13
2.4
Applied Machine Learning Algorithms
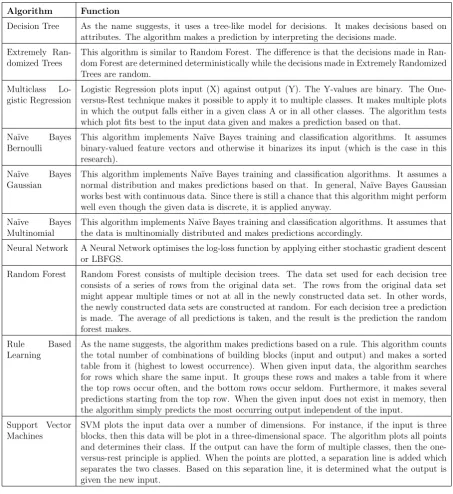
Supervised machine learning is an umbrella term for a series of machine learning algo-rithms. Kotsiantis, in his paper Supervised Machine Learning: A Review of Classification Techniques, described the most effective supervised machine learning algorithms(Kotsiantis, 2007). Kotsiantis categorised these algorithms into six types: 1) Decision Tree, 2) Neu-ral Networks, 3) Na¨ıve Bayes, 4) k-Nearest Neighbors, 5) Support Vector Machines and 6) Rule based learners. K-Nearest Neighbors has a high intolerance to noise. Hence, k-Nearest Neighbor was left out of account. From the remaining categories, the following machine learning algorithms were used to analyse the eMagiz data set:
Algorithm Function
Decision Tree As the name suggests, it uses a tree-like model for decisions. It makes decisions based on attributes. The algorithm makes a prediction by interpreting the decisions made.
Extremely Ran-domized Trees
This algorithm is similar to Random Forest. The difference is that the decisions made in Ran-dom Forest are determined deterministically while the decisions made in Extremely RanRan-domized Trees are random.
Multiclass Lo-gistic Regression
Logistic Regression plots input (X) against output (Y). The Y-values are binary. The One-versus-Rest technique makes it possible to apply it to multiple classes. It makes multiple plots in which the output falls either in a given class A or in all other classes. The algorithm tests which plot fits best to the input data given and makes a prediction based on that.
Na¨ıve Bayes Bernoulli
This algorithm implements Na¨ıve Bayes training and classification algorithms. It assumes binary-valued feature vectors and otherwise it binarizes its input (which is the case in this research).
Na¨ıve Bayes Gaussian
This algorithm implements Na¨ıve Bayes training and classification algorithms. It assumes a normal distribution and makes predictions based on that. In general, Na¨ıve Bayes Gaussian works best with continuous data. Since there is still a chance that this algorithm might perform well even though the given data is discrete, it is applied anyway.
Na¨ıve Bayes Multinomial
This algorithm implements Na¨ıve Bayes training and classification algorithms. It assumes that the data is multinomially distributed and makes predictions accordingly.
Neural Network A Neural Network optimises the log-loss function by applying either stochastic gradient descent or LBFGS.
Random Forest Random Forest consists of multiple decision trees. The data set used for each decision tree consists of a series of rows from the original data set. The rows from the original data set might appear multiple times or not at all in the newly constructed data set. In other words, the newly constructed data sets are constructed at random. For each decision tree a prediction is made. The average of all predictions is taken, and the result is the prediction the random forest makes.
Rule Based Learning
[image:22.595.72.526.209.704.2]As the name suggests, the algorithm makes predictions based on a rule. This algorithm counts the total number of combinations of building blocks (input and output) and makes a sorted table from it (highest to lowest occurrence). When given input data, the algorithm searches for rows which share the same input. It groups these rows and makes a table from it where the top rows occur often, and the bottom rows occur seldom. Furthermore, it makes several predictions starting from the top row. When the given input does not exist in memory, then the algorithm simply predicts the most occurring output independent of the input.
Support Vector Machines
SVM plots the input data over a number of dimensions. For instance, if the input is three blocks, then this data will be plot in a three-dimensional space. The algorithm plots all points and determines their class. If the output can have the form of multiple classes, then the one-versus-rest principle is applied. When the points are plotted, a separation line is added which separates the two classes. Based on this separation line, it is determined what the output is given the new input.
As mentioned in chapter 1Introduction, Rule Based Learning is not part of the Scikit-learn library. This algorithm is based on simple statistics. The data on which the algorithm is trained consists of input and output. For example, after the combination of building blocks A-B (input) comes block C (output). The Rule Based Learning algorithm counts the number of times a certain combination of input and output appears in the data set. For instance, the combination of building blocks A-B (input) and block C (output) appears twenty times in the data set. From the combinations and the number of occurrences the algorithm makes an ordered list (highest occurrences to lowest). Consequently, the algorithm makes predictions based on this ordered list. So, if the algorithm encounters the combination A-B, then it searches for this input in the list starting from the top. Once the combination is found the algorithm gives the corresponding output (for example block C).
2.5
Validation
2.5.1
Train and Test Sets
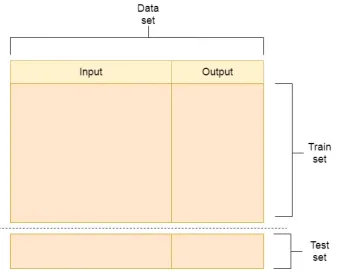
To evaluate the performance of the machine learning algorithms, the concepts train and test sets (Ordonez, 2006) are introduced (see Figure 2.2). The data set, as provided by eMagiz, must be split into a train and a test set. As the names suggest, a train set is used to train and a test set is used to test a machine learning algorithm. Training an algorithm implies that the algorithm tries to find patterns between the input and output data of the train set. To illustrate this, suppose a machine learning algorithm has been trained on the Iris flower data set (mentioned previously). The algorithm could have found the following pattern: if a flower has a Petal width that lies in the interval [4.5cm,5.3cm] and a Petal length that lies in the interval [3.0cm, 4.0cm], then the flower must be an Iris-setosa. The input data in the example are the Petal width and length, and the output data is the Flower species.
Once the algorithm has been trained, it is applied to the test set. From the train set, the machine learning algorithm has recognised a series of patterns. Given the input data of the test set and the patterns recognised in the train set, the algorithm predicts the output data of the test set. The predictions made could either be correct or incorrect. In addition, the number of correct predictions is divided by the number of total predictions. The outcome of this equation (equation 2.1) is called the accuracy(Kotsiantis, 2007) of the machine learning algorithm.
Accuracy
=
Number of Correct Predictions
2.5. Validation 15
Figure 2.2: Train and Test Set
A problem arises if the data in the data set is unevenly distributed. For example, take the Iris flower data set. Suppose the data set is split in a train and test set, and that all data regarding the Flower species Iris-virginica is only present in the test set. In that case, the machine learning algorithm cannot recognise patterns regarding the Iris-virginica (simply because it is not present in the train set). Hence, the trained algorithm has a low accuracy. To prevent this, the data set is shuffled at random before it is split in a train and test set.
2.5.2
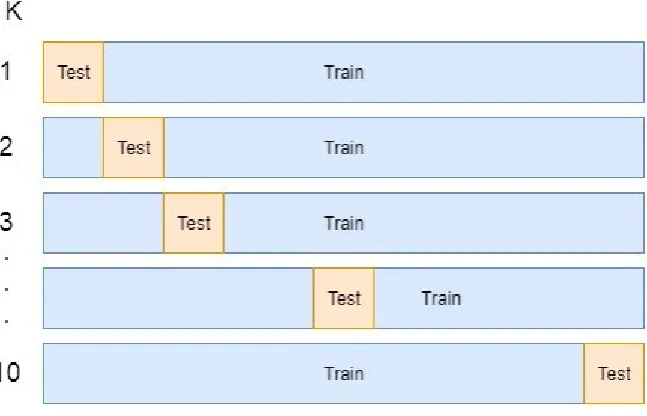
K-fold Cross-Validation
Figure 2.3: K-Fold cross validation (K = 10)
2.5.3
Balance score
It will not suffice to solely optimise (the assistance tool’s) accuracy. A high accuracy does not necessarily imply a good assistance tool. Presume that there are two situations: situ-ation A and situsitu-ation B. Situsitu-ation A occurs frequently, while situsitu-ation B occurs seldom. Given situation A, the assistance tool always makes correct predictions. For situation B, it is the exact opposite: the assistance tool always makes incorrect predictions. Since situation B occurs significantly less than situation A, the accuracy of the assistance tool is quite high. The balance, however, is very poor. The balance is a percentage that displays to which extend the accuracy scores of each situation differ. If there is no difference in accuracy scores, then the balance is 100%. To measure the balance, the F-score can be applied. To understand the F-score, one must first understand the concepts of a confusion matrix, precision and recall. The confusion matrix provides an overview of all predictions made by the assistance tool. In Figure 2.4, an example of a confusion matrix is displayed.
Figure 2.4: Example Confusion Matrix
[image:25.595.135.469.523.680.2]2.5. Validation 17
a machine learning algorithm tries to predict a situation A, B or C (see Figure 2.4). The column on the far left represents the predictions made by the machine learning algorithm. The top row represents the actual outcome (reality). From Figure 2.4 it can be deduced that situation A was correctly predicted 13 times, situation B was correctly predicted 16 times, etc. As one might observe, 5 times situation A was predicted while in reality the answer was situation B. Similarly, 2 times situation B was predicted while the actual answer was situation A.
For Figure 2.4, three recall and precision scores can be calculated. The first recall score refers to situation A regarding reality. Here, the number of correct predictions (13 times) is divided by the total number of predictions made in that column. The total number of predictions made is: 13 + 2 + 3 = 18. So, the first recall score is: 13/18≈0.722. Likewise, the second recall score is: 0.762 and the third: 0.833. The calculation of the precision score works similarly. The first precision score refers to situation A regarding predictions. The number of correct predictions is divided by the total number of predictions in that row. So, the first precision score is: 13/(13 + 5 + 7) = 0.52. The second and the third precision score are respectively: 0.842 and 0.930. In conclusion, precision is the probability that situation X is correctly predicted in comparison to all cases that situation X is predicted. Recall is the probability that the situation X is correctly predicted in comparison to all cases where the reality is situation X. In other words, precision measures from the perspective of predictions and recall from the perspective of reality. From the recall and precision scores, the F-score can be determined as follows:
F-score = 2
∗
Recall
∗
Precision
Recall + Precision
(2.2)
2.6
ROC Curve
Figure 2.5: Basic Confusion Matrix
In Figure 2.5, a typical example of a confusion matrix is given. In here, there are only two possible states: 1 and 0. If a machine learning algorithm predicts the future state to be 1 and the future state is indeed 1, then the prediction falls in the category of True Positive. In the ideal state the number of True Positive and/or True Negative predictions must be greater than zero, whereas the number False Positive and False Negative predictions must be equal to zero. Normally, this situation cannot be reached. Therefore, the True Positive Rate (TPR) was created to keep track of the number of True Positives in relation to the number of False Negatives. In addition, the False Positive Rate (FPR) was created to keep track of the number of False Positives in relation to the number of True Negatives. The TPR must be maximised while the FPR must be minimised. The equations below show how the TPR and FPR are calculated.
True Positive Rate = TP
TP + FN (2.3)
False Positive Rate = FP
FP + TN (2.4)
2.6. ROC Curve 19
[image:28.595.140.465.222.480.2]serious illness than it is to wrongly predict that a patient does not have a serious illness. In other words, the TPR is of vital importance and the FPR is of less importance. To influence the TPR and FPR a decision could be made. For example, if a machine learning algorithm is for 60% sure that a patient is not ill, then you could tell the algorithm to still classify this patient as ill. In other words, being 60% sure that a patient is not ill is too low. The hospital might say that the algorithm must be at least 90% sure before classifying a patient as not ill. This 90% is called a threshold. By adjusting the threshold, the TPR (2.3) and FPR (2.4) change. So, one could plot the results of the TPR and FPR by adjusting the threshold step by step. The curve that appears is called the ROC Curve (James, 1982).
Figure 2.6: ROC Curve
Design & Development
In this chapter, the research approach is sketched. The following three sections are ad-dressed: 1) Data Conversion, 2) Comparing Algorithms and 3) ROC Curve. For both Data Conversion and Comparing Algorithms a brief summary is given.
3.1
Brief Summary
The aim of this research is to create an assistance tool to reduce time spent on constructing dataflows. To achieve this, two phases must be completed: 1) Data Conversion and 2) Comparing Algorithms. The data provided by eMagiz is not suitable for machine learning. Therefore, the data format is changed. Next, ten machine learning algorithms are compared on accuracy and F-score (chapter 2 Theoretical Framework). The best algorithm could act as basis for the assistance tool. This tool could then added to the eMagiz platform.
3.2
Data Conversion
3.2.1
Summary Data Conversion
The data provided by eMagiz is in XML-format (subsection 3.2.2). This file format is unsuitable for machine learning. Therefore, the file format is altered. First, the dataflows are translated into routes (subsection 3.2.3). Undesired routes are removed (subsection 3.2.4) and after some alterations added to a table (subsection 3.2.5). This table (or dataset) can be used as input for machine learning.
3.2.2
XML Conversion
For this research, eMagiz provided dataflows in XML-format (on-ramp related). XML stands for eXtensive Markup Language. It contains information which is both readable
3.2. Data Conversion 21
for humans and machines. It is, however, not suitable for machine learning. Therefore, this file format must be altered. For a computer, XML documents are accessible by applying a technique called parsing. Parsing enables a computer program to access the data very fast while understanding the underlying structure. In the case of dataflows, this implies that the computer understands which building blocks are connected.
[image:30.595.125.463.302.406.2]From the XML-files, a series of routes could be obtained. An example of a route is given in Figure 3.1. Circled in red, a route is shown consisting of the following building blocks: 1) jms-message-driven-channel-adapter, 2) standard-transformer, 3) X-path-splitter, 4) standard-validating-filter, 5) X-path-router and 6) jms-outbound-channel-adapter. As one could imagine, multiple routes can be found in the same dataflow. Further on, these routes are used for machine learning. The code for the XMLconverter program is shown in APPENDIX C.
Figure 3.1: Example route
3.2.3
Routes
1st Block 2nd Block 3rd Block 4th Block 5th Block 6th Block inbound transformer splitter filter router outbound inbound transformer splitter filter router outbound inbound transformer splitter filter router outbound inbound transformer splitter filter outbound
[image:31.595.77.523.58.142.2]-Table 3.1: Example of Routes 1
Figure 3.2: Wrong assumption
To solve this issue, the series of blocks prior to a validating-filter or a router are removed, with the exception of one route (Table 3.2). If this data is now used as input for a machine learning algorithm, then the algorithm observes that an X-path-splitter is followed by a standard-validating-filter only once. The data becomes more reliable. Therefore, poor accuracy and balance scores, as a result of ill-defined input data, is avoided.
1st Block 2nd Block 3rd Block 4th Block 5th Block 6th Block inbound transformer splitter filter router outbound
- - - - router outbound
- - - - router outbound
- - - filter outbound
-Table 3.2: Example of Routes 2
3.2.4
Exclusion
[image:31.595.128.465.200.372.2] [image:31.595.75.522.497.582.2]3.2. Data Conversion 23
Within the eMagiz data set, there exist a couple of unfinished dataflows. This means that a dataflow does not have a starting point (for example inbound-channel-adapter) and/or an ending point (for example outbound-channel-adapter). Also, the probability that the dataflow was wrongly constructed is very real. Therefore, these types of dataflows are excluded.
For Example and Training dataflows, a similar problem occurs. Since these dataflows were constructed with the sole purpose of pointing something out, they might be wrongly constructed or appear in a unique and unrepresentative manner. Hence, these types of dataflows were also excluded.
3.2.5
Tables
[image:32.595.73.523.319.522.2]All remaining dataflows were written out in table form (as shown in Table 3.3). NaN simply means ’Not a Number’. In other words, NaN-values represent empty cells. In the Table, each row represents a route. For the sake of overview, the last two rows of the Table show that the Table continues until row n is reached.
Table 3.3: Overview of all routes
The assistance tool tries to predict the next building block based on a series of previous blocks. This series of blocks can be quite large. In fact, the larger the route, the smaller the number of occurrences. For instance, one route has a length of 14 blocks. It does, however, only occur once in the entire data set. This means that if all routes with length 14 are extracted from the data set and used as input for a machine learning algorithm, then the the newly formed input data set has merely one row. Since machine learning algorithms require a large input data set, an input data set existing of only one row does simply not suffice. Therefore, as a rule of thumb, it was decided to only use data sets with at least one thousand rows. As it turns out, the maximum route length that generates a data set with at least one thousand rows, is seven.
set on three (two previous block, one block to predict). From Table 3.3 a series of input data sets are created, with a minimum and maximum column length of respectively three and seven.
Suppose an input data set of three columns is created. This is achieved in three simple steps. Firstly, a series of sub-data sets are constructed from Table 3.3: column 1 to 3 forms a sub-data set, column 2 to 4 forms a sub-data set, etc. Secondly, the rows with NaN values are removed from all sub-data sets. Thirdly, all sub-data sets are merged into one input data set with three columns. The same process is applied for the other input data sets with different route lengths.
3.3
Comparing Algorithms
3.3.1
Summary Comparing Algorithms
A Key Performance Indicator is a measurable variable which makes it possible to measure performance. For this research the KPI’s accuracy score (subsection 3.3.2) and F-score (subsection 3.3.3) are used to compare the ten machine learning algorithms. Furthermore, the impact of the number of suggestions made by the algorithms is discussed.
3.3.2
Accuracy Scores
In total ten machine learning algorithms are compared (Table 2.2). Since accuracy is most valuable for eMagiz, it was decided to concentrate on the accuracy score. The balance score is of less importance, but is also taken into account. The input data sets are as described previously. Within an input data set, the last column is used as Y-value (output) and the remaining columns are used as X value (input). In other words, the last column represents the block that must be predicted and the remaining columns represent the series of previous blocks.
3.3. Comparing Algorithms 25
input data set with six blocks. In total, the number of times an input data set is applied, is displayed in Table 3.4.
Input data set Applied
3 blocks 1005
4 blocks 827
5 blocks 788
6 blocks 745
7 blocks 1007
[image:34.595.171.424.112.226.2]Total 4372
Table 3.4: Input data sets applied
From Table 3.4, the weights of each accuracy score are determined. This is shown in the following equation:
Ac = 1005
4372 ∗ac1 + 827
4372 ∗ac2 + 788
4372 ∗ac3 + 745
4372 ∗ac4 + 1007
4372 ∗ac5 (3.1)
The Total accuracy score of each machine learning algorithm is used to compare the algorithms.
3.3.3
F-scores
The F-scores, for the machine learning algorithms, are calculated in a similar fashion to that of the accuracy scores. K-fold cross-validation is applied and the average of the F-scores is taken. The result is five F-scores for each of the corresponding input data set: f1, f2, f3, f4 and f5. The Fs score (Total F-score) is calculated by applying the same weights as was applied for the Ac score:
Fs = 1005
4372 ∗f1 + 827
4372 ∗f2 + 788
4372 ∗f3 + 745
4372 ∗f4 + 1007
4372 ∗f5 (3.2)
3.3.4
Number of Suggestions
3.4
ROC Curve Application
Chapter 4
Implementation & Demonstration
In this chapter, the 1) Results and 2) Design of the Prototype are discussed. The Results are the outcome of the research approach (chapter 3Design & Development). The Design of the Prototype describes how the assistance tool is implemented.
4.1
Brief Summary
The machine learning algorithms were allowed to give five suggestions in total. For the eMagiz data set the algorithm Random Forest performed best with an accuracy score of 95.70% and an F-score of 85.40%.
4.2
Results
4.2.1
One Prediction
If the machine learning algorithms are compared based on one suggestion, then the results are as described in Table 4.1.
Algorithm Ac (%) Fs (%)
Extremely Randomized Trees 76.66 81.83
Random Forest 76.60 79.97
Decision Tree 76.45 80.33
Rule Based Learning 74.65 81.07 Support Vector Machines 74.82 82.55
Neural Network 66.54 90.62
Multiclass Logistic Regression 53.15 78.98
Algorithm Ac (%) Fs (%) Na¨ıve Bayes Gaussian 41.35 64.03 Na¨ıve Bayes Bernoulli 33.46 82.85 Na¨ıve Bayes Multinomial 26.54 42.34
Table 4.1: Results Comparison Phase
4.2.2
Impact Number of Suggestions
The results of Table 4.1 are, however, sub-optimal. If the number of suggestions is in-creased, then the accuracy scores of all algorithms increase tremendously. The advantage of increasing the number of suggestions is that the assistance tool can make more ac-curate suggestions. This (significantly) reduces time spent on constructing dataflows! The results of an increase of suggestions on the accuracy score (of the best algorithm) is illustrated in the graph below.
1 2 3 4 5 6 7 8 9 10
76 78 80 82 84 86 88 90 92 94 96 98 100
Number of suggestionsn
Accuracy
score
(b
est
algorithm)
4.2. Results 29
management wishes to increase the number of suggestions until the increase in accuracy score is less than 1%. Starting from four suggestions, if the number of suggestions is increased to five, then the accuracy score increases with more than 1%. Starting from five suggestions, if the number of suggestions increased to six, then the accuracy score increases with less than 1%. Therefore, it is decided to compare machine learning algorithms based on five suggestions. The results can be found in Table 4.2.
4.2.3
Five Predictions
Algorithm Ac (%) Fs (%)
Random Forest 95.70 85.40
Support Vector Machines 95.42 86.23 Rule Based Learning 95.33 84.44 Extremely Randomized Trees 95.22 84.11
Decision Tree 93.78 82.37
Neural Network 90.97 77.93
[image:38.595.144.456.208.381.2]Multiclass Logistic Regression 89.35 72.60 Na¨ıve Bayes Gaussian 88.40 70.95 Na¨ıve Bayes Bernoulli 86.13 87.67 Na¨ıve Bayes Multinomial 62.60 45.63
Table 4.2: Results Comparison Phase
4.2.4
ROC Curve
[image:39.595.71.528.251.528.2]In Figure 4.1 the ROC curve of the Random Forest algorithm is shown. In the figure, it becomes clear that the best possible result is achieved at a True Positive rate of 0.68 and a False Positive Rate of 0.16. This point is shown in the figure as a red dot. In that situation the threshold is approximately 87.5%. This implies that if the Random Forest algorithm must be at least 87.5% sure that the five suggestions are correct. Similarly, if the algorithm is for less than 87.5% sure that the five suggestions are correct, then the algorithm should not make these suggestions but rather focus on alternatives. In comparison to not applying a threshold, however, a threshold of 87.5% increases the total number of False Positives and False Negatives. This implies that even though the combination of TPR and FPR is best at a threshold of 87.5% this does not mean the same for accuracy.
4.3. Design of the Prototype 31
4.3
Design of the Prototype
[image:40.595.71.526.153.381.2]The prototype is based on the Random Forest algorithm. If added to the on-ramp, then the prototype can appear in the form of Figure 4.2. The prototype could be opened by right clicking the last building block in the premature dataflow. This is displayed in Figure 4.2.
Figure 4.2: Design of the Prototype
Recommendation & Conclusion
The Random Forest algorithm performs best and can henceforward be used as basis for the assistance tool. In this chapter, the following sections are addressed: 1) Recommendation, 2) Discussion and 3) Conclusion. In Recommendation, eMagiz is provided with a series of recommendations regarding application, continuous improvement of the assistance tool and the exclusion of obsolete building blocks within the on-ramp. In the discussion, opportunities for future research are discussed. The results of chapter 4 Implementation & Development are used as substantiation for the conclusions drawn.
5.1
Brief Summary
For eMagiz there are four recommendations. Firstly, eMagiz should attach the Random Forest algorithm to the on-ramp. In that case, the algorithm acts as assistance tool and presumably reduces time spent on constructing dataflows. Secondly, it is advised to cre-ate a dynamic data set in which relevant data is added and irrelevant data is removed. Thirdly, it is recommended to explore whether the assistance tool should be attached to the entry-connector, off-ramp and exit-connector. Fourthly, it is recommended to filter out all irrelevant building blocks in the five components of the eMagiz platform.
For the discussion, there are four points of interest. Firstly, if the assistance tool is imple-mented, then the impact of the tool should be measured by the means of an experiment. This experiment is outlined in section Measuring Impact. Secondly, the assistance tool can be applied in broader context. This implies that the tool can be of use for other model driven platforms. Thirdly, for the comparison phase new and more suitable algorithms could be added. Fourthly, the usage of the input data sets might be improved.
The conclusion of the research is that user actions in a model driven platform can be predicted by the means of machine learning (and even statistics). For data conversion phase, the concept of routes (chapter 3 Design & Development) was very helpful in con-verting the data into a suitable format. For the comparison phase, statistics (Rule Based Learning) outperformed most of the machine learning algorithms. Therefore, statistics has proven to be a a powerful tool to predict user actions in a model driven platform.
5.2. Recommendations 33
Lastly, for the assistance tool a threshold must not be implemented as this will decreases accuracy.
5.2
Recommendations
5.2.1
Application
It is recommended to attach the Random Forest algorithm to eMagiz, which in that case functions as an assistance tool. The accuracy and F-scores of the Random Forest algorithm where quite high. Hence, there is reason to believe that if the algorithm is attached to eMagiz as assistance tool, then it will reduce time spent on constructing dataflows. What the impact of the assistance tool is on construction speed must be measured. This measuring process is described in the Discussion, section Measuring Impact.
5.2.2
Continuous Improvement
The assistance tool makes predictions based on the on-ramp data set (as provided by eMagiz). At this moment, this data set is static (it does not change). It would, however, be beneficial for eMagiz if the data set is dynamic. In that case, the assistance tool adjusts to the newly created dataflows, making it future-proof.
New data is generated each time a new dataflow is constructed. If this data is consistently added to the data set, then the data set becomes dynamic. Before this idea is implemented, however, a series of potential pitfalls must be discussed.
Firstly, not all new data should be added to the data set. Erroneous dataflows negatively influence the assistance tool. Hence, it is recommended to let a group of dataflow experts decide which dataflows should and should not be added to the data set. The evaluation of the available data can take place periodically (weekly or monthly). If the data set is updated, then the machine learning comparison program must be executed again. The reason for this is that, if the data set was updated, a new more suitable algorithm could be found.
5.2.3
Applicability to Other eMagiz Components
As stated in chapter 1Introduction, this research was concentrated on the on-ramp section of eMagiz. The off-ramp, however, was also very suitable for the assistance tool. During the research multiple eMagiz users explained that the assistance tool could also be applied to entry- and exit-connectors. This in contrast to statements made earlier regarding the uniqueness of the entry- and exit-connector. This leaves room for future research regarding the implementation of the assistance tool in the entry-connector, off-ramp and exit-connector. It is recommended to test the applicability of the assistance tool and comparison program on these components of eMagiz.
5.2.4
Another Point of Improvement
In the on-ramp, a series of building blocks are available to the eMagiz user (98 in total excluding ’service activators’ and ’support objects’). From the research, it became clear that a mere 23% of these blocks are used. This implies that 77% of the building blocks, presented to the eMagiz user in the on-ramp, are never used. The result is that the eMagiz user must scroll through a high number of building blocks in order to find the required block. Since this time could be used more effectively, it is recommended to alter the list of building blocks presented to the eMagiz user. The 23% of blocks that are used, should still be presented to the eMagiz user. The remaining 77% can be stored under the umbrella of ’more’. In that case, the eMagiz user could still use these blocks if necessary. Also, the support blocks (service activators and support objects) should be kept.
5.3
Discussion
5.3.1
Measuring Impact
To measure the impact of the assistance tool on the dataflow construction process, two situations must be compared. In the first situation eMagiz users must construct dataflows with help of the assistance tool and in the second situation eMagiz users must construct dataflows without help of the assistance tool. The time it takes to create a dataflow in both situations should be measured and compared. The dataflows which are constructed in this experiment must be stereotypical for eMagiz. The justification for this is that this results in the greatest reduction of the total time spent on constructing dataflows. The research population of this experiment must consists of three types of eMagiz users. The first type is at the beginner level, the second on an average level and the third on an expert level. It is expected that the beginner has the most to gain from the assistance tool and the expert has the least. This should, however, be measured before concluded.
5.3.2
Broader Application
5.4. Conclusions 35
for all businesses that work with business process models and wish to increase modelling speed with help of an assistance tool.
5.3.3
Choice of Algorithms
The machine learning algorithms applied in the comparison program were determined through literature study (chapter 2 Theoretical Framework). It is, however, imaginable that a more suitable (yet non-existing) algorithm will be developed. For future research, it might be interesting to add this, possibly more accurate, machine learning algorithm to the comparison program. This could result in a more accurate assistance tool for eMagiz.
5.3.4
Usage of Input Data Sets
As explained in chapter 3 Design & Development, the suggestions made by the assistance tool are based on input data sets. An input data set contains information regarding a number of connected building blocks. For example, if an eMagiz user connects two building blocks and opens the assistance tool, then the suggestions presented are based on the input data set with three columns (two columns for input, one for output). In total, there are five input data sets with three, four, five, six and seven columns. An input data set with three columns is applied when there are two building blocks connected, an input data set with four columns is applied when there are three building blocks connected, etc. If the assistance tool is opened when six or more blocks are connected, then the input data set with seven columns is applied.
This situation does not always generate optimal results. For instance, if three blocks are connected, then the input data set with four columns is applied. The possibility that the input data set with three columns generates better results does, however, still exist. At the moment, given the eMagiz data set, this is not the case. The results generated are optimal, but this might change as the eMagiz data set changes. Therefore, it is interesting to find ways to apply the most suitable input data set to any given situation.
5.4
Conclusions
5.4.1
Answering the Research Question
The aim of this study was to solve the core problem. As described in chapter 1 Introduc-tion, the core problem was that eMagiz had little options to build non-standard dataflows automatically. This was translated into the following research question: How can user actions in a model-driven platform be predicted to increase modelling speed with the help of an assistance tool?.
is answered. Once eMagiz conducts the experiment (as described in Discussion section Measuring Impact), then one could conclude whether the assistance tool does indeed increase modelling speed. In all likelihood, this will be the case.
5.4.2
Advantage Routes
When applying the concept of routes, the data could be used relatively easy for machine learning. The advantage is that data which is unsuitable for machine learning could be made useful by writing the data in route form. This is also applicable for other machine learning related problems.
5.4.3
Advantage Rule Based Learning
From Table 4.2, it becomes clear that Rule Based Learning does not under perform. In fact, the algorithm systematically performs better than average. In the worst case scenario and in comparison to the best performing algorithm, Rule Based Learning scores 3% less in term of accuracy. Therefore, statistics could be used to make predictions regarding the continuation of dataflows for eMagiz. This, in turn, makes it very suitable for similar situations. Future research must examine whether statistics could be applied for other business process models apart from eMagiz.
5.4.4
ROC curve
From the results of chapter 4 it is clear that performance is optimised once the True Positive Rate (TPR) is 0.68, the False Positive Rate (FPR) 0.16 and the threshold 87.5%. This does increase performance in terms of TPR and FPR, but the total number of False Positives and False Negatives increases. For eMagiz this does not imply an improve-ment but rather a worsening in terms of accuracy. Therefore, a threshold must not be implemented for the assistance tool.
5.4.5
Number of suggestions
From the graph in chapter 4 Implementation & Demonstration, it becomes apparent that the number of suggestions made by the assistance tool must be five. After all, if the number of suggestions is increased to six, then the accuracy score increases with less than 1%. This increase is simply too small. If the number of suggestions is decreased to four, then the accuracy score decreases with approximately 3%. This would be too great a loss (as described in chapter 3 Design & Development). Hence, it was decided to let the assistance tool make five suggestions in total.
5.4. Conclusions 37
Bengio, e. a., Y. (2004). No unbiased estimator of the variance of k-fold cross-validation. Journal of Machine Learning Research.
Cape groep. (n.d.). Retrieved from https://www.capegroep.nl/en/homepage/ emagiz. (n.d.). Retrieved from https://www.emagiz.com
Fisher, R. (1936). The use of multiple measurements in taxonomic problems. Annals of Human Genetics.
Heerkens, e. a., H. (2017). Solving managerial problems systematically. Noordhoff Uit-gevers BV.
James, e. a., A. H. (1982). The meaning and use of the area under a receiver operating characteristic (roc) curve. Radiological Society of North America.
Kotsiantis, S. (2007). Supervised machine learning: A review of classification techniques. Informatica.
Ordonez, e. a., C. (2006). Association rule discovery with the train and test approach for heart disease prediction. IEEE.
Pedregosa, e. a., R. (2011). Scikit-learn: Machine learning in python. Journal of Machine Learning Research.
Peffers, e. a., K. (2007). A design science research methodology for information systems research. Journal of Management Information Systems.
Sokolova, e. a., M. (2006). Beyond accuracy, f-score and roc: A family of discriminant measures for performance evaluation. Springer.
Appendix A
The eMagiz platform
[image:48.595.234.364.380.420.2]To understand eMagiz one must first define digital integration. The concept of digital integration refers to 1) making communication possible between different systems and/or platforms and 2) making the process of transferring information as efficient as possible. Systems and platforms could be seen as nodes and communication could be seen as a two-way street. In other words, communication implies that information can be send from node i to node j and information can be send from node j to node i (see Figure A.1).
Figure A.1: Two nodes with associations
The process of making information transfers as efficient as possible, mostly comes down to reducing the number of associations (arrows/edges/channels). This makes the whole system clearer and reduces the time spend for information transfers. As one can imagine, the number of associations increases radically when new nodes are added to the system (Figure A.2).
Figure A.2: Multiple nodes with associations
eMagiz is a platform used for the sole purpose of making digital integration reliable and relatively easy. In Figure A.2, an example of standard digital integration is shown. As one might observe, the total number of associations in the system (one way) is equal to
n2 −n, where n is the total number of nodes in the system. That is to say, the total number of associations has a growth rate of O(n2).
[image:48.595.170.518.545.650.2]The problems that arise, as a result of this, might be best explained with the help of an example from one of eMagizs clients. The client Royal BAM Groep uses many different systems. Therefore, the number of nodes is quite high. This results in three big problems. Firstly, it is incredibly difficult to keep an overview of the system. This makes it hard to work with. Secondly, the insertion of a new node in the system results in an immense number of extra tasks. Namely, the new node must be connected to all other nodes, which takes a long time. Furthermore, even a relatively simple task such as editing an existing node could result in editing thousands of associations. Thirdly, a high number of associations often slows down the process of transferring information.
[image:49.595.184.411.249.446.2]eMagiz came with a solution for this problem. Instead of connecting every single node with all other nodes, eMagiz uses a central bus. This bus interprets the data acquired from each node and sends it to other node(s) that request the information. This process is visualized in Figure A.3.
Figure A.3: eMagiz bus with associations
The result is that the number of associations is kept to a minimum. This solves all three problems mentioned earlier. Firstly, it is now a lot simpler to keep an overview of the entire system. Secondly, the insertion of an extra node has become easier and editing an existing node does no longer require the user to redefine a high number of associations. Thirdly, as a result of the reduction of associations, the process became less time consuming and hence more efficient. Alternatively stated, the growth rate has been reduced to O(n). As displayed in Table A.1, the number of associations is reduced dramatically when comparing the eMagiz bus to the standard system. Especially in the case of a high number of nodes the difference (of the total number of associations) is astonishing.
[image:49.595.143.452.640.721.2]Appendix B
Iris flower data set
The Iris flower data set (also known as Fisher’s Iris data set) was first described by the British researcher Ronald Fisher in his paper The use of multiple measurements in taxonomic problems. In this paper, a data set consisting of 150 Iris samples was outlined. In total, three species of Iris were presented (50 samples each): 1) the Iris setosa, 2) the Iris virginica and 3) the Iris versicolor. From all flowers, four features were measured: the sepal length and width and the petal length and width. All four features were measured in centimeters. Based on these features, Fisher created a linear discriminant model to make a distinction between the three species.
Since the output (flower species) can be predicted by the input (sepal width and length, and petal width and length), the Iris flower data set is ideal for machine learning. For this reason the Iris flower data set became part of the scikit learn library ((Pedregosa, 2011)) in Python. Hence, this data set is now widly used to train and test machine learning algorithms.