Using the Prototype Willingness
Model (PWM) to Detect Gender
Differences in High Energy Drink
Consumption
Dilara Kocol S1729128 Bachelor thesis
Department of Health Psychology & Technology July 2019
Faculty of Behavioural, Management and
Social sciences (BMS)
Background: Energy Drinks started to become increasingly prevalent and hyped among
different age groups in different situations. Besides the primary goal of this drink which was
targeted at sportspersons, a lot of people, especially males and youngsters make use of these
drinks in their daily life based on different determinants. The Prototype Willingness Model
(PWM) is a successfully used model to analyse risk behaviours, such as High Energy Drinking.
Currently there are little studies targeted at High Energy Drinks, especially with the use of the
PWM. Therefore, this study aims is to detect gender differences in High Energy Drinking
Consumption and the variables of the Prototype Willingness Model, that predictively explain
the risk behaviour. Methods: A cross-sectional survey that integrated several questions
referring to the variables of the PWM and the risk behaviour was used. ANOVA tests and
univariate correlation analyses were conducted to determine differences and associations in the
variables of the PWM. Hierarchical multiple regression analyses of the variables of the reasoned
and social reactive pathway were conducted to detect significant predictors of HED in both
genders. Results: Males consumed significantly more Energy Drinks than females.
Additionally, they had more positive beliefs about these drinks and were more aware of the
disadvantages of these on one’s health. The correlations showed that except prototype
perceptions negative, all variables of the PWM correlated with HED behaviour, intention and
willingness in the total group. The most important variables that correlated with the risk
behaviour were attitude direct, intention and willingness. Nevertheless, the variable intention
of the reasoned pathway had the strongest significant association with the risk behaviour. A
significant difference between genders was found in attitude direct which was a significant
predictor for HED only in females. Conclusion: Based on the results, it can be concluded that
reducing the consumption of Energy Drinks and increasing the knowledge about the side effects
might be useful. Interventions specified on raising awareness of the risks of High Energy
drinking and presenting healthier Drink options could help in reducing the risk behaviour.
[Hier eingeben]
Table of Contents
1. INTRODUCTION ... 4
1.1 INGREDIENTS AND NEGATIVE HEALTH CONSEQUENCES OF ENERGY DRINKS ... 4
1.2 REASONS TO ENGAGE IN DRINKING ENERGY DRINKS ... 5
1.3 THE PROTOTYPE WILLINGNESS MODEL ... 5
1.4 YOUNGSTERS, AS A PARTICULAR AT-RISK GROUP ... 7
1.5 GENDER DIFFERENCES ... 8
2. METHODS ... 10
2.1 DESIGN ... 10
2.2 PARTICIPANTS AND PROCEDURES ... 10
2.3 MATERIALS ... 11
2.4 DATA ANALYSIS ... 14
3. RESULTS ... 15
4. DISCUSSION ... 25
5. STRENGTHS AND LIMITATIONS ... 30
6. RECOMMENDATIONS ... 30
7. CONCLUSION ... 31
8. ACKNOWLEDGEMENTS ... 32
1. Introduction
Energy Drinks entered our life years ago in the nineteen sixties with the primary goal of serving
as a dietary supply that pushes the consumer’s energy level higher. During the development of
these drinks, they were primarily targeted at sportspersons (Reissig, Strain, & Griffiths, 2009).
Nowadays, the consumption of Energy Drinks is constantly growing among people of different
age groups worldwide. Moreover, they developed into a must-have, go-to drink for men,
women, youngsters or even kids from early mornings into late nights on different occasions,
for example, while studying late at night or doing sports (Bulut, Beyhun, Topbas, & Can, 2014).
1.1 Ingredients and Negative Health Consequences of Energy Drinks
The main ingredients of Energy Drinks are taurine, caffeine, vitamins B, carbohydrates, and
sugar (Bigard, 2010). Thus, the milligram of caffeine, which varies from Energy Drink to
Energy Drink, generally known to be between 80 to 141 mg per drink, plays an essential role
in the achievement of a certain effect either related to one’s physical or mental skills (Bigard,
2010).
Next to its energy-enhancing effect, the ingredients and especially caffeine, have several
side effects on one’s health too. First of all, according to Gunja and Brown (2012), reaching a
high level of caffeine through the consumption of Energy Drinks can lead to “palpitations,
agitation, tremor, gastrointestinal upset, serious cardiac or neurological toxicity, including
hallucinations, seizures, arrhythmias or cardiac ischaemia” (Gunja & Brown, 2012). Further,
since caffeine enhances the blood glucose level, there is the risk of developing Type 2 diabetes
(Dewar & Heuberger, 2017). In addition to that, the consumption of an Energy Drink increased
the consumers’ anxiety range from “minimal level of anxiety” to a “mild level of anxiety”, and
from no level of depression to showing certain features, fitting to a pathological profile (Petrelli
Moreover, consuming huge amounts of these drinks at an early age and especially with
the combination of alcohol, is related to becoming more at risk for using for example tobacco
or drugs, developing an alcoholic addiction, and getting depressions (Azagba, Langille, &
Asbridge, 2014; Hamilton, Boak, Ilie, & Mann, 2013). Next, to these negative effects, the
consumption harms the dental health of the consumers too (Jean, 2017).
1.2 Reasons to Engage in Drinking Energy Drinks
Even though the consumption of Energy Drinks contains several negative side effects, there are
various reasons for people to still consume these drinks. For example a study conducted by
Malinauskas, Aeby, Overton, Carpenter-Aeby, and Barber-Heidal in 2007,determined in total
six different occasions in which the participants, who were college students, made use of
Energy Drinks, namely a) in times of a lack of sleep, b) to enhance their level of energy, c)
during exam times, d) when driving long distances, e) in combination with alcohol, and f) and
to handle after-party days. Moreover, 51% of the college students that took part in the study
communicated that they consume more than one Energy Drink in a month (Malinauskas et. al,
2007). This demonstrates the change in the situations in which the Energy Drink is nowadays
in use, compared to its main goal mentioned above in the nineteen sixties. Thus, even though a
lot of people tend to consume such drinks in various circumstances, there is a lack of attention
paid on the ingredients and the downsides of Energy Drinks (O’Dea, 2003; Ward, 2009).
1.3 The Prototype Willingness Model
The Prototype – Willingness Model (PWM) (Figure 1), developed by Gibbons, Gerrard and
colleagues (Gibbons, Gerrard, Blanton, & Russel, 1998; Gibbons, Gerrard, & McCoy, 1995),
is used in order to give reasons for the risk aspects of decisions that are made related to the
behaviour in adolescents (Todd, Kothe, Mullan, & Monds, 2014).
A special feature of the PWM is that it uses two different information-processing
pathway, which is determined by intentions and deals with the determinants attitude and subjective norm. These variables predict intention to engage in that behaviour, and intention
subsequently predicts actual behaviour (Todd, Kothe, Mullan, & Monds, 2014). On the other
hand, there is the social reactive pathway that affects one’s behaviour through willingness (Hammer & Vogel, 2013). More specifically, this pathway is about the variables ‘prototypes’
and ‘willingness’. According to Elliott et.al, the prototype perceptions can be defined as
“positive or negative valences that are attached to the cognitive representations that people hold
for the typical members of social categories” (Elliott et. al, 2017). Moreover, there are two
different kinds of prototype perceptions, namely on the one side, the prototype favourability
perception, which refers to one’s evaluation either positively or negatively towards the
prototype. On the other side, there is the prototype similarity perception that is related to the
particular degree of alikeness, one has the belief to show or have towards the prototype (Elliott
et. al, 2017).
Besides that, the two proximal variables ‘intention’ and ‘willingness’ that were
mentioned above and are pictured in Fig. 1 can be distinguished. The difference between these variables can be understood as the following: According to Gibbsons et al. (1998), intentions
are related to planned behaviours, thus an active engagement with a risky behaviour that is often
based on a process where one has thought of and reasoned, until deciding to finally engage in
a certain risk behaviour (Gerrard et. al, 2005). Willingness, as opposed to intentions, deals with
an unplanned action and the conduction of a certain behaviour when there is an opportunity
offered. So, for example, a youngster, who does not smoke, goes to a party where a lot of people
do smoke. Such a situation indirectly increases the tendency for him/her to smoke, thus it is
one’s willingness to show a certain openness to take a risk which leads to the final behaviour
Figure 1. A Prototype Willingness Model applied to the Consumption of Energy Drinks
1.4 Youngsters, as a particular At-Risk Group
Despite the negative consequences, Energy Drinks are increasingly consumed also by
non-athletes. Hence, nowadays there is a huge consumer group, involving different female and male
age groups with an extremely growing consumption among young people. As it was found in
the study conducted by Jacob, Tambawel, Mohammed Trooshi, and Alkhoury (2013), 92% of
the students who took part in the study, had their first Energy Drink at an age of 15 and onwards.
Thus, people nowadays start to consume Energy Drinks at an early age that might be associated
with a lack of knowledge concerning the risks of such drinks on one’s health. Next to this
feature, describing one side of Energy Drink consumers, Poulos and Pasch (2015) found further
specific characteristics that are related to that target group, more specifically to a ‘prototypical’
consumer. Namely, that people consuming Energy Drinks generally have a greater tendency to
be male, white and have a higher BMI (Poulos and Pasch, 2015). Gender
Attitude
Subjective Norm
Prototype Perceptions
Intention
Willingness
Behaviour
Reasoned pathway
1.5 Gender Differences
Energy Drinks are highly popular among different age groups, but according to several studies
men generally tend to consume more Energy Drinks than women (Dillon et. al, 2019; Miller,
2010). According to Statista (2016), who studied the Energy Drink Consumption frequency
among 1,491 respondents in the age group 18 to 69 years in the U.S in 2016, 49% of males
compared to 43% of female respondents consumed Energy Drinks several times per week.
Based on these findings, the first expectation of this study is that men consume more Energy
Drinks than females.
Concerning the different underlying determinants that lead to the consumption of
Energy Drinks in males and females, there is little known for now. A study conducted by
Roberson (2005) found an association between masculinity and Energy Drink consumption.
Moreover, Thorlton and Collins (2017) who used the Theory of Planned Behaviour (TPB) to
show the association between underlying beliefs and Energy Drink consumption, concluded
that attitudes had a huge impact on the intention to drink Energy Drinks, especially in males
(Thorlton & Collins, 2017). Hence, a possible reason given for that is that men tend to have
more positive opinions towards Energy Drinks compared to women. Based on these findings,
it is expected that men might have more positive beliefs towards Energy Drinks compared to
females. Thus, all in all, it can be concluded that, even though there is some evidence, showing
the difference between males and females regarding the consumption of Energy Drinks, there
is still the need to find out more about the different underlying determinants generally and
gender specifically.
Based on the fact that the Prototype Willingness Model is a successfully used model to
analyse risk behaviour and explain an important amount of one’s intentions with regard to a
risk behaviour (Rivis, Sheeran, & Armitage, 2009), it will be used for this study of High Energy
Drinking consumption in general and among gender differences. Hence, it is expected that the
variables of the PWM can predict the consumption of HED. Furthermore, a study conducted by
predicting alcohol consumption, found a relation between subjective norms and positive
prototype perceptions and one’s expectations about the drinking in both genders equally. Based
on associations found between Energy Drink and Alcohol consumption (O’Brien, McCoy,
Rhodes, Wagoner, &Wolfson, 2008), it is expected that subjective norm and positive prototype
perceptions might have an association with Energy Drinking Consumption too. Moreover, it is
expected that willingness compared to intention would be a stronger predictor for the
consumption of Energy Drinks, due to the fact that a study conducted by Dal Cin et. al (2009)
concluded that willingness serves as a strong mediator and predictor for drinking alcohol (Dal
Cin et. al, 2009). This is based on its association with reducing the weighing up of consequences
of a certain behaviour (Gerrard, et al. 2002). Regarding gender differences, it is expected that
attitude might be a strong predictor for HED in males, based on their generally positive attitude
regarding Energy Drinks which associates with the consumption of these drinks (Douglas &
Nkporbu, 2018; Thorlton & Collins, 2017).
Based on what was mentioned above, the goal of this study is to determine and compare
the factors of the PWM that trigger male and female students to consume High Energy Drinks.
Therefore, the research questions are:
1) “To what extent do males and females differ in the consumption of High Energy
Drinks and the underlying determinants: attitudes, subjective norm, and
prototype perceptions?”
2) “To what extent is the consumption of High Energy Drinks predicted by the
variables of the Prototype Willingness Model, and which variables are the most
important?”
3) “Is High Energy Drinking explained by different determinants in males than in
2. Methods
2.1 Design
This presented quantitative study is a cross-sectional survey that deals with the variables of the
PW Model and the association with the additional variable gender. The independent variables
in this study are gender, attitude direct, attitude advantage, attitude disadvantage, subjective
norm, prototype perception positive and prototype perception negative. The dependent
variables are High Energy drinking behaviour, intention, and willingness.
2.2 Participants and Procedures
This study was approved by the BMS Ethics Committee of the University of Twente. The Ethics
Committee of the University of Twente provided the request number: 190314.
The data was collected via an online questionnaire, that was compiled in Qualtrics, an online
application that is used for research purposes. Participants were informed about the study
through SONA systems, via WhatsApp messages, and a post on the social media platform
Instagram, describing shortly the aim of the study and its most important requirements for
participation. Through a hyperlink, the SONA system brought the participants to the actual
survey where they could complete the questionnaire.
The inclusion criterion for this study was to be at least 12 years old. Moreover, having
a sufficient level of English to complete the questionnaire which counted for participants who
are 18 years old or older was an additional criterion. Participants between 12 and 17 years
received a Dutch version of the questionnaire so that there were no misunderstandings of the
items in the questionnaire.
This online survey took approximately 30 minutes. As a reward, the participants, more
specifically only students of the University of Twente, were provided with 0.5 SONA points.
In total, 262 respondents completed the questionnaire. Of these, 56 participants were
excluded due to incomplete data, not agreeing on the terms mentioned in the informed consent
and being younger than 12 years. Hence, the statistical analyses were conducted with the final
sample of 206 participants. For the full description of the information that was provided to the
participants concerning the study, see Appendix A.
2.3 Materials
The material used for the study was a questionnaire that covered questions related to the
following topics: (1) demographics, (2) behaviour of High Energy Drinking consumption and
(3) the Prototype Willingness Model (PWM).
The first part of the survey referred to the participant’s Energy Drinking behaviour in
general. Then, questions that are based on the variables of the PWM were presented. The last
part of the survey was about demographics. Below the complete operationalisations of the
variables are described.
Demographic questions. The demographic questions used in this study were gender,
age, nationality, the highest level of education one has completed. Nationalities were
determined in three parts, namely a) Dutch, b) German, and c) other, where the participant could
fill in the specific nationality. The level of education that one has completed was asked by
providing the following options: a) Student, b) High school diploma, c) College diploma, d)
Bachelor’s degree, e) Master’s degree and f) Others, where there was again the possibility to
add that education one has completed.
Behaviour of High Energy Drinking Consumption. This construct was measured
with three items. The first item was “Have you ever drunk Energy Drinks?” and the second
item was “Have you drunk an Energy Drink in the last month?”. Both had to be answered with
either a yes or a no. Participants who answered in both cases with a no were treated throughout
the study and the statistical analyses as no Energy Drink consumers. The third item was “Over
which had to be evaluated (1= 1 day; 7= 7 days). The participants were categorized into three
different groups according to their summed scores. If a participant answered the first two
questions with “no”, (s)he was categorized into the group of “No Energy Drinkers”. Participants
who drank on one or two days during the week Energy Drinks were considered as “Low Energy
Drinkers”. If a participant drank on three to seven days during the week, (s)he was categorized
into the group of “High Energy Drinkers”.
(Direct) Attitude. This construct measured the attitude of the participants about on the
one hand the general and on the other hand the regular consumption of Energy Drinks.
This was measured with five items, more specifically adjectives plus their opposites, hence
such as “bad -good” or “worthless – valuable”, per general and regular consumption. Both, thus
10 items in total were averaged into a scale. Based on a 5-point Likert scale, they had to
evaluate what the consumption of an Energy Drink is like. The answer on the five items was
summed into a scale score (Cronbach’s α =0.92). The scale scores can be interpreted in the way
that higher scores refer to a more positive attitude.
Attitude advantages. These items referred to positive beliefs towards the consumption
of Energy Drinks. These were measured with 5 items. Example statements which had to be
answered with a 5-point Likert scale (1= Strongly disagree; 5=Strongly agree) are “Drinking
Energy Drinks improves one’s attention span” or “Drinking Energy Drink improves one’s
athletic performances”. The answer on the five items was summed into a scale score
(Cronbach’s α =0.71).Higher scores refer to more positive beliefs towards the consumption of
Energy Drinks.
Attitude disadvantages. This construct was measured with 10 items. Examples for this
part of the questionnaire are “Drinking Energy Drinks increases one’s heart rate” and “Drinking
Energy Drinks regularly leads to overweight”, which were answered with a 5-point Likert scale
(1= Strongly disagree; 5= Strongly agree). The answer on the time items was summed into a
Subjective norm. This variable of the PWM deals with the subjective norm that is
related to the closest people one is surrounded by. The construct has in total six items, which
participants had to evaluate. The first two were on the one hand related to the family and on the
other hand related to the friends. Answer options were based on a 5-point Likert scale
(1=Strongly disagree; 5=Strongly agree). An example is the statement “Friends important to
me think that … consume energy drinks”. Statements three to six had to be answered through
a 5-point Likert scale again too (1=Strongly disagree; 5= Strongly agree). As an example, there
is the item “The people in my life whose opinion I value would … with my weekly consumption
of energy drinks”. Based on the fact, that all items summed into one scale had low reliability,
the three items that measured the normative beliefs were summed into a scale, which had a
higher Cronbach’s alpha value, namely Cronbach’s α =0.85. This scale, called “Subjective
norm – normative beliefs” were used for further statistical analyses. Higher scores refer to a
high level of perceived social pressure to perform the risk behaviour.
Prototype perception. This construct was assessed with 20 items that fit according to
the participants to the following statement “A typical person your age who regularly consumes
energy drinks is.”. Negative and positive adjectives such as cool, dynamic, lazy, chaotic that
describe a prototypical Energy Drinker were provided to the participants which they had to
evaluate based on a 5-point Likert scale (1 =Not at all; 5= very much). Based on a factor analysis
that was conducted, the scale was divided into 11 items for the positive ones and 9 items for
the negative ones. The answer on the eleven positive items concerning the prototype
perceptions was summed into a scale score (Cronbach’s α =0.90). Higher scores refer to more
positive prototypical perceptions regarding an energy drinker. The answers on the nine negative
items about the prototype perception were summed into a scale score (Cronbach’s α =0.88).
Higher scores refer to more negative prototypical perceptions regarding an Energy Drinker.
Prototype Similarity. This part of the prototype variable deals with one’s similarities
concerning a typical energy drink consumer. This construct was measured with four items
scale are: “Do you resemble the typical person your age that regularly consumes Energy
Drinks?” or “I am comparable to the typical person my age that regularly consumes Energy
Drinks”. The answers on the four items were summed into a scale score (Cronbach’s α =0.87).
Higher scores refer to fewer similarities concerning a typical Energy Drink consumer.
Intention. The intention in this context is related to the participants’ intention to
consume an Energy Drink. This was measured with four items, more specific statements such
as “I intend to consume at least one energy drink in the next month”, which had to be answered
with a 5-point Likert scale (1=Strongly disagree; 5=Strongly agree). The answer on the four
items was summed into a scale score (Cronbach’s α =0.94). Higher scores refer to a higher
intention to consume Energy Drinks.
Willingness. This variable refers to the participant’s level of willingness to execute the
behaviour of drinking Energy Drinks in different situations and conditions. Willingness was
measured with seven items that had to be evaluated based on a 5-point Likert scale
(1=Definitely not willing; 5=Definitely willing). An example item is “Suppose you have to
drive home late at night, and you get tired. Your co-driver offers you an energy drink. How
willing are you to consume that drink?”. The answer on the seven items was summed into a
scale score (Cronbach’s α = 0.90). Higher scores refer to more willingness towards consuming
Energy Drinks at different situations and conditions.
2.4 Data analysis
To analyse the data and to start with the analysis to investigate the research questions, the data
that was retrieved from Qualtrics was transferred to SPSS Statistics 25.
For a general impression of the demographic variables (i.e. gender, age, nationality, &
educational level, Energy Drinking behaviour, and PWM-variables) frequencies, means,
standard deviations and ranges of the data were computed.
To examine the first research question, which was about the comparison or differences
determinants attitudes, subjective norms, and prototype perception of the PWM one-way
ANOVA analyses were conducted.
The second research question was focused on the predictability of the Prototype
Willingness Model and the correlations between the variables of the PWM concerning HED
consumption, intention, and willingness. Hence, through conducting univariate correlation
analyses the correlations between the variables of the PWM were analysed in order to determine
those variables that had the most important influence on HED. The relationships were analysed
by using Pearson’s r. The rule is that if Pearson’s r is between 0.6 and 1, there is a strong
correlation between the variables. Pearson’s r between 0.3 and 0.6 means there is a moderate
correlation and values between 0.0 and 0.3 describe a weak correlation (Mukaka, 2012).
To examine the third research question, which was focused on analysing if different
determinants between males and females predictively explained High Energy Drinking,
hierarchical multiple regression analyses were conducted. One regression analysis was
conducted for the variables of the reasoned pathway and the other one for the variables of the
social reactive pathway of the PWM to determine the predictors for HED. In these analyses,
p-values < .05 were considered statistically significant.
3. Results
Demographics
In table 1, the demographic characteristics of the respondents are displayed, with the
Table 1.
Socio-demographical Characteristics (Gender, Education, Nationality, Age) of the Total Sample (N=206)
Total (n=206) Gender, n %
Male 84 (40.8)
Female 122 (59.2)
Education, n (%)
Student 82 (39.8)
High School Diploma 52 (25.2)
College Diploma 11 (5.3)
Bachelor’s Degree 28 (13.6)
Master’s Degree 13 (6.3)
Other 20 (9.8)
Nationality, n (%)
Dutch 56 (27.2)
German 125 (61.2)
Other1 25 (11.6)
Age in years, M (SD) 28.63 (13.88)
12 – 17 years old, n % 20 (9.6)
18 – 30 years old, n % 131 (63.7)
31 – 40 years old, n % 13 (6.5)
41 + years old, n % 42 (20.2)
1 Aramean, Austrian, Brazilian, British, Danish, French, Greek, Indian, Kurdish, Lebanese, Luxembourgish, Moroccan, Russian,
Somalian, Turkish
In total there were 206 participants, of which the majority was female (59.2 %). The participants
varied in their education level, but most were higher educated or were still (university) students.
The respondents varied in age from 12 to 75 years, but the far majority (63.7%) fell in the age
group of 18 – 30 (mean age =28.63) and were German.
Drinking of High Energy Drinks
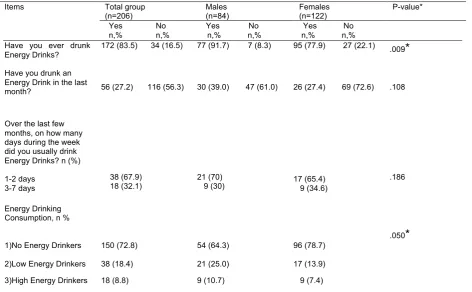
Table 2 displays the frequencies of the consumption of High Energy Drinks in the total
group, males, and females. Moreover, the displayed p-values of the one-way ANOVA
emphasize the statistically significant differences between males and females. Participants who
answered the first two questions with a “no”, were categorized into the group “No Energy
Drinkers”. Participants who drank on one or two days during the week Energy Drinks were
classified as “Low Energy Drinkers”. A participant who consumed between three to seven days
Table 2.
Frequencies of High Energy Drinking in Total Sample (N=206), Males (N=84), and Females(N=122)
Items Total group
(n=206) Males (n=84) Females (n=122) P-value*
Yes No Yes No Yes No n,% n,% n,% n,% n,% n,% Have you ever drunk
Energy Drinks?
172 (83.5) 34 (16.5) 77 (91.7) 7 (8.3) 95 (77.9) 27 (22.1) .009*
Have you drunk an Energy Drink in the last
month? 56 (27.2) 116 (56.3) 30 (39.0) 47 (61.0) 26 (27.4) 69 (72.6) .108
Over the last few months, on how many days during the week did you usually drink Energy Drinks? n (%)
1-2 days 3-7 days
38 (67.9) 18 (32.1)
21 (70)
9 (30) 17 (65.4) 9 (34.6)
.186
Energy Drinking Consumption, n %
.050*
1)No Energy Drinkers 150 (72.8) 54 (64.3) 96 (78.7)
2)Low Energy Drinkers 38 (18.4) 21 (25.0) 17 (13.9)
3)High Energy Drinkers 18 (8.8) 9 (10.7) 9 (7.4)
*Differences of means significant at the 0.05 level
Of the total sample (N=206), the majority (83.5%) has ever drunk Energy Drinks. Nevertheless,
the minority (27.2%) has drunk an Energy Drink in the last month. When having a look at the
number of days during the week the participants consumed Energy Drinks, it became obvious
that the majority of the total sample (67.9%), consumed in one to two days during the week.
Based on the Energy Drinking Consumption of the total sample, around 73% were categorized
into the group of No Energy Drinkers. Thirty-eight participants (18.4%) were categorized into
the second group, namely Low Energy Drinkers. Nearly 9% (n=18) of the total sample were
categorized into the group of High Energy Drinkers.
When looking at gender differences, it can be concluded that significantly more males
(91.7%) than females (77.9%) have ever consumed Energy Drinks. When taking the
frequencies of the drinking behaviour in both genders into account, it can be concluded that
there were significantly more female participants (n=96) compared to males (n=54), who were
14% of the females were categorized into the group of Low Energy Drinks. However, more
males (10.7%) than females (7.4%) were categorized into the group of High Energy Drinkers.
[image:18.595.73.534.390.631.2]The Prototype Willingness Model
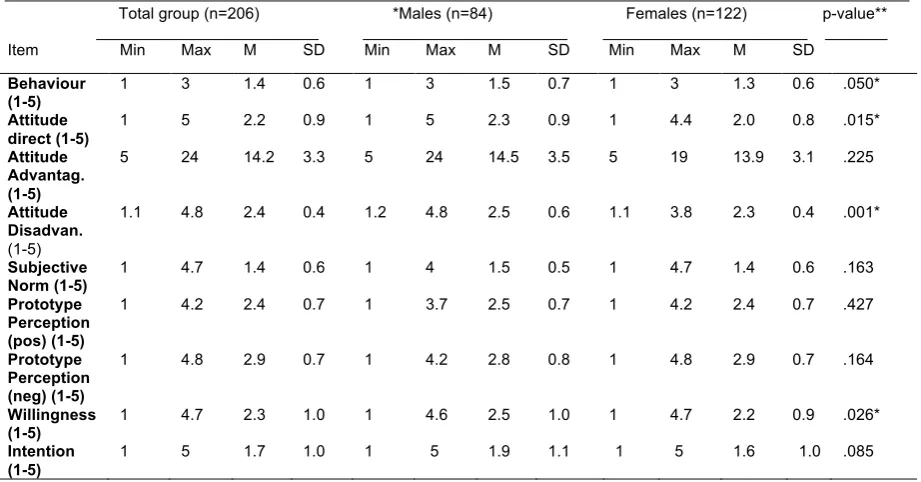
Table 3 shows an overview of the ranges, means, standard deviations and p-values of
the one-way ANOVA which display differences in genders in the variable’s behaviour,
attitudes, subjective norm, prototype perceptions, willingness and intention for the total
group, males, and females.
Table 3.
Ranges, Means, Standard Deviations and P-values of the Variables of the PW Model in Total Group (N=206), Males (N=84), and Females (N=122)
Total group (n=206) *Males (n=84) Females (n=122) p-value** _________________________ _______________________ _______________________ _______
Item Min Max M SD Min Max M SD Min Max M SD
Behaviour (1-5)
1 3 1.4 0.6 1 3 1.5 0.7 1 3 1.3 0.6 .050*
Attitude direct (1-5)
1 5 2.2 0.9 1 5 2.3 0.9 1 4.4 2.0 0.8 .015*
Attitude Advantag. (1-5)
5 24 14.2 3.3 5 24 14.5 3.5 5 19 13.9 3.1 .225
Attitude Disadvan. (1-5)
1.1 4.8 2.4 0.4 1.2 4.8 2.5 0.6 1.1 3.8 2.3 0.4 .001*
Subjective
Norm (1-5) 1 4.7 1.4 0.6 1 4 1.5 0.5 1 4.7 1.4 0.6 .163 Prototype
Perception (pos) (1-5)
1 4.2 2.4 0.7 1 3.7 2.5 0.7 1 4.2 2.4 0.7 .427
Prototype Perception (neg) (1-5)
1 4.8 2.9 0.7 1 4.2 2.8 0.8 1 4.8 2.9 0.7 .164
Willingness (1-5)
1 4.7 2.3 1.0 1 4.6 2.5 1.0 1 4.7 2.2 0.9 .026*
Intention (1-5)
1 5 1.7 1.0 1 5 1.9 1.1 1 5 1.6 1.0 .085
*Differences between groups were tested with ANOVA **Difference of means significant at the 0.05 level
Regarding the total group, it became apparent that the participants, in general, had a weak
positive attitude towards the consumption of Energy drinks (m= 2.2) which was underlined by
the low mean of Attitude advantage (m=14.2). Moreover, the whole group perceived on average
positive and negative, it can be concluded that the sample had more negative prototypical
perceptions than positive ones. The scores of willingness and intention indicated that the
willingness of the total group compared to their intention to consume energy drinks was slightly
higher.
When comparing males and females, the significant difference in Energy Drinking
behaviour between males and females became again apparent. Namely, males (m=1.5)
compared to females (m=1.3) consumed more Energy Drinks. Additionally, what was very
striking and interesting was that whereas males were significantly more positive in general
about Energy Drinks (p=0.015), they also perceived significantly more disadvantages compared
to females (p=0.001). Nevertheless, males (m=2.5) showed a significantly higher willingness
to consume Energy Drinks compared to females (m=2.2). There were no significant differences
between males and females in subjective norm, both prototype perceptions, and intention.
Table 4 displays the outcomes of the univariate correlation analyses of the variables
prototype perception (negative and positive), attitudes (direct, advantages, and disadvantage),
and subjective norm concerning the variables Energy Drinking behaviour, willingness, and
intention. The correlations are displayed with Pearson’s R. These analyses were conducted for
the total group, males and females and showed the relationships between the variables. The
Prototype Willingness Model (Figure 1) predicts correlations on the one hand via the reasoned
pathway, including attitudes, subjective norm, and intention. And on the other hand, via the
social reactive pathway, including attitudes, subjective norm, prototype perceptions, and
willingness. Hence, according to the model, intention and willingness are those two
determinants that directly correlate with the risk behaviour of High Energy Drinking
Table 4.
Pearson’s Correlations Between the Variables of the Prototype Willingness Model for Total Group (N=206), Males (N=84), and Females (N=122)
Total group (n=206) Males (n=84) Females (n=122)
___________________________ __________________________ _________________________ 1 2 3 1 2 3 1 2 3 1.Behaviour
Pearson R 1 1 1
2.Willingness
Pearson R .61** .57** .63**
3.Intention
Pearson R .79** .63** .79** .64** .78** .61** 4.Prototype
perc. (neg) Pearson R
-.16* -.12 -.13 -.01 -.01 -.03 -.26** -.17 -.18*
5.Prototype perc. (pos)
Pearson R .23** .32** .26** .28* .38** .26* .19* .26** .25**
6.Attitude (direct)
Pearson R .57** .69** .62** .51** .64** .62** .60** .72** .60** 7.Attitude
(advantage)
Pearson R .32** .35** .31** .28** .19 .29** .33** .45** .31**
8.Attitude (disadvantage)
Pearson R .16* .28** .20** .18 .32** .22 .09 .19* .14 9.Subjective
norm
Pearson R .20** .26** .31** .06 .23* .21 .29** .26** .36**
N.B.: *Correlation Significant With p<.05 **Correlation Significant With p<.01
When having a look at the outcomes of the total group the first thing that became apparent was
that there were significant correlations between the variables of the reasoned pathway attitudes
and subjective norm with intention. Attitude direct had an especially strong relationship with
intention (r=.62**) and additionally with the risk behaviour (r=.57**). Intention had as
predicted by the PWM a significantly strong relationship with the risk behaviour (r=.79**).
Focusing on the variables of the social reactive pathway, it can be concluded that all
variables except prototype perceptions negative, significantly correlated with willingness.
Prototype perception negative only significantly negatively correlated with High Energy
Drinking Behaviour. Attitude direct had a significantly strong relationship with willingness
(r=.69**) and willingness had a significantly strong correlation with the risk behaviour
(r=.61**), as it is predicted in the PWM.
Thus, the most important variables predicting High Energy Drinking in the total group when
Considering gender differences, it became apparent that attitude disadvantage and
prototype perception negative in both genders and attitude advantage and subjective norm only
in males did not correlate with intention or willingness. Besides that, it can be concluded that
willingness (r=.63**) and attitude direct (r=.60**) had a stronger significant correlation in
females than in males to the risk behaviour. Nevertheless, the highest significant correlation in
both genders was between intention and High Energy Drinking behaviour.
Table 5 summarizes the outcomes of the hierarchical multiple regression analyses that
were conducted to predict High Energy Drink Consumption based on the variables of the
reasoned pathway of the Prototype Willingness Model, namely attitudes direct, advantage,
disadvantage, subjective norm, and intention. The outcomes are displayed through betas,
p-values, R2 and F. The hierarchical multiple regression analyses were conducted in two steps
for the total group, males, and females. In the first step, the variables of the reasoned pathway,
namely attitude direct, attitude advantage, attitude disadvantage, and subjective norm were
entered as the independent variable and HED as the dependent variable. At that point, the
amount of explained variance of attitude and subjective norm on the risk behaviour was
displayed. In step 2, intention was added as an additional independent predictor next to the
variable’s attitudes and subjective norm to detect changes in the amount of explained variance
Table 5.
Hierarchical Multiple Regression Analyses of the Variables in the Reasoned Pathway to Predict High Energy Drinking in Total Group (N=206), Males (N=84), and Females (N=122)
Total group (N=206) Males (N=84) Females (N=122) Predictor _______________________ _______________________ ________________________ HED HED HED
Step 1 ß p ß p ß p Attitude Direct .54 .000*** .48 .000*** .56 .000*** Attitude
Advantage
.09 .185 .15 .174 .06 .468
Attitude
Disadvantage -.01 .850 .07 .535 -.08 .273
Subjective
Norm .05 .433 -.08 .443 .14 .076
Model total R2=.33 F=26.5 R2=.27 F=8.5 R2=.37 F=18.7
Step 2
Attitude Direct .14 .021* .02 .812 .22 .005** Attitude
Advantage .05 .262 .09 .264 .04 .530
Attitude
Disadvantage -.01
.752
.04 .646 -.07 .248 Subjective
Norm -.06
.198 -.13 .071 .00 .976 Intention .71 .000*** .78 .000*** .65 .000***
Model total R2=.63 F=70.9 R2=.64 F=29.4 R2=.62 F=40.9 *Note *p<.05, **p<.01, ***p<.001
After conducting step 1, it became apparent that attitudes and subjective norm were able to
significantly explain 37% (F(4,117)=18.688, p=0.000) in females, 33% (F(4,200)=26.487,
p=0.000) in the total group and 27% (F(4,78)=8.520, p=0.000) in males of the variance in
HED. Adding intention to the variables of the reasoned pathway led to a remarkably
significant increase of the amount of variance to 64% (F(5,76)=29.368, p=0.000) in males,
63% (F(5,198)=70.941, p=0.000) in the total group, and 62% (F(5,116)=40.949, p=0.000) in
females. Hence, intention was a highly significant independent predictor of High Energy
Drinking consumption in males, females and the total group. Moreover, a striking point was
that attitude direct was in females (ß=0.22) and the total group (ß=0.14) an additional
predictor variable for HED. Hence, with each one-unit increase in attitude direct, the High
Energy Drinking behaviour rose by 0.22 in females and 0.14 in males. In males, attitude
direct was not a predictor, which is according to the PWM in general not a predictor variable
HED through the reasoned pathway was explained in females by intention and attitude direct,
whereas in males it was explained only by intention.
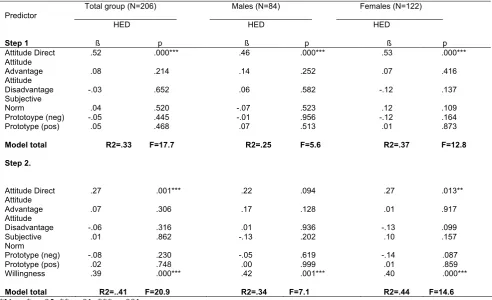
Table 6 displays the outcomes of the multiple regression analyses, conducted to predict
HED based on the variables of the social reactive way. The outcomes are displayed through
betas, p-values, R2 and F. The hierarchical multiple regression analyses were conducted in two
steps for the total group, males, and females. The first step included entering attitude direct,
attitude advantage, attitude disadvantage, subjective norm, prototype perception positive and
prototype perception negative. Hence, the variables of the social reactive pathway were entered
as the independent variable and HED as the dependent variable. In step 2, willingness was
included as an independent predictor, so that possible changes in the amount of explained
Table 6.
Hierarchical Multiple Regression Analyses of the Variables in the Social Reactive Pathway to Predict High Energy Drinking in Total Group (N=206), Males (N=84), and Females
(N=122)
Total group (N=206) Males (N=84) Females (N=122) Predictor _______________________ _______________________ ________________________ HED HED HED
Step 1 ß p ß p ß p Attitude Direct .52 .000*** .46 .000*** .53 .000*** Attitude
Advantage
.08 .214 .14 .252 .07 .416
Attitude
Disadvantage -.03 .652 .06 .582 -.12 .137
Subjective
Norm .04 .520 -.07 .523 .12 .109
Prototoype (neg) -.05 .445 -.01 .956 -.12 .164 Prototype (pos) .05 .468 .07 .513 .01 .873
Model total R2=.33 F=17.7 R2=.25 F=5.6 R2=.37 F=12.8
Step 2.
Attitude Direct .27 .001*** .22 .094 .27 .013** Attitude
Advantage .07
.306 .17 .128 .01 .917 Attitude
Disadvantage -.06 .316 .01 .936 -.13 .099 Subjective
Norm
.01 .862 -.13 .202 .10 .157
Prototype (neg) -.08 .230 -.05 .619 -.14 .087 Prototype (pos) .02 .748 .00 .999 .01 .859 Willingness .39 .000*** .42 .001*** .40 .000***
Model total R2=..41 F=20.9 R2=.34 F=7.1 R2=.44 F=14.6 *Note *p<.05, **p<.01, ***p<.001
The outcomes of step 1 showed that attitudes, subjective norm and prototype perceptions
accounted for the highest percent of variance in females (R2= 37%) (F(6,115)=12.801,
p=0.000). In the total group it accounted for 33% (F(6,198)=17.701, p=0.000) and in males
25% (F(6,76)=5.642, p=0.000). After entering the predictor variables willingness, the amount
of explained variance significantly increased in the total group, males, and females. The
highest amount of variance for the variables of the social reactive pathway was found in
females with (44%) (F(7,114)=14.627, p=0.000). The most important predictor in the total
group (ß=0.39), males (ß=0.42), and females (ß=0.40) was willingness. Additionally, again
attitude direct, as in the reasoned pathway, was an additional significant predictor variable for
concluded that HED through the social reactive pathway was explained in females by
willingness and attitude direct, whereas in males it was explained only by willingness.
All in all, it can be summed up that the variables of the reasoned pathway showed
more importance and explanation towards the behaviour of High Energy Drinking, compared
to the social reactive pathway. Moreover, in both genders willingness and intention were
predictors for HED. Nevertheless, a main difference in females and males was that attitude
direct was an additional predictor variable for the risk behaviour only in females.
4. Discussion
The purpose of this study was to add more insight into the Energy Drinking behaviour by
connecting this risk behaviour with the variables of the Prototype Willingness Model.
Moreover, the focus was set on the one hand on determining those variables that have an impact
on the consumption of High Energy Drinks. On the other hand, there was an emphasis on
detecting gender differences in the variables of the PWM. To fulfil these, cross-sectional data
were statistically analysed.
First of all, the findings showed that from the sample of 206 participants, 172 (83.5%)
have ever drunk an Energy Drink and only a minority of 56 participants (27.2%) have drunk an
Energy Drink in the last month. Out of these, 18 drank over the last few months on more than
two days during a week Energy Drinks. Based on this, 72.8 % of the sample were categorized
as No Energy Drinkers, 18.4% as Low Energy Drinkers, and 8.7% as High Energy Drinkers.
Thus, the consumption of Energy Drinks of this sample is lower than in other studies
(Malinauskas et. al, 2007; Statista, 2016; Oteri, Salvo, Caputi, & Calapai, 2007). Hence, for
future research, it is recommended to conduct the study with more participants and to specify
it to a smaller age group such as adolescents to get outcomes that are generalizable to a
The first objective of the study was to detect on the one hand differences in males and
females concerning the consumption of High Energy Drinks and on the other hand in the
underlying determinants attitude, subjective norm and prototype perceptions. When looking at
the differences in High Energy Drinking Consumption in males and females, the outcomes are
in line with findings in previous studies, namely that men tend to consume more energy drinks
than women (Dillon et. al, 2019; Miller, 2010). Possible reasons for that might be on the one
side that males compared to females tend to have a style of living that is rather unhealthy
(Courtenay, 2000). On the other side, a study conducted by Wimer and Levant (2013), found
that the consumption of Energy Drinks has a strong association with a “traditional masculinity
ideology and risk taking” (Wimer & Levant, 2013). As already examined by Poulos and Pasch
(2015), future research should focus on detecting triggers and causes leading to the
consumption of Energy Drinks in males (Poulos & Pasch, 2015). After detecting these,
interventions could be focused on showing consumers coping strategies, they can use to
overcome times of cravings for Energy Drinks. Nevertheless, this outcome of the study could
be already used in interventions focusing on providing the consumer with healthier Drink
options and alternatives instead of drinking Energy Drinks.
When focusing on gender differences in the underlying determinants of HED
consumption, it can be concluded that males generally had a more positive attitude towards
Energy Drinks. This was in line with what was expected based on the study of Roberson (2005)
who found that men tend to consume Energy Drinks in order to “enhance their sense of their
own masculinity or their masculine image to others” (Roberson, 2005). Interestingly,in spite
of a more positive attitude, males compared to females were more aware of the disadvantages
of Energy Drinks, namely the potential risks of Energy Drinks on one’s health. This was
unexpected and contradicts with previous findings that showed that people generally lack
awareness about the negative sides of Energy Drinks (O’Dea, 2003; Ward, 2009). Nevertheless,
a study conducted by Wards (2009) concluded that young people who had a negative attitude
perceiving and being more aware of disadvantages might not be a reason for stopping to
consume Energy Drinks. A possible explanation for this could be related to the outcomes of the
study conducted by Kim, Jeon, Shim, and Seo (2015), who analysed the level of knowledge in
both genders concerning Energy Drinks. Knowledge in their study was defined as “The level
of basic knowledge of energy drinks, including the recommended daily consumption amount
and the caffeine content”. The outcomes of that study showed that males had more knowledge
about these aspects of Energy Drinks which might be a possible explanation for the higher level
of awareness of the disadvantages in males than in females. An additional explanation for such
a level of perceived disadvantage in spite of a high level of consumption in males are the
commercialisation strategies that are specially targeted to males and thus trigger and make them
curious about the effectiveness of Energy Drinks (Kim, Jeon, Shim, & Seo, 2015). Hence,
further research should focus on determining possible reasons for the perceived disadvantages
in spite of the consumption of Energy Drinks and the positive attitude towards these Drinks.
Nevertheless, based on these outcomes of the study, it is recommended, especially in order to
reduce the positive attitude, to make interventions focused on promoting healthy behaviours
and habits and educating people about the health risks of these Drinks. Moreover, due to the
huge impact of commercialization strategies triggering the curiosity in people to consume such
Drinks, it is recommended that Energy Drink Brands should make the consumers aware during
the marketing of their Drinks of the health risks and side effects, as it is the case for example in
the marketing of cigarettes. The success of implementing such a recommendation can be found
in the USA, where adding the health risks on the labels of Energy Drinks, led to an important
decline in one’s willingness to consume such drinks (Ward, 2009).
The second objective of the study was to examine to what extent the consumption of
HED is predicted by the variables of the PWM and which variables are the most important.
First of all, the outcomes showed that all variables of the PWM, despite prototype perception
negative correlated to different extents with the risk behaviour, intention, and willingness. This
expected. A possible explanation for that could be that the predictability and usability of the
PWM vary depending on the risk behaviour, showing the highest level of explanation in the
risk behaviour of alcohol drinking (Todd, Kothe, Mullan, & Monds, 2006). Next to this, the
outcomes of the study showed that especially intention, as the variable that showed to have the
highest level of importance, and additionally willingness and attitude direct, were the most
important variables in showing a significant amount of association with the consumption of
High Energy Drinks. These findings seem to contradict the expectation that was based on the
outcomes of the study conducted by Armenta, Hautala, and Whitbeck (2015), that used the
PWM for predicting alcohol consumption. This study determined the variables subjective
norms and positive prototype perceptions as having the most impact on one’s expectations
regarding the consumption in both genders. One possible explanation for this is that there are
despite the similarities between Energy and Alcohol Drinking, several differences that could
affect these variables. Moreover, the sample of the study of Armenta, Hautala, and Whitbeck
(2015) included only adolescents from ages 12 to 14 years. Hence there were differences in the
age group of the sample and thus consequently might led to a certain level of variation in the
answers given by the people according to their age and experiences. So, this which could be an
explanation for the differences in the underlying determinants too. Additionally, it was expected
that willingness would be a stronger predictor than intention for the consumption of Energy
Drinks (Dal Cin et. al, 2009), which contradicts with the outcomes of this study. A possible
explanation for this comes from Shek and Zhu (2018), who examined that younger people tend
to have a higher level of behavioural intention to conduct risk behaviours due to gaps in moral
expertise, which gets improved with increasing age (Shek & Zhu, 2018). Hence, the fact that
the far majority of the participants were between 18-30 years of age is additional support for
this explanation. In addition to that, a previous study conducted by Todd and Mullan (2011),
emphasized the predictive role of intention on risk behaviours and these can be based on a
planned behaviour (Todd & Mullan, 2011). Thus, a recommendation for future research would
similarity between the characteristics of the participants that would additionally enhance the
generalizability of the outcomes according to a targeted sample.
The third objective of the study was to examine if High Energy Drinking is explained
by different determinants of the variables of the PWM in males than in females. The outcomes
indicated that besides the fact that Intention was the strongest predictor for High Energy
Drinking in both genders, attitude direct was an additional significant predictor for the risk
behaviour in females, but not in males. This outcome was not as expected and not in line with
previous findings, that examined attitude as a significant predictor in males, due to higher
consumption and a generally more positive attitude towards Energy Drinks compared to
females (Douglas & Nkporbu, 2018; Thorlton & Collins, 2017). A possible explanation comes
from Mahboub, Al Malki, and Al Malki (2017), who examined that “factors predicting healthy
behavior restricting ED consumption were negative attitude towards ED”. Hence, even though
the study outcomes did not show a significantly negative attitude of females, females had a less
positive attitude towards Energy Drinks and lower level of consumption of these Drinks
compared to males which might have an impact on the dominance of attitude in females.
Moreover, several studies show that females are more risk averse than males (Carter, Franco,
& Gine, 2017) which might associate with their attitude that has a significant relation with the
risk behaviour. Nevertheless, further research is needed to detect reasons for attitude being a
significant predictor of High Energy Drinking in females. Besides that, this outcome of the
study opens doors for further research based on the fact that it contradicts with the usual theory
of the PWM which says that intention and willingness are direct predictors of a risky behaviour
(see Figure 1). Hence, when taking this into account, it could be considered for conducting
further research with the PWM concerning HED. Next to this, generally working on the Model
or even modifying the relations in the variables could be an additional recommendation, due to
the fact that the model was constructed in 1998 and thus might need some adjustments
5. Strengths and Limitations
A main strength of this study are the self-constructed instruments that are highly reliable,
according to the Cronbach’s Alpha scores of the variables of the PWM. This emphasizes that
the instruments consistently measured what they were supposed to measure. Furthermore,
studies that made use of the Prototype Willingness Model to analyse risk behaviours were
generally focused on smoking (Sommer Hukkelberg & Dykstra, 2008), alcohol consumption
(Armenta, Hautala &Whitbeck, 2015) or sexual behaviour (Walrave et al., 2015), which
underlines the existing gap in research focused on Energy Drinking consumption. Based on
this, the outcomes of this study would contribute to further researches in that area by making
use of the Prototype Willingness Model.
A salient limitation of this study is the small number of High Energy Drinkers compared
to the majority of participants who were No Energy Drinkers, which decreases the
representativeness and generalizability of the outcomes of this sample for the larger population
of Energy Drink consumers. Furthermore, the huge variation in age, namely including and
comparing participants between 14-75 years, additionally decreases the generalizability of the
study outcomes due to the fact that there is not a specific target group or age span given, that
includes for example only adolescents, which are main consumers of Energy Drinks (Thorlton
& Collins, 2017).
6. Recommendations
Based on the limitations, there are some improvement points regarding the study. First of all,
it would be more appropriate to repeat the study with a specific age group or age span, for
example, adolescents, who are a main target group of Energy Drinkers. This would help to
have a sample that includes more High Energy Drinkers and to get outcomes that are
Next to this, there is need for further research referring to several parts of the study in
order to develop and conduct useful and successful interventions. First of all, there is need to
focus in future research on the reasons that lead to the high consumption of Energy Drinks in
males. Then, based on the detected reasons, interventions could focus on coping strategies
that help consumers overcome for example moments of cravings for Energy Drinks.
Nevertheless, the outcomes of the study can already be used to develop interventions where
consumers would be provided with healthier drink options instead of Energy Drinks.
Moreover, there should be an additional emphasis on educating people about the health risks
and side effects of these drinks, in order to decrease the positive attitude towards Energy
Drinks. Next to this, due to the huge external impact of marketing strategies of Energy Drink
brands on the consumption of Energy Drinks, it is recommended to label on the products the
risks that are related to the consumption of these Drinks. This could make the consumers
more aware of the health risks and might consequently lead to a reduction in their Energy
Drink intake.
7. Conclusion
In conclusion, the results of the current study showed that first of all men consumed more
energy drinks than females and that there were more male High Energy Drinkers than females.
Regarding gender differences in the underlying determinants of the PWM for HED, it can be
concluded that males had a more positive attitude and simultaneously perceived more
disadvantages regarding Energy Drinks and the consumption than females. There were no
significant gender differences in the variable’s subjective norm and prototype perceptions.
Concerning the reasoned pathway of the PWM, the variables attitude direct and intention were
the important predictors for High Energy Drinking behaviour. In the social reactive pathway,
the variables attitude direct and willingness showed the highest level of explanation for the risk
behaviour. Nevertheless, a main gender difference was visible in females, where attitude direct
all, intention was the most important predictor variable for HED in both genders. It was
recommended, to educate people through interventions or awareness programs that are focused
on the health risks of Energy Drinks. This could be additionally done by working on the
marketing strategies, that are remarkable triggers for the purchasing and consequently
consumption of these drinks. Hence, adjusting warning labels might be useful in order to
increase the awareness of the consumers towards the risks of these drinks concerning their
health which would be an important step towards a reduction in the consumption of such drinks.
Moreover, presenting Energy Drink consumers with healthier drink options could help in
decreasing the Energy Drink intake too.
8. Acknowledgments
I would like to thank my first supervisor Dr. Stans Drossaert, my second supervisor Dr.
Marcel E. Pieterse, and Nienke J. Peeters for the assistance and support throughout the
References
Alsunni, A.A & Badar, A. (2011). Energy drinks consumption pattern, perceived benefits and
associated adverse effects amongst students of university of Dammam, Saudi arabia. J Ayub Med Coll Abbottabad, 23(3), 3-9
Armenta, B.E., Hautala, D.S., & Whitbeck, L.B. (2015). The utility of the
prototype/willingness model in predicting alcohol use among North American
indigenous adolescents. Developmental Psychology, 51(5), 697-705. Doi: 10.1037/a0038978
Azagba S., Langille D., & Asbridge M. (2014). An emerging adolescent health risk:
caffeinated energy drink consumption patterns among high school students. Prev
Med (2014) 62:54–9. doi:10.1016/j.ypmed.2014.01.019
Bigard, A.X. (2010). Archives de Pediatrie: Organce Officiel de la Societe Francaise de
Pediatrie, 17(11). pp. 1625-1631. Doi: 10.1016/j.arcped.2010.08.001
Bulut, B., Beyhun, N.E., Topbas, M., & Can, G. (2014). Energy drink use in university
students and associated factors. Journal of Community Health, 39(5), 1004-1011. Doi:
10.1007/s10900-014-9849-3.
Carter, M. E., Franco, F., & Gine, M. (2017). Executive gender pay gaps: the roles of female
risk aversion and board representation. Contemporary Acounting Research, 34(2),
1232-1264. Doi: 10.111/1911-3846.12286
Courtenay, W.H. (2000). Constructions of masculinity and their influence on men’s
well-being: a theory of gender and health, Social Science & Medicine, 50(10), 1385-1401.
Conner, M., & Armitage, C. J. (1998). Extending the theory of planned behavior: A review
and avenues for further research. Journal of Applied Social Psychology, 28 (15),
1429-1464. Doi: 10.1111/j.1559-1816.1998.tb01685.x
Dal Cin, S., Worth, K.A., Gerrard, M., Stoolmiller, M., Sargent, J.D., Wills, T.A., & Gibbons,
F.X. (2009). Watching and drinking: expectancies, prototypes, and friends‘ alcohol
use mediate the effect of exposure to alcohol use in movies on adolescent
drinking. Health Psychology, 28(4), 473-483. Doi: 10.1037/a0014777.
Dewar, L. & Heuberger, R. (2017). The effect of acute caffeine intake on insulin sensitivity
and glycemic control in people with diabetes. Diabetes & Metabolic Syndrome, 11(2),
631-635. Doi: 10.1016/j.dsx.2017.04.017
Dieterich, S.E., Stanley, L.R., Swaim, R.C., & Beauvais, F. (2013). Outcome expectancies,
descriptive norms, and alcohol use: American Indian and white adolescents. The Journal of Primary Prevention, 34, 209-219. Doi: 10.1007/s10935-013-0311-6 Dillon, P., Kelpin, S., Kendler, K., Thacker, L., Dick, D., & Svikis, D. (2019). Gender
differences in any-source caffeine and energy drink use and associated adverse health
behaviors. Journal of Caffeine and Adenosine Research. Doi: 10.1089/caff.2018.0008
Douglas, K.E. & Nkporbu, A.K (2018). Energy drink consumption among medical and dental
students at the university of Port Harcourt, Nigeria. International Journal of Medical
Science and Health Research, 2(4). 149-168.
Elliott, M.A., McCartan, R., Brewster, S.E., Coyle, D., Emerson, L., & Gibson, K. (2017). An
application of the prototype willingness model to drivers‘ speeding behaviour.
European Journal of Social Psychology, 47(6). Doi: 10.1002/ejsp.2268
Gerrard, M., Gibbons, F.X., Reis-Bergan, M., Trudeau, L., Vande Lune, L.S., & Buunk, B. (
2002). Inhibitory effects of drinker and nondrinker prototyper on adolescent alcohol
consumption. Healthy Psychology, 21(6), 601-609. Doi: 10.1037/0278-6133.21.6.601
Gerrard, M., Gibbons, F.X., Stock, M.L., Vande Lune, L.S., & Cleveland, M.J. (2005).
Pre-adolescents: An Application of the Prototype/Willingness Model of Adolescent Health
Risk Behavior To Smoking Initiation. Journal of Pediatric Psychology, 30(4),
305-318. Doi: 10.1093/jpepsy/jsi026
Gibbons, F. X., Gerrard, M., Blanton, H., & Russell, D. W. (1998). Reasoned action and
social reaction: Willingness and intention as independent predictors of health risk. Journal of Personality and Social Psychology, 74(5), 1164-1180. Doi: 10.1037/0022-3514.74.5.1164
Gibbons, F. X., Gerrard, M., & McCoy, S. B. (1995). Prototype perception predicts (lack of)
pregnancy prevention. Personality and Social Psychology Bulletin, 21(1), 85-93. doi: 10.1177/0146167295211009
Gunja, N. & Brown, J. A. (2012). Energy drinks: health risks and toxicity. The Medical Journal of Australia, 196(1), 46-49. Doi: 10.5694/mja11.10838
Hamilton, H.A., Boak, A., Illie, G., & Mann, R.E. (2013). Energy drink consumption and
associations with demographic characteristics, drug use and injury among adolescents.
Can J Public Health, 104(7), 496-501. Doi: 10.17269/cjph.104.3998
Hammer, J.H. & Vogel, D.L. (2013). Assessing the utility of the Willingness/Prototype
Model in Predicting Help-Seeking Decisions. Journal of Counselling Psychology, 60(1), 83-97. Doi: 10.1037/a0030449
Jacob, S., Tambawel, J., Mohammed Trooshi, F., & Alkhoury, Y. (2013). Consumption
pattern of nutritional health drinks and energy drinks among University students in
Ajman, UAE. Gulf Medical Journal, 2(1), 22-26
Jean, G. (2017). How can we restrict the sale of sports and energy drinks to children? A