The influence of soil texture on the course
of volume changes of soil
Andrej Tall*, Branislav Kandra, Milan Gomboš, Dana Pavelková
Institute of Hydrology of the Slovak Academy of Sciences, Bratislava, Slovakia *Corresponding author: [email protected]
Citation: Tall A., Kandra B., Gomboš M., Pavelková D. (2019): The influence of soil texture on the course of volume changes of soil. Soil & Water Res., 14: 57−66.
Abstract: Volume changes of soil associated with soil moisture changes are caused by the presence of clay minerals from illite and montmorillonite groups. Clay minerals are found in the so-called clay soil component which can be quantified by laboratory analysis of the soil particle-size distribution. Consequently, the potential for volume changes in soil can be assessed from soil texture. In our study, 172 soil samples with different textures were used to measure dependencies between volume changes in soil and changes in soil moisture under laboratory conditions. The samp-les were collected from 11 sites in the Eastern Slovak Lowland. On the basis of the measurements, 10 mathematical models were created to compute the correlation between volume changes of soil and soil moisture content and tex-ture. The highest accuracy was obtained with the model which assumes the content of particles < 0.002 mm. When comparing the clay particles < 0.001 mm (colloidal clay) with the particles < 0.002 mm (colloidal + physical clay) it was also found that the particles < 0.002 mm have a larger impact on the volume changes of soil than the particles < 0.001. The inclusion of particles > 0.002 mm (silt + sand) into the models resulted in either no or only negligible refinement of the soil volume change calculations.
Keywords: clay particles; shrinking soil; soil moisture
Supported by the Research & Development Operational Programme funded by the ERDF, Project Centre of excellence for the integrated river basin management in the changing environmental conditions, ITMS code 26220120062 and by the Ministry of Education, Science, Research and Sport of the Slovak Republic, Project VEGA 2/0062/16.
From the hydrological point of view, heavy to ex-tremely heavy soils have specific properties. They contain a high proportion of the clay component characterized by the ability to change its volume during wetting and drying processes. Volume changes significantly affect transport processes in the soil pro-file and soil water regime. Expansive soils change the pore structure during wetting and drying processes, which results in varying hydrological conditions of water flow and substance transport (Philip 1969; Kim et al. 1992; Lu et al. 2004). In fact, the amount of volume change reflects the degree of structural changes occurring in soil. Volume changes of heavy soils can be considerably higher than volume changes of soils with a low clay content or heavy soils with a substantial amount of larger non-clay particles
Peng etal. 2007). Another important indicator of volume changes is the shrinkage geometry factor rs. The shrinkage geometry factor rs divides the volume change of the soil matrix into the horizontal section (contribution of cracks) and the vertical section (soil subsidence). Knowledge of this factor is important for the consideration of water and solute transport in expansive soils (Bronswijk 1988, 1989, 1990, 1991). The degree of soil shrinkage can be quanti-fied from the change of the original sample length at different soil moisture contents (Schafer & Singer 1976; Parker et. al. 1977; Tall & Gomboš 2013; Estabragh etal. 2015).
Orfánus et al. (2016) reported the effect of vol-ume changes of heavy soils on the mathematical modeling of water content in soil at the field scale, and the simulated values were overvalued compared to the measured ones.
Clay minerals are formed by weathering processes, but also by hydrothermal decomposition of silicate minerals, especially feldspars. From the mineralogi-cal point of view, they are Al – silicates, in which different cations, in particular Ca, Fe, Mg, K and Na, are present in a different quantity. They are often transported as colloidal phases. In nature, they oc-cur in the form of easily disintegrable earthy matter. According to the mutual arrangement of their basic building units (silicon tetrahedron and aluminum octahedron) and the presence of interfacial cat-ions, clay minerals can be classified into four main groups: (i) kaolin group (kaolinite, dickite, nacrite, halloysite, allophane) – the ratio of tetrahedral and octahedral components is 1 : 1 (double layer); (ii ) il-lite (or mica mineral) group – (il) il-lite, glauconite, muscovite, biotite) – between two layers of silicon tetrahedra is a layer of aluminum (or potassium) octahedra (2 : 1 layer type); (iii) montmorillonite (or smectite) group (montmorillonite, nontronite, saponite) – triple layer similar to the illite group, but instead of K, occur Ca and Na; (iv) vermiculite group (vermiculite) – they form the same three-layer as the previous, but contain Mg.
The clay minerals are composed of plate-shaped particles ranging from 1 (montmorillonite) to theo-retically unlimited number (kaolinite). Individual plates have a very low thickness (0.5–1 nm) and a high specific surface area (15 m2/g – kaolinite;
80 m2/g – ilite; 800 m2/g – montmorillonite). The
size of the specific surface of these plates is closely related to the size of the volume changes (Ross 1978). The larger the specific surface, the greater the
abil-ity to swell. The surface of the clay minerals plates carries a negative electrical charge that can attract water molecules. As a result of this phenomenon, the crystals of some clay minerals have the ability to bind in their structure the varying water content. With the increasing water content swelling of such a clay occurs. When dryed, they regain its original volume. The ability of clay minerals to assimilate water into their structure and thus increase their volume is different: (i) kaolin group – is relatively inactive (the low ability to bind the water has only the hallozite); (ii) illite group – has low to moderate swelling ability; (iii) montmorillonite group – very expansiv group (especially montmorillonite).
Under natural conditions, clay minerals never occur in pure form, but they form mixed structures formed by several types of clay but also other min-erals. In the literature, the generic term clay, which is often identified with clay minerals, is sometimes used. The term clay is used to designate a material whose particle size is less than 0.002 mm, and also for the predominantly clay minerals (Velde 1995).
The rate of soil volume changes depends on the type of clay mineral (exchange capacity and binding capacity) and on the content of clay minerals which form the clay component of soil.
This issue was investigated in the area of Eastern Slovak Lowlands (ESL). From a geological point of view, the ESL is composed of neogenic and quaternary sediments. From the small-scale studies on the deter-mination of the type of clay minerals at ESL results that clay minerals of the montmorillonite and partly of the illite group predominate (Shrbená & Lhotský 1976; Čurlík 1977). The authors of the paper related on the hypothesis that the type of clay minerals does not change over time at ESL. The content of the clay component (without the determination of the type of clay minerals) can be easily quantified by the
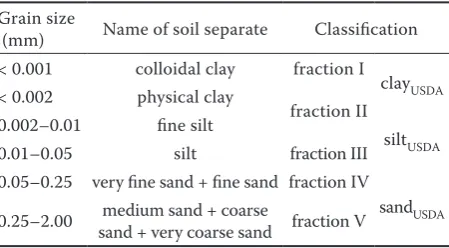
particle-Table 1. Soil classifications used
Grain size
(mm) Name of soil separate Classification < 0.001 colloidal clay fraction I
clayUSDA < 0.002 physical clay
fraction II 0.002–0.01 fine silt
siltUSDA 0.01–0.05 silt fraction III
0.05–0.25 very fine sand + fine sand fraction IV
sandUSDA 0.25–2.00 sand + very coarse sand fraction Vmedium sand + coarse
[image:2.595.306.531.617.741.2]size analysis. According to the world-wide US Depart-ment of Agriculture (USDA) classification system, the content of the clay component is identical with clay, i.e. particles < 0.002 mm. Other separates include silt (0.002–0.05 mm) and sand (0.05–2.00 mm). In this case, the clay component is constituted by the mixture of colloidal clay (particle size < 0.001 mm) and the so-called physical clay (particle size 0.001–0.002 mm). In this study, another soil texture classification was used along with the USDA classification. It divides soil types according to five grain size fractions (Table 1). In the past, this classification was commonly used in former Czechoslovakia. It was chosen because of a 0.001 mm limit, which separates colloidal clay from physical clay.
According to the results of electron microscope measurements, the maximum size of clay particles ranges from 90 to 1900 μm (Nadeau 1985). The above mentioned upper limit of 1900 μm is close to the 0.002 mm (2000 μm) limit, which separates clay from silt in the USDA classification.
The aim of this study is to: (i) mathematically express the course of volumetric changes of soil in
relation to moisture and the clay component con-tent, (ii) identify which of the clay fractions (particle size < 0.002 or < 0.001 mm) has a larger impact on these changes, (iii) identify the degree of impact of other soil particle fractions on these changes in soil samples under laboratory measurement conditions.
MATERIAL AND METHODS
Sample collection and preparation. The soil was sampled in ESL, located in the east part of Slovakia. From the viewpoint of soil texture, the Lowland is characterized by a large variety of particle-size classes ranging from light sandy soils to heavy clay soils. The major part of the ESL territory is used for agricultural purposes. 11 sites were selected for soil sampling that account for as many soil types as possible. The situation of sampling sites is shown in Figure 1. A total of 172 undisturbed soil samples were taken using Kopecky rings with a constant volume of 100 cm3. Simultaneously, disturbed soil samples were
[image:3.595.58.528.97.248.2]taken with each soil core for the particle-size analy-sis. The sampling parameters are shown in Table 2.
[image:3.595.65.534.589.762.2]Figure 1. Map of the study area and sampling sites of the 172 soil samples
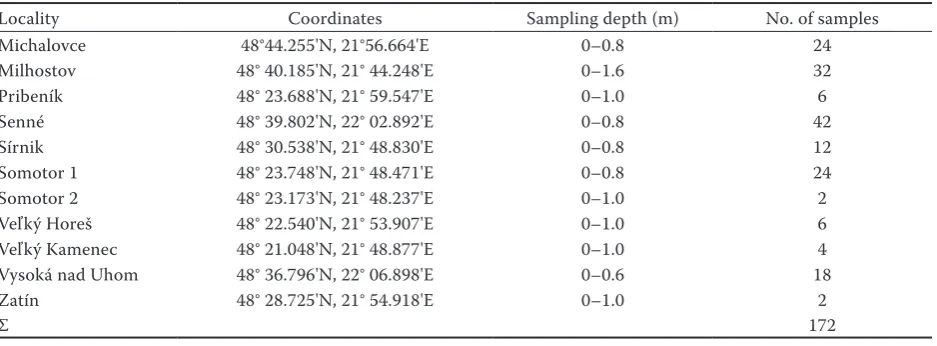
Table 2. Parameters of sampling sites
Locality Coordinates Sampling depth (m) No. of samples
Michalovce 48°44.255'N, 21°56.664'E 0–0.8 24
Milhostov 48° 40.185'N, 21° 44.248'E 0–1.6 32
Pribeník 48° 23.688'N, 21° 59.547'E 0–1.0 6
Senné 48° 39.802'N, 22° 02.892'E 0–0.8 42
Sírnik 48° 30.538'N, 21° 48.830'E 0–0.8 12
Somotor 1 48° 23.748'N, 21° 48.471'E 0–0.8 24
Somotor 2 48° 23.173'N, 21° 48.237'E 0–1.0 2
Veľký Horeš 48° 22.540'N, 21° 53.907'E 0–1.0 6
Veľký Kamenec 48° 21.048'N, 21° 48.877'E 0–1.0 4
Vysoká nad Uhom 48° 36.796'N, 22° 06.898'E 0–0.6 18
Zatín 48° 28.725'N, 21° 54.918'E 0–1.0 2
Σ 172
Sampling site Eastern Slovakia lowland International boundary
All collected soil cores were saturated to full water capacity in the laboratory. Saturation was completed when the soil cores reached a constant weight.
Laboratory measurements. The hydrometer mea-surement method was used to determine the soil texture of the disturbed soil samples in the laboratory. According to the particle-size analysis results, the examined soils were classified into five fractions according to the par-ticle size (2.00–0.25, 0.25–0.05, 0.05–0.01, 0.01–0.001 and < 0.001 mm). Simultaneously, the USDA classifi-cation (clayUSDA) was used (sand 2.00–0.05 mm, silt 0.05–0.002 mm and clay < 0.002 mm).
Undisturbed soil samples were weighed after satura-tion and then slowly dried at 20°C in the laboratory. During the drying process, soil core volumes and masses were measured at irregular intervals. The volume measurement was performed by measuring the soil core height and diameter using a slide caliper, and each dimension was measured twice (in perpen-dicular directions). Mean values were computed from the heights and diameters of soil cores, and soil core volumes were calculated. The drying time of soil
cores at 20°C varied for different soils and lasted from about 3–4 days for sandy soils to about 3–4 weeks for clay soils. Finally, all soil cores were dried up in a laboratory drier at 105°C to a constant weight. Altogether, 1386 volume and weight measurements were taken using 172 soil samples, i.e., an average of about 8 measurements per soil sample were made.
Data analysis. First, volumetric water content of the samples was computed from 1386 measured weight and volume values of the soil samples:
where:
Θ – volumetric water content of soil (%)
Vw – volume of water (m3)
Vt – volume of soil (m3)
[image:4.595.64.540.415.744.2]Then, the volume changes ΔV (%) were computed as percentage changes in volume compared to the volume of saturated samples. Thus, the dependence of the volume change ΔV on the volumetric water content Θ was obtained for all 172 soils samples.
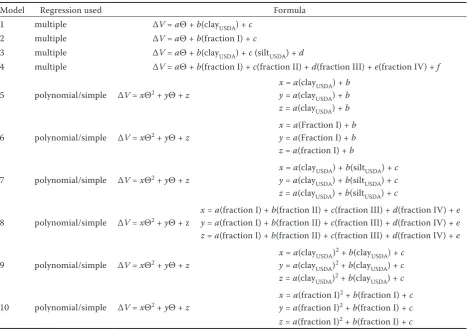
Table 3. Conceptions of mathematical models for computing soil volume change (ΔV) from volumetric water content (Θ) and soil texture (all parameters are in %)
Model Regression used Formula
1 multiple ΔV = aΘ + b(clayUSDA) + c 2 multiple ΔV = aΘ + b(fraction I) + c
3 multiple ΔV = aΘ + b(clayUSDA) + c (siltUSDA) + d
4 multiple ΔV = aΘ + b(fraction I) + c(fraction II) + d(fraction III) + e(fraction IV) + f
5 polynomial/simple ΔV = xΘ2 + yΘ + z yx = = aa(clay(clayUSDA) + b USDA) + b
z = a(clayUSDA) + b
6 polynomial/simple ΔV = xΘ2 + yΘ + z xy = = aa(Fraction I) + (Fraction I) + bb
z = a(fraction I) + b
7 polynomial/simple ΔV = xΘ2 + yΘ + z yx = = aa(clay(clayUSDA) + b(siltUSDA) + c USDA) + b(siltUSDA) + c
z = a(clayUSDA) + b(siltUSDA) + c
8 polynomial/simple ΔV = xΘ2 + yΘ +z xy = = aa(fraction I) + (fraction I) + bb(fraction II) + (fraction II) + cc(fraction III) + (fraction III) + dd(fraction IV) + (fraction IV) + ee
z = a(fraction I) + b(fraction II) + c(fraction III) + d(fraction IV) + e
9 polynomial/simple ΔV = xΘ2 + yΘ + z x = a(clayUSDA)
2 + b(clay USDA) + c
y = a(clayUSDA)2 + b(clayUSDA) + c
z = a(clayUSDA)2 + b(clayUSDA) + c
10 polynomial/simple ΔV = xΘ2 + yΘ + z x = a(fraction I)
2 + b(fraction I) + c
y = a(fraction I)2 + b(fraction I) + c
z = a(fraction I)2 + b(fraction I) + c
USDA – US Department of Agriculture classification system
w
t
Θ V 1 00
V
Then, the total data set (172 samples) was divided into two parts according to the soil sample textures. Three quarters of data (129 samples) were used to create dependence models of ΔV on Θ and soil texture. The remaining quarter of data (43 samples) was used to validate the obtained models.
10 mathematical models to compute ΔV in relation to Θ and soil texture were developed. Four models were created by multiple regression and six models were created by polynomial regression in combina-tion with linear, multiple and polynomial regression (Table 3). All models as well as the statistical parts of this study were obtained using the Statgraphics Centurion XV software (Ver. 15.1.02, 2006).
RESULTS AND DISCUSSION
Course of dependence of the soil volume changes on volumetric water content changes. The measurement data set (129 samples) was examined to determine the course of dependence of ΔV on Θ. According to the measurement results, the course of this dependence copies the curve, the shape of which is mathematically expressed by the second order polynomial, as follows: ΔV = aΘ2 + bΘ + c. The typical form of this curve
illustrating the sample taken from the site Senné is shown in Figure 2. This example shows the sample with the highest measured content of the clay component (69.13% clayUSDA), which also showed the highest volume
change (ΔV = 46.78%). With the decrease of the clay content in the samples, the value gradually decreased to zero, when the zero volume change was measured on the soil sample (a = b = c = 0 => ΔV = 0).
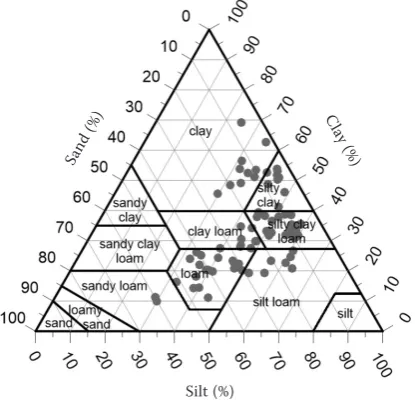
The clay component content in the examined data set ranged from min 9.89% clayUSDA (or 8.78% in fraction I) to max 69.13% clayUSDA (or 66.71% in fraction I). The results of the texture analysis of all
soil samples are shown in Figure 3. The Θ values ranged within the interval from 0 to 61.62% and the ΔV value ranged within the interval from 0 to 46.78%.
Mathematical expression of the course of volume changes of soils in relation to soil moisture and clay content. On the basis of the obtained courses of dependence of ΔV on Θ using 129 soil samples, 10 mathematical models were developed to calculate ΔV depending on Θ and soil texture (Table 4). All models show a very high degree of correlation as the coefficient of determination values R2 are within
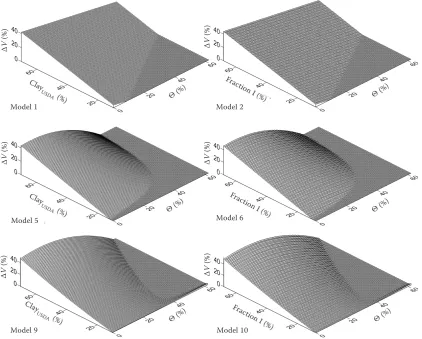
the interval from 0.808 to 0.914. The lowest correla-tion rate was demonstrated by the models created by multiple regressions (models 1 to 4). The best correlation was obtained with the models created by the combination of two polynomial regressions of the second order (models 9 and 10). The mean absolute error (MAE) values ranged between 2.30 and 3.13%. The MAE values also confirmed the highest accuracy of models 9 and 10 and the lowest accuracy of models 1 to 4. Figure 4 shows the selected models (1, 2, 5, 6, 9 and 10) in the spatial view.
Figure 5 shows the correlation coefficients or MAE values for all models when dividing data into three intervals according to the clayUSDA content (or frac-tion I). It applies to all models that the correlafrac-tion increases with the increase of the clay fraction. The MAE values rise with the increase of the clay fraction.
[image:5.595.310.518.524.725.2]According to the above results it can be generally stated that from among ten submitted models, model 9 seems to be the most reliable for calculating ΔV in rela-tion to Θ and soil texture. This model is created by the
Figure 2. The typical course of relationship between volume change of soil and volumetric water content of soil (example from measurements on soil from the site Senné)
Figure 3. Distribution of soil textures of the 172 soil samples in the USDA textural triangle
Δ
V
(%)
Θ (%)
0 20 40 60 60
40
20
measurements polynomial trend
y = −0.019x2 + 0.456x + 42.205 R2 = 0.99
Silt (%)
[image:5.595.77.281.592.709.2]Table 4. Proposals of mathematical models for computing soil volume change (ΔV) from volumetric water content (Θ) and soil texture (all parameters are in %)
Model Formula R2 MAE
1 ΔV = –0.403Θ + 0.637(clayUSDA) – 2.573 0.822 3.22
2 ΔV = –0.404Θ + 0.665(fraction I) – 1.324 0.808 3.39
3 ΔV = –0.402Θ + 0.640(clayUSDA) + 0.016(siltUSDA) – 3.423 0.823 3.21
4 ΔV = –0.404Θ + 0.297(fraction I) – 0.212(fraction II) – 0.358(fraction III) – 0.340(fraction IV) + 30.160 0.828 3.15 5 ΔV = (–0.0004 (clayUSDA) + 0.004)Θ2 + (0.006(clay
USDA) – 0.183) Θ + 0.746(clayUSDA) – 9.025 0.871 2.70
6 ΔV = (–0.0004(fraction I) + 0.003)Θ2 + (0.007(fraction I) – 0.181) Θ + 0.796(fraction I) – 8.059 0.868 2.80
7 ΔV = (–0.0006(clayUSDA) – 0.00003(siltUSDA) + 0.005)Θ2 + (0.006(clayUSDA) – 0.0008(siltUSDA) –
0.143) Θ + 0.744(clayUSDA) – 0.008(siltUSDA) – 8.598“ 0.874 2.71
8 ΔV = (–0.0002(fraction I) + 0.0002(fraction II) + 0.0002(fraction III) + 0.0002(fraction IV) – 0.016)Θ
2 +
+ (0.010(fraction I) + 0.004(fraction II) + 0.002(fraction III) + 0.004(fraction IV) – 0.499)Θ +
+ 0.350(fraction I) – 0.256(fraction II) – 0.436(fraction III) – 0.393(fraction IV) + 29.907“ 0.893 2.32
9 ΔV = (0.0000006(clayUSDA)2 – 0.0004(clayUSDA) + 0.004)Θ2 + (0.0002(clayUSDA)2 – 0.010(clayUSDA) +
+ 0.078) Θ + 0.004(clayUSDA)2 + 0.473(clayUSDA) – 4.714“ 0.914 2.30
10 Δ – 0.008(fraction I) + 0.030)Θ + 0.003(fraction I)V = (0.000002(fraction I)2 – 0.0005(fraction I) + 0.005)Θ2 + 0.608(fraction I) – 5.353“2 + (0.0002(fraction I)2 – 0.903 2.49
*if ΔV < 0, then ΔV is considered to be zero; USDA – US Department of Agriculture classification system; MAE − mean ab-solute error
Figure 4. Spatial view of selected models for calculating the volume change of soil from the volumetric water content of soil and from soil texture
Δ
V
(%)
Θ (%)
Model 1 Model 2
Model 5 Model 6
Model 9 Model 10
Δ
V
(%)
Δ
V
(%)
Δ
V
(%)
Δ
V
(%)
Δ
V
(%)
Θ (%)
Θ (%)
Θ (%)
Θ (%) Θ (%)
Fraction I (%) Clay
USDA (%)
Clay
USDA (%)
Clay
USDA (%)
Fraction I (%)
[image:6.595.88.511.384.723.2]combination of two polynomial regressions of the second order and is based on the clayUSDA content.
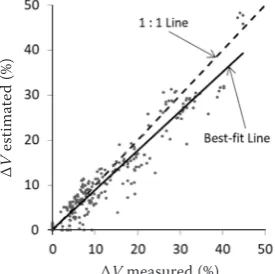
The calibration of models using a quarter of calibra-tion samples (276 measurements on 43 soil samples) is shown in Table 5 and Figure 6. The calibration confirmed the highest accuracy of model 9 (R2 = 0.917;
MAE = 2.45%).
Comparison of the effect of two clay fractions on the amount of volume changes. Two clay fractions were compared: clayUSDA (particle size < 0.002 mm) and fraction I (particle size < 0.001 mm). Three of the examined modules are based on clayUSDA (mod-els 1, 5 and 9); and analogically, three mod(mod-els are
based on fraction I (models 2, 6 and 10). The com-parison results are shown in Figure 7. In each of the three compared pairs of models, the model based on content of clayUSDA proved to be more accurate. Based on the above results, the content of particles < 0.002 mm (clayUSDA) has a larger impact on the soil volume changes than the content of particles < 0.001 mm (fraction I). Thus, in addition to col-loidal clay (particles < 0.001 mm), the physical clay particles (particles between 0.001 and 0.002 mm) are partly involved in the volume changes of soils.
The influence of other grain fractions on the amount of volume changes. The results of
measur-Table 5. Statistics for soil volume change (ΔV) estimated vs. ΔV measured (for the 276 calibrating measurements)
Model Slope Intercept R2 MAE
1 0.70 3.476 0.815 3.55
2 0.69 3.677 0.791 3.73
3 0.70 3.496 0.816 3.54
4 0.71 3.571 0.810 3.50
5 0.86 0.307 0.907 2.60
6 0.86 0.401 0.895 2.74
7 0.86 0.235 0.908 2.60
8 0.87 0.578 0.905 2.43
9 0.88 0.191 0.917 2.45
10 0.87 0.368 0.898 2.70
[image:7.595.131.462.95.321.2]MAE – mean absolute error
Figure 5. Coefficients of determination (R2) and the mean-absolute-errors (MAE) values for all models when dividing
data into three intervals according to the clay USDA (or fraction I) content
M
AE
40−70%
R
2
20−40% 0−20%
Figure 6. Volume changes of soil calculated vs. volume change of soil measured (for the 276 calibrating measure-ments); the best-fit line has a slope of 0.88 and intercept is 0.191
Δ
V
e
stima
te
d (%)
[image:7.595.344.482.560.697.2] [image:7.595.63.292.585.742.2]ing the impact of soil particles larger than 0.002 mm, or larger than 0.001 mm on the amount of volume changes of soils are shown in Figure 8. The results for models based on the USDA classification (models 1, 3, 5 and 7) are different from the results for models based fractions I to IV (models 2, 4, 6 and 8). In the case of the USDA classification based models, after adding another fraction (silt), their reliability increased only slightly – values R2 and MAE are almost identical. The
situation in fraction I–IV based models is different.
The reliability of models increased remarkably after adding fractions II–IV to fraction I. This difference can be explained by the fact that clay USDA includes the entire soil clay component (colloidal + physical clay), whereas fraction I includes only colloidal clay. By add-ing fractions II–IV to fraction I, computadd-ing includes also physical clay contained in fraction II, which also affects volume changes of soil (as found above).
[image:8.595.113.476.94.256.2]Based on the above results, it can be stated that the presence of clay particles smaller than 0.002 mm
Figure 8. Comparison of the influence of soil particles larger than 0.002 mm or greater than 0.001 mm on volume changes of soil
[image:8.595.137.464.441.721.2]MAE − mean absolute error
Figure 7. Comparison of the influence of two clay fractions on volume changes of soil
MAE − mean absolute error
R
2
Multiple Polynomial/ Polynomial/ regresion simple polynomial regresion regresion
USDA clay based fraction I based
M
AE
Multiple Polynomial/ Polynomial/ regresion simple polynomial regresion regresion
R
2
M
AE
Multiple Polynomial/ regresion simple (multiple) regresion
Multiple Polynomial/ regresion simple (multiple) regresion fraction I based
fraction I−IV based
R
2
M
AE
(colloidal + physical clay) has a significant impact on the volume changes of soils. Adding other soil grain fractions (larger than 0.002 mm) results in only negligible refinement of ΔV computing; therefore it does not have any significant practical implication.
CONCLUSIONS
The study presents the mathematical models for computing volume changes of soil on the basis of volumetric water content of and content of selected soil grain fractions. The models were proposed on the basis of laboratory measurements taken on undisturbed soil samples, which included measurements of soil volume changes related to the volumetric water content changes. Altogether, 1386 of individual measurements were taken on 172 undisturbed soil samples collected from 11 sites in the Eastern Slovak Lowland.
From among ten submitted models, the highest accuracy was demonstrated by the models based on the combination of polynomial regressions of the second order. When comparing the influence of two clay fractions (grain size < 0.001 mm and grain size < 0.002 mm) it was found that the fraction with the grain size < 0.002 mm has a larger impact on the soil volume changes. This fraction includes colloidal and physical clay.
The inclusion of particles > 0.002 mm (silt + sand) into the models resulted in either no or only negligible refinement of the soil volume change.
References
Bronswijk J.J.B. (1988): Modeling of water balance, crack-ing and subsidence of clay soils. Journal of Hydrology, 97: 199–212.
Bronswijk J.J.B. (1989): Prediction of actual cracking and subsidence in clay soils. Soil Science, 148: 87–93. Bronswijk J.J.B. (1990): Shrinkage geometry of a heavy clay
soil at various stresses. Soil Science Society of America Journal, 54: 1500–1502.
Bronswijk J.J.B. (1991): Relation between vertical soil move-ments and water-content changes in cracking clays. Soil Science Society of America Journal, 55: 1220–1226. Bronswijk J.J.B., Evers-Vermeer J.J. (1990): Shrinkage of
Dutch clay soil aggregates. Netherlands Journal of Agri-cultural Science, 38: 175–194.
Chertkov V.Y. (2003): Modelling the shrinkage curve of a soil clay pastes. Geoderma, 112: 71–95.
Cornelis W.M., Corluy J., Medina H., Hartmann R., Van Meirvenne M., Ruiz M.E. (2006): A simplified parametric
model to describe the magnitude and geometry of soil shrinkage. European Journal of Soil Science, 57: 258–268. Čurlík J. (1977): Pedographic-microscopic and Mineral-ogical Study of Slovak Soils. [PhD. Thesis] Bratislava, Comenius University in Bratislava, Faculty of Natural Sciences. (in Slovak)
Estabragh A.R., Moghadas M., Javadi A.A. (2015): Mechani-cal behavior of an expansive clay mixture during cycles of wetting and drying inundated with different quality of water. European Journal of Environmental and Civil Engineering, 19: 278–289.
Gebhardt S., Fleige H., Horn R. (2010): Shrinkage processes of a drained riparian peatland with subsidence morphol-ogy. Journal of Soils and Sediments, 10: 484–493. Gregory A.S., Bird N.R.A., Whalley W.R., Matthews G.P.,
Young M. (2010): Deformation and shrinkage effects on the soil water release characteristic. Soil Science Society of America Journal, 74: 1104–1112.
Kim D.J., Vereecken H., Feyen J., Boels D., Bronswijk J.J.B. (1992): On the characterization of properties of an unripe marine clay soil: II. A method on the determination of hydraulic-properties. Soil Science, 154: 59–71.
Lu D., Shao M., Horton R., Liu Ch. (2004): Effect of chang-ing bulk density durchang-ing water desorption measurement on soil hydraulic properties. Soil Science, 169: 319–329. McGarry D., Malafant K.W.J. (1987): The analysis of volume change in unconfined units of soil. Soil Science Society of America Journal, 51: 290–297.
Nadeau P.H. (1985): The physical dimensions of fundamen-tal clay particles. Clay Minerals, 20: 499–514.
Orfánus T., Stojkovová D., Nagy V., Németh T. (2016): Vari-ability of soil water content controlled by evapotranspira-tion and groundwater-root zone interacevapotranspira-tion. Archives of Agronomy and Soil Science, 62: 1602–1613.
Parker J.C., Amos D.F., Kaster D.L. (1977): An evaluation of several methods of estimating soil volume change. Soil Science Society of America Journal, 41: 1059–1064. Peng X., Horn R., Smucker A. (2007): Pore shrinkage de-pendency of inorganic and organic soils on wetting and drying cycles. Soil Science Society of America Journal, 71: 1095–1104.
Philip J.R. (1969): Hydrostatics and hydrodynamics in swell-ing soils. Water Resources Research, 5: 1070–1077. Ross G.J. (1978): Relationships of specific surface area and
clay content to shrink-swell potential of soils having dif-ferent clay mineralogical composition. Canadian Journal of Soil Science, 58: 159–166.
Shrbená B., Lhotský J. (1976): Classification of criteria of reduced fertility of important groups of heavy soils as a basis for effective melioration. In: Proc. ÚVTIZ – Me-liorace, Prague, ÚVTIZ: 93–102. (in Czech)
Tall A., Gomboš M. (2013): Regionalization of the area of Eastern Slovak Lowland according to the potential of volume changes of soils. Acta Hydrologica Slovaca, 14: 68–76. (in Slovak)
Velde B. (1995): Composition and mineralogy of clay min-erals. In: Origin and Mineralogy of Clays. New York, Springer: 8–42.