Mersmann A (1988) Design of crystallisers.Chemical En-gineering Process23: 213}228.
Mersmann A (1995) Crystallisation Technology Hand-book. New York: Marcel Dekker.
Meyerson AS (1993)Handbook of Industrial Crystallisa-tion. Boston: Butterworth Heinemann.
Mullin JW (1993) Crystallisation. Boston: Butterworth Heinemann.
Mumtaz HS, Hounslow, MJ, Seaton NA and Paterson WR (1997) Orthokinetic aggregation during precipitation: a computational model for calcium oxalate. Transac-tions of the IChemE75: 152}159.
Mutaftschiev B (1993) Nucleation theory. In: Hurle DTJ (ed.) Handbook of Crystal Growth, vol. 1A, pp. 187}247. Amsterdam: Elsevier.
Nicmanis M and Hounslow MJ (1998) Finite-element methods for steady-state population balance equations.
AIChE Journal44: 2258}2272.
Nyvlt J (1992) Design of Crystallisers. Boca Raton, FL: CRC Press.
OD Meadhra R, Kramer HJM and van Rosmalen GM (1996) A model for secondary nucleation in a suspension crys-talliser.AIChE Journal42: 973}982.
Ottens EPK, Janse AH and De Jong EJ (1972) Secondary nucleation in a stirred vessel cooling crystalliser.Journal of Crystal Growth13/14: 500}505.
Plo{R, Tengler T and Mersmann A (1989) A new model of the effect of stirring intensity on the rate of second-ary nucleation.Chemical Engineering Technology 12: 137}146.
Randolph AD and Larson MA (1988)Theory of Particulate Processes. 2nd edn. New York: Academic Press. Sinnott RK (1998) In:Chemical Engineering Design, vol. 6.
(Coulson JM and Richardson JF eds.), Oxford: Butter-worth Heinemann.
SoKhnel O and Garside J (1992)Precipitation. Oxford: But-terworth Heinemann.
van der Eerden JP (1993) Crystal growth mechanisms: In: Hurle DTJ (ed.)Handbook of Crystal Growth, vol. 1A, pp. 307}477. Amsterdam: Elsevier Science.
van der Heijden AEDM, van der Eerden JP and van Ros-malen GM (1994) The secondary nucleation rate; a physical model. Chemical Engineering Science
3103}3113.
Volmer M (1939) Kinetik der Phasenbildung. Dresden: Steinkopf.
DISTILLATION
R. Smith and M. Jobson, Department of Process Integration, UMIST, Manchester, UK
Copyright^ 2000 Academic Press
Introduction
Distillation is the most commonly used method for the separation of homogeneousSuid mixtures. Separ-ation exploits differences in boiling point, or volatility, between the components in the mixture. Repeated vaporization and condensation of the mix-ture allows virtually complete separation of most homogeneous Suid mixtures. The vaporization re-quires the input of energy. This is the principal disad-vantage of distillation: its high energy usage. However, distillation has three principle advantages over alternative methods for the separation of homo-geneousSuid mixtures:
1. The ability to handle a wide range of feed Sow rates. Many of the alternative processes for the separation ofSuid mixtures can only handle low Sow rates, whereas distillation can be designed for the separation of extremely high or extremely low Sow rates.
2. The ability to separate feeds with a wide range of feed concentrations. Many of the alternatives to distillation can only separate feeds that are already relatively pure.
3. The ability to produce high product purity. Many of the alternatives to distillation only carry out a par-tial separation and cannot produce pure products.
It is no accident that distillation is the most common method for the separation of homogeneous mixtures. It is a versatile, robust and well-understood technique. We shall start explaining distillation by a single-stage separation, before understanding how to set up a cas-cade of separation stages, which is distillation.
Single-Stage Separation
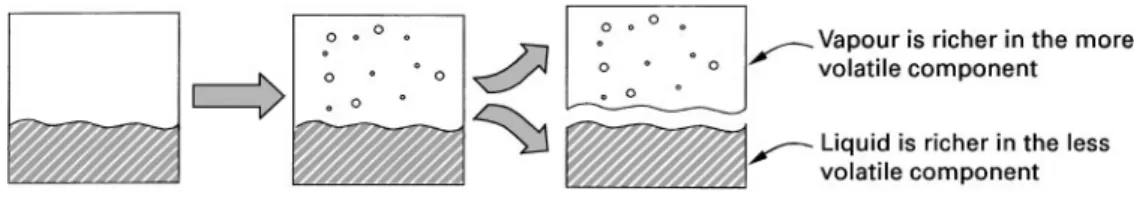
Figure 1 Partial vaporization of a liquid mixture creates a separation.
dictated by thermodynamic vapour}liquid equilib-rium considerations. All components can appear in both phases. However, involatile components will tend to stay in the liquid phase.
Rather than partially vaporize a liquid, as shown in Figure 1, we could have started with a mixture of components in the vapour phase and partially con-densed the vapour. We would still have had a separ-ation, as the liquid which was formed would be richer in the less volatile components, while the vapour would have become depleted in the less volatile com-ponents. Again, the distribution of components be-tween the vapour and liquid is dictated by thermo-dynamic vapour}liquid equilibrium considerations if we allow the system to come to equilibrium. Any noncondensable components present in the vapour will tend to stay in the vapour phase.
For each component in the mixture, thermody-namic equilibrium is given by the condition when the vapour and liquid fugacities are equal:
fv
i"fLi [1]
Fugacity is a thermodynamic pressure which, when substituted for pressure in thermodynamic expres-sions for ideal systems, allows them to be used for nonideal systems. It can be thought of as an escaping tendency. DeRning the vapour phase fugacity coef-Rcientv
i:
fvi"y
iviP [2]
DeRning the liquid-phase fugacity coefRcient L i
and activity coefRcienti:
fL
i"xiLiP [3]
or:
fL
i"xiif0i [4]
For moderate pressuresf0
i is usually taken to be the
saturated vapour pressurePSAT i :
fL
i"xiiPSATi [5]
These equations can be combined to give an expres-sion for the constant,K:
Ki"yi xi
"Li
v i
[6]
This expression provides the basis for vapour}liquid equilibrium calculations based on equations of state (e.g. Peng}Robinson equation). Alternatively:
Ki"yi xi
"iPSATi
v iP
[7]
This expression provides the basis for vapour}liquid equilibrium calculations based on liquid-phase activ-ity coefRcient models (e.g. Wilson equation). At moderate pressures:
Ki"yi xi
"iPSATi
P [8]
When the liquid phase behaves as an ideal solution, this expression simpliRes to:
Ki"yi xi"
PSAT i
P [9]
which is Raoult’s law. Correlations are available to relate component vapour pressure to temperature (e.g. the Antoine equation), activity coefRcients to composition and temperature (e.g. the Wilson equation) and fugacity coefRcient to mixture, pressure and temperature (e.g. from the Peng} Robin-son equation of state). Regression analysis of experi-mental data provides the adjustable parameters used in the various models.
The ratio of equilibrium constants for two compo-nents measures their relative volatility:
ij"Ki
Kj
[10]
whereijis the relative volatility between components
iandj.
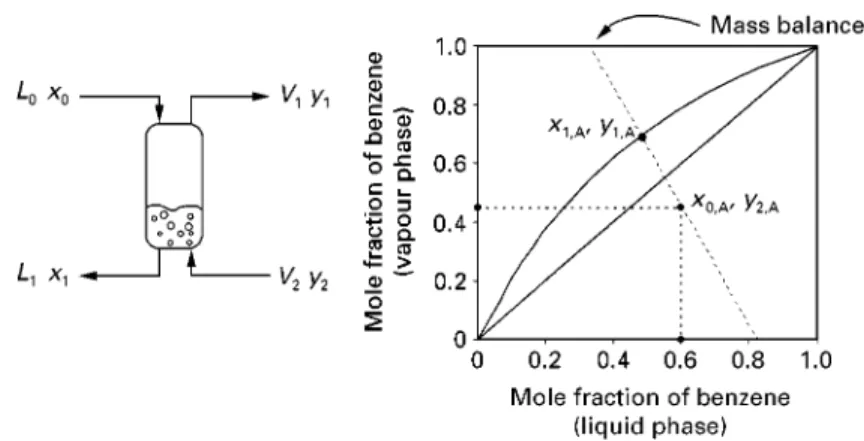
Figure 2 Vapour}liquid equilibrium for a binary mixture of benzene and toluene at a pressure of 1 atm.
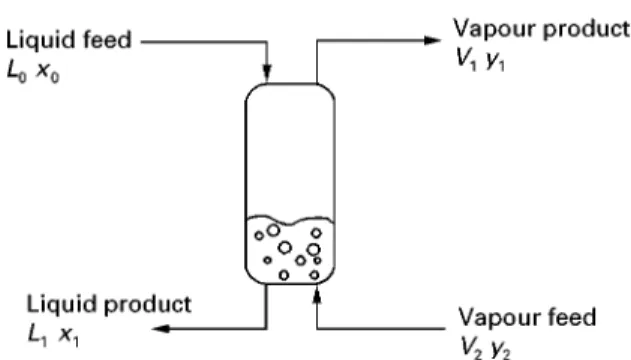
Figure 3 Separation in a single equilibrium stage.
Figure 2A shows the behaviour of the temperature of the saturated liquid and saturated vapour as the mole raction of benzene is varied (the balance being toluene).
Figure 2A also shows a typical vapour} liquid equilibrium pair where the mole fraction of benzene in the liquid phase is 0.4 and that in the vapour phase is 0.62. Shown in Figure 2B is an alternative way of representing the vapour}liquid equilibrium behaviour (x}y diagram). This plots the mole fraction of benzene in the vapour versus mole fraction of benzene in the liquid. A diagonal line across this diagram would represent a situation where the concentration in the vapour and the liquid are equal. The phase equilibrium behaviour, how-ever, shows a curve above the diagonal line. This indicates that the benzene has a higher concentration in the vapour phase than the toluene, i.e. the benzene is the more volatile component in this case. Figure 2B shows the same vapour}liquid equilibrium pair as that shown in Figure 2A with a mole fraction of benzene in the liquid phase of 0.4 versus a mole faction in the vapour phase of 0.62.
Figure 3shows a single equilibrium stage. Liquid is fed with compositionx0and vapour is fed with
com-position y2. Contact between the vapour and the
liquid streams makes the vapour richer in the more volatile components and the liquid richer in the less volatile components. Once the feed conditions and compositions, the system pressure and the relative Sow rates of the vapour and liquid have beenRxed, then the temperature and compositions of the exit streams are unique. Let us also, initially, make a sim-plifying assumption that the molarSow rates of the liquidL and molar Sow rates of the vapourV are constant for the stage. This assumption is known as constant molar overSow and is true if sensible heat effects are small, molar latent heats of vaporiza-tion of the components are equal, heat of mixing is negligible and there are no heat losses or gains. Let us now carry out a mass balance around the equilibrium stage shown in Figure 3. First we assume constant molar overSow:
L0"L1"L [11]
V2"V1"V [12]
A component mass balance gives:
Lx0,A#Vy2,A"Lx1,A#Vy1,A [13]
which can be rearranged to give:
y1,A"!L Vx1,A#
Lx0,A#Vy2,A
V [14]
Figure 4 Single-stage separation for a binary mixture.
Figure 5 A cascade of separation stages.
crosses the equilibrium line allows us to predict the vapour and liquid composition at the exit of the stage. We can now see quantitatively the separation carried out by the single equilibrium stage. However, the separation which is achieved on a single equilibrium stage is limited. We now need to consider how we can extend the idea to carry out further separation.
Cascade of Separation Stages
We have seen that a single equilibrium stage can only achieve a limited amount of separation. To extend the amount of separation we can make a cascade of stages, as shown in Figure 5. It is assumed in the cascade that streams leaving each stage are in equilib-rium. Using a cascade of stages in this way allows the more volatile components to be transferred to the vapour phase, the less volatile components to be transferred to the liquid phase and a greater degree of separation to be achieved than for a single stage.
Figure 6 shows the liquid and vapourSows con-necting the stages in a countercurrent cascade. As before, we assume constant molar overSow:
L0"Lm"2"LN; V1"Vm"2"VN#1 [15]
We can write an overall mass balance for component
iacross the cascade:
L0x0,i#VN#1yN#1,i"LNxN,i#V1y1,i [16]
We can also write a mass balance around the envel-ope shown in Figure 6 overm stages:
L0x0i#Vm#1ym#1,i"Lmxm,i#V1y1,i [17]
This equation can be rearranged to give:
ym#1"
L V)xm#
Vy1!Lx0
V [18]
This operating line relates the composition streams afterm stages.
Figure 6 Mass balance on a countercurrent cascade.
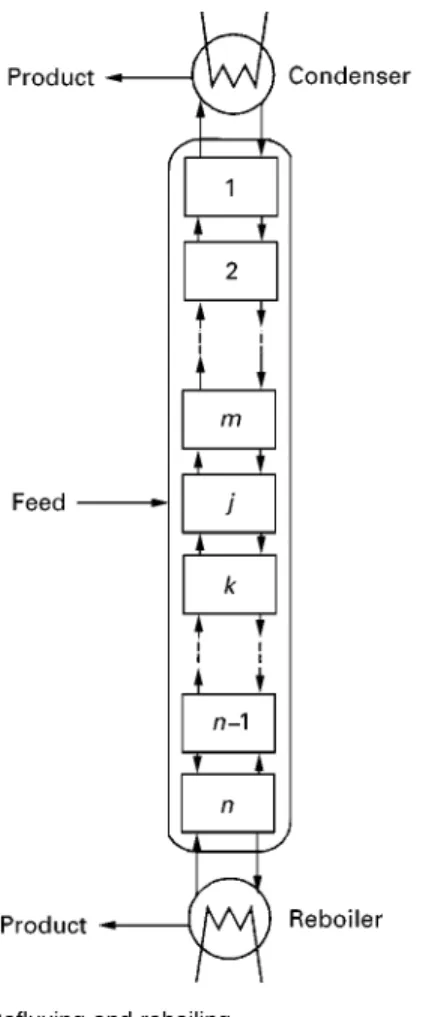
Figure 7 Refluxing and reboiling.
and returning some of the liquid leaving the bottom stage. The feed to the process is introduced at an intermediate stage; products are removed from the condenser and the reboiler (vaporizer).
The method by which the vapour and liquid are contacted with each other in distillation columns falls into two broad categories.Figure 8shows a plate or tray column. Liquid enters theRrst tray at the top of the column and Sows across what is shown in Figure 8 as a perforated plate. Liquid is prevented from weeping through the holes in the plate by the upSowing vapour. In this way the vapour and liquid are contacted. The liquid from theRrst traySows over a weir and down a downcomer, to the next stage and
so on. The design of stage used in Figure 8 involving a plate with simple holes is known as a sieve tray. Many other designs of tray are available involving, for example, valve arrangements for the holes in the trays. In practice, the column will need more trays than the number of equilibrium stages as mass trans-fer limitations prevent equilibrium being achieved on a tray.
The other broad class of contacting arrangement is that of packed columns. Here the column is Rlled with a solid material which has a high voidage. Liquid trickles across the surfaces of the packing and vapourSows upward through the voids in the pack-ing, contacting the liquid on its way up the column. Many different designs of packing are available.
The design of a distillation column like the one shown in Figure 8 involves a number of steps:
1. Set the product speciRcations. 2. Set the operating pressure.
3. Determine the number of theoretical stages re-quired and the energy requirements.
4. Determine the actual number of trays or height of packing needed and the column diameter. 5. Design the column internals, which involves
deter-mining the speciRc dimensions of the trays, pack-ing, liquid and vapour distribution systems, etc. 6. Carry out the mechanical design to determine wall
thicknesses, internalRttings, etc.
Let us start by considering the simplest case of binary distillation.
Binary Distillation
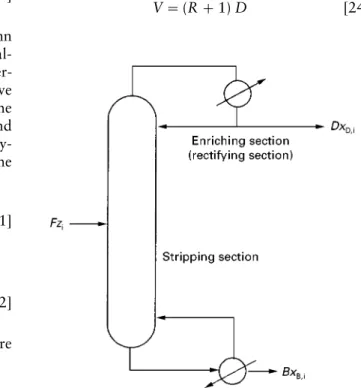
Consider the mass balance on a simple distillation column. By simple column, we mean that the column has one feed, two products, one reboiler and one condenser. Such a column is shown inFigure 9, together with the feed and product Sow rates and compositions. We can write an overall mass balance as:
Figure 8 The distillation column.
Figure 9 Mass balance on a simple distillation column.
We can also write a component balance as follows:
Fzi"xD,iD#xB,iB [20]
However, to understand the design of the column more fully, we must be able to follow the mass bal-ance throughout the column. Let us start by consider-ing the mass balance for the part of the column above the feed}the rectifying section.Figure 10shows the rectifying section of a column and the Sows and compositions of the liquid and vapour in the rectify-ing section. First we write an overall balance for the rectifying section:
Vn#1"Ln#D [21]
We can also write a component balance:
Vn#1yn#1,i"Lnxn,i#DxD,i [22]
We assume constant molar overSow (L and V are constant) and deRne the reSux ratio,R, to be:
R"L/D [23]
Given the reSux ratio, we can express the vapourSow in terms ofR:
Figure 10 Mass balance on the rectifying section.
Figure 11 Mass balance on the stripping section.
These expressions can be combined to give an equa-tion which relates the vapour entering and liquid Sows leaving stagen:
yn#1,i"
R
R#1xn,i# 1
R#1xD,i [25]
On anx}ydiagram for componenti, this is a straight line starting at the distillate composition with slope
R/(R#1) and which intersects the diagonal line at
xD,i.
Starting at the distillate composition xD in
Fig-ure 10, a horizontal line across to the equilibrium line takes us to the composition of the vapour in equilib-rium with the distillate,y1. A vertical step down takes
us to the liquid composition leaving stage 1,x1.
An-other horizontal line across to the equilibrium line gives us the composition of the vapour leaving stage 2,y2. A vertical line to the operating line gives us the
composition of the liquid leaving stage 2,x
, and so
on. Thus, as we step between the operating line and equilibrium line in Figure 10, we follow the change in vapour and liquid composition through the rectifying section of the column.
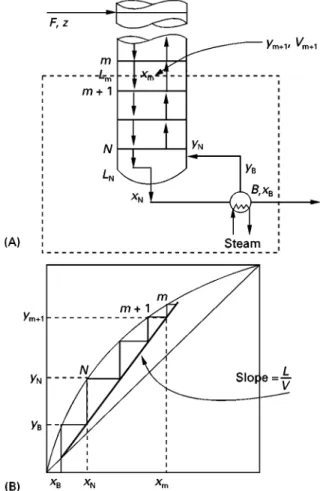
Now consider the corresponding mass balance for the column below the feed, the stripping section.
Figure 11A shows the vapour and liquid Sows and compositions through the stripping section of a col-umn. An overall mass balance for the stripping sec-tion around stagemgives:
Lm"Vm#1#B [26]
A component balance gives:
Lmxm,i"Vm#1ym#1,i#BxB,i [27]
Again, assuming constant molar overSow (L and
Vare constant), these expressions can be combined to give an equation relating the vapour entering and the liquid leaving stagem:
ym#1,i"
L Vxm,i!
B
VxB,i [28]
Figure 12 Mass balance for the feed stage.
bottom composition,xB, a vertical line to the
equilib-rium line gives the composition of the vapour leaving the reboiler,yB. A horizontal line across to the
operat-ing line gives the composition of the liquid leavoperat-ing stage N, xN. A vertical line to the equilibrium line
then gives the vapour leaving stageN,yN, and so on.
Let us now bring together the rectifying and strip-ping sections at the feed stage. Consider the point of intersection of the operating lines for the rectifying and stripping sections. From eqns [22] and [27]:
Vn#1yi"Lnxi#DxD,i [29]
Vm#1yi"Lmxi!BxB,i [30]
whereyiandxiare the intersection of the operating
lines. Subtracting eqns [29] and [30] gives:
(Vn#1!Vm#1)yi"(Ln!Lm)xi#DxD,i#BxB,i [31]
Substituting the overall mass balance, eqn [20], gives:
(Vn#1!Vm#1)yi"(Ln!Lm)xi#Fzi [32]
Now we need to know how the vapour and liquid Sow rates change at the feed stage.
What happens here depends on the condition of the feed, whether it is sub-cooled, saturated liquid, par-tially vaporized, saturated vapour or superheated vapour. To deRne the condition of the feed, we intro-duce the variableq, deRned as:
q"heat required to vaporize 1 mol of feed
molar latent heat of vaporization of feed [33]
For a saturated liquid feedq"1 and for a saturated vapour feedq"0. TheSow rate of feed entering the column as liquid isq)F. TheSow rate of feed entering the column as vapour is (1!q))F.Figure 12A shows a schematic representation of the feed stage. An over-all mass balance on the feed stage for the vapour gives:
Vn"Vm#(1!q)F [34]
An overall mass balance for the liquid on the feed stage gives:
Lm"Ln#qF [35]
Combining eqns [32], [34] and [35] gives a rela-tionship between the compositions of the feed and the
vapour and liquid leaving the feed tray:
yi" q
q!1)xi! 1
q!1)zi [36] This equation is known as theq-line. On thex}yplot, it is a straight line with slopeq/(q!1) and intersects the diagonal line atzi. It is plotted in Figure 12B for
various values ofq.
We are now in a position to bring together the mass balance for the rectifying and stripping sections.
Figure 13 Combining the rectifying and stripping sections.
Figure 14 (A) Total and (B) minimum reflux in binary distillation.
stepping procedure changes from one operating line to the other at the intersection with the q-line. We should also note that a partial reboiler represents a separation stage and a partial condenser (as op-posed to a total condenser) also represents a separ-ation stage.
There are two important limits that we need to consider for distillation. The Rrst is illustrated in
Figure 14A. This is total reSux in which no products are taken and there is no feed. All of the overhead
vapour is reSuxed and all of the bottom liquid re-boiled. Figure 14A also shows total reSux on anx}y
plot. This corresponds with the smallest number of stages required for the separation. The other limiting case, shown in Figure 14B, is where the reSux ratio is chosen such that the operating lines intersect at the equilibrium line. As this stepping procedure ap-proaches theq-line from both ends, an inRnite num-ber of steps are required to approach theq-line. This is the minimum reSux condition, and we term the condition at the feed stage to be a pinch.
This method of design for binary distillation is known as the McCabe}Thiele method. It is restricted in its application because it only applies to binary systems and involves the simplifying assumption of constant molar overSow. However, it is an important method to understand as it gives important concep-tual insights into distillation, which cannot be ob-tained in any other way.
Multicomponent Distillation
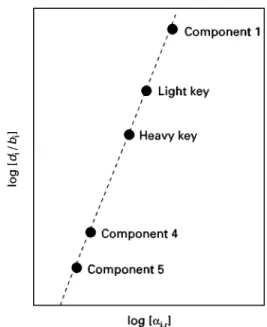
Figure 15 The Hengstebeck}Geddes method.
product must be speciRed, as must the recovery of the heavy key or the concentration of the heavy key in the bottom product. Intermediate boiling components will distribute between the products.
A number of short-cut methods are available for the design of multicomponent distillation columns. Each considers different aspects of the design of multicomponent columns. Each of the short-cut methods involves some simplifying assumptions and the designer must be fully aware of these assumptions when applying these methods. One simplifying as-sumption, which all the methods have in common, is the assumption of constant relative volatility. The relative volatility for the feed composition can be calculated, but this might not be characteristic of the overall column. By making some assumption of the product compositions, the relative volatility at the top and bottom of the column can be calculated and a mean taken:
(i,j)mean"((i,j)top)(ij)bottom [37]
Fenske Equation
The Fenske equation is used to estimate the minimum number of stages,Nmin. This is at total reSux and the Sows of componentiand a reference component,r, are related by:
di
dr" Nmin i,r )
bi
br
or xD,i
xD,r" Nmin i,r )
xB,i
xB,r
[38]
When componentiis the light key componentL, and
ris the heavy key component,H, we can write:
Nmin"
log
dLdH )bH
bL
logLH
[39]
Nmin"
log
xD,LxD,H )xB,H
xB,L
logL,H
[40]
Nmin"
log
rD,L 1!rD,L) rB,H
1!rB,H
logL,H
[41]
Hengstebeck^Geddes Equation
The Hengstebeck}Geddes equation is used to esti-mate the composition of the products. The Fenske equation can be written in the form:
log
dibi
"A#Clogi,r [42]
The parametersAandCare obtained by applying the relationship to the light and heavy key components. This allows the compositions of the non-key compo-nents to be estimated. This is illustrated inFigure 15. Having speciRed the distribution of the light and heavy key components, knowing the relative volatil-ities for the other components allows their composi-tions to be estimated. The method is based on total reSux conditions. It assumes that the component dis-tributions do not depend on reSux ratio.
The Underwood Equations
The Underwood equations are used to estimate min-imum reSux ratio. There are two equations. TheRrst is given by:
n
i"1 ixi,F
i!"1!q [43]
This equation must be solved for the root. This root will have a value between the relative volatilities of the light and heavy key components. Having obtained the value , this is then substituted into the second equation to determine the minimum reSux ratio,Rmin:
Rmin#1"
n
i"1 ixi,D
i! [44]
The Gilliland Correlation
The Gilliland correlation is an empirical relationship used to determine the number of stages, given the minimum reSux ratioRminand minimum number of
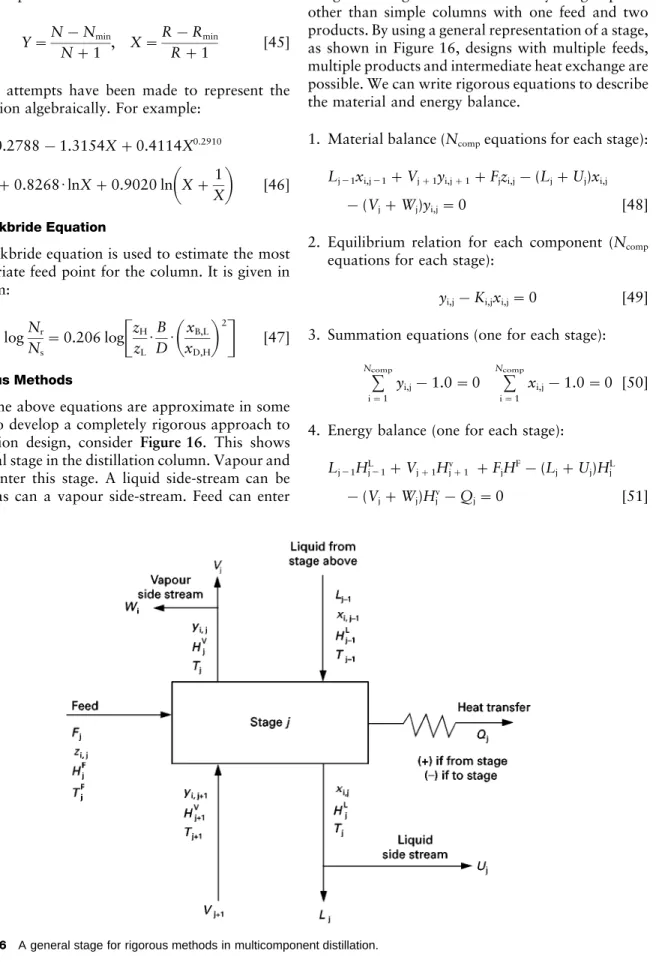
Figure 16 A general stage for rigorous methods in multicomponent distillation.
graphical form. Two parameters were used to corre-late the experimental data:
Y"N!Nmin
N#1 , X"
R!Rmin
R#1 [45]
Various attempts have been made to represent the correlation algebraically. For example:
Y"0.2788!1.3154X#0.4114X0.2910
#0.8268)lnX#0.9020 ln
X#1X
[46]The Kirkbride Equation
The Kirkbride equation is used to estimate the most appropriate feed point for the column. It is given in the form:
logNr
Ns"
0.206 log
zHzL)
B D)
xB,L
xD,H
2 [47]Rigorous Methods
All of the above equations are approximate in some way. To develop a completely rigorous approach to distillation design, consider Figure 16. This shows a general stage in the distillation column. Vapour and liquid enter this stage. A liquid side-stream can be taken, as can a vapour side-stream. Feed can enter
and heat can be transferred to or from the stage. This is a general stage and allows for many design options other than simple columns with one feed and two products. By using a general representation of a stage, as shown in Figure 16, designs with multiple feeds, multiple products and intermediate heat exchange are possible. We can write rigorous equations to describe the material and energy balance.
1. Material balance (Ncompequations for each stage):
Lj\1xi,j\1#Vj#1yi,j#1#Fjzi,j!(Lj#Uj)xi,j !(Vj#Wj)yi,j"0 [48]
2. Equilibrium relation for each component (Ncomp
equations for each stage):
yi,j!Ki,jxi,j"0 [49]
3. Summation equations (one for each stage):
Ncomp
i"1
yi,j!1.0"0
Ncomp
i"1
xi,j!1.0"0 [50]
4. Energy balance (one for each stage):
Figure 17 Simulation results for multicomponent distillation.
Figure 18 Effect of pressure on the distillation of a mixture of benzene, toluene, ethylbenzene and styrene.
This set of equations must be solved iteratively and the calculations are complex. Many methods are available and in practice designers use commerical simulation packages.
Figure 17 shows a typical result for the rigorous simulation of a distillation column with a feed mix-ture containing benzene, toluene, ethylbenzene and styrene. Because such simulations are numerically complex and time-consuming, short-cut calculations are used to explore the various design parameters before setting up a rigorous simulation.
Choice of Operating Parameters
The feed composition andSow rate are usuallyRxed. Also, the product speciRcations are usually given in the statement of the design problem. These may be
expressed in terms of product purities or recoveries of certain components. The operating parameters to be selected by the designer include:
1. operating pressure 2. reSux ratio 3. feed condition 4. feed stage location 5. type of condenser
Pressure
Figure 19 Effect of temperature on utility costs.
Figure 20 Range of reflux ratios.
pressure increases. As pressure increases, the relative volatility decreases, making separation more dif-Rcult. Minimum reSux ratio also increases with in-creasing pressure, as does the minimum number of stages. All of these trends point to operating the distillation columns at a pressure as low as possible. However, the latent heat decreases with increasing pressure; this would have the effect of decreasing the reboiler duty as pressure increases. Finally, Fig-ure 18 also shows the trend of condenser and the reboiler temperature as pressure increases; both in-crease with increasing pressure.
The temperature of the condenser and reboiler, as shown in Figure 18, dictate the choice of utilities to supply heating and cooling. Figure 19 shows the trend for the variation in utility costs for heating and cooling at different temperatures. Figure 19 shows that extreme temperatures for heating and cooling require more expensive utilities. Matching the distillation condenser and reboiler against cheap utilities is usually the dominant issue when choosing the operating pressure of the distillation column.
When starting a distillation design, we usually choose to operate at atmospheric pressure unless this leads to thermal degradation of products in the boiler because of high temperatures, or requires re-frigeration in the condenser. If product degradation is a problem, then we would operate the column under vacuum conditions to decrease the temperatures of the distillation. If refrigeration is required in the con-denser, then we might choose to increase the column pressure until cooling water can be used for the con-denser (which means the overhead concon-denser temper-ature must be 30}403C or higher), unless very high pressures are required for the distillation.
Choice of Re]ux Ratio
Figure 20shows the variation of the number of stages required versus the reSux ratio. Starting from min-imum reSux, we require an inRnite number of stages. As the reSux ratio is increased, the number of stages becomesRnite and decreases towards the minimum number of stages at total reSux. Actual reSux ratios will lie somewhere between the two extremes.
Figure 21shows a plot of annual cost versus reSux ratio. At minimum reSux ratio there is the require-ment for an inRnite number of stages and the annual capital cost is correspondingly inRnite. However, as the reSux ratio is increased the capital cost dimin-ishes. On the other hand, as reSux ratio is increased from the minimum, the utility costs increase steadily. Combining the annual capital costs with the annual utility costs gives a total annualized cost which shows a minimum at the optimum reSux ratio. This opti-mum is usually fairlySat for a signiRcant range of reSux ratios and an initial setting of 1.1 times the minimum reSux ratio is often assumed.
Choice of Feed Condition
The feed condition affects vapour and liquid Sow rates in the column, and in turn:
1. reSux ratio, heating and cooling duties 2. column diameter
Figure 21 Capital}energy trade-offs determine the optimum reflux ratio.
Figure 22 Distillation trays. (A) Conventional tray; (B) high capacity tray.
The feed temperature usually lies between the ex-treme temperatures of the column (condenser and reboiler temperatures).
Cooling the feed:
1. decreases the number of stages in the rectifying section but increases the number of stages in the stripping section
2. requires more heat in the reboiler but decreases the cooling duty of the condenser
Heating the feed:
1. increases the number of stages in the rectifying section but decreases the number of stages in the stripping section
2. decreases the heat requirement of the reboiler but increases the cooling duty of the condenser
Heating or cooling the feed can reduce energy costs. If heat is added to the feed and saves heating in the reboiler, the heating of the feed can be carried out at a lower temperature than would be required in the reboiler. Cooling the feed can be carried out at a lower temperature than cooling in the condenser. In both cases heating or cooling the feed is done at more moderate temperatures and, in principle, with a cheaper utility.
Choice of Feed Stage Location
When choosing the feed stage location, our objective is toRnd a stage in the column for which the composi-tion matches as closely as possible that of the feed. For binary distillation it is, in theory, possible toRnd an exact match between the composition on a stage and the composition of the feed. In practice, because there is aRnite change from stage to stage, even for
a binary system, an exact match may not be possible. In multicomponent systems it is highly unlikely that the composition of all of the components can be matched. Mismatches between the composition on the feed stage and that of the feed create inefRciencies in the distillation. These inefRciencies lead to an in-crease in the number of stages required for the same separation, or more reSux, which means increased energy requirements, or a combination of both.
Distillation Equipment
Let us now turn our attention to the equipment used for distillation operations. As pointed out previously, there are two broad classes of internals used for distillation: trays and packing.
Trays
Figure 22A shows a conventional tray arrangement. Liquid Sows down a downcomer across a tray in which the upSowing vapour contacts the liquidS ow-ing across the tray. The liquidSows down the next downcomer to the following tray, and so on. The perforated plate used in Figure 22A, known as a sieve tray, is the most common arrangement used. It is cheap, simple, and well understood in terms of its performance. There are many other designs of tray which are used. Many use simple valve arrangements in the holes to improve the performance and the Sexibility of operation to be able to cope with a wider variety of liquid and vapourSow rates in the column. One particular disadvantage of the conventional tray in Figure 22A is that the downcomer arrangement makes a signiRcant proportion of the area within the column shell not available for contacting liquid and vapour. In an attempt to overcome this, high capacity trays, with increased active area, have been de-veloped. Figure 22B illustrates the concept. Again, many different designs are available for high capacity trays.
Figure 23 Sieve tray performance.
Figure 24 Distillation packing. (A) Random or dumped pack-ing; (B) structured packing.
theoretical stages to real trays. The difference between the performance of an ideal stage and a real tray results from the fact that equilibrium is not achieved on a real tray because of mass transfer limitations. We therefore deRne an efRciency to convert from the theoretical stages to real trays. Three different efRciencies can be deRned:
1. Overall tray efRciency,Eo:
Eo"number of theoretical stages
number of real stages [52]
Eo depends on the design of the tray and the
mixture being distilled and typically varies be-tween 60% and 90% for distillation.
2. Murphree tray efRciency, EM. This
character-izes the performance of individual trays rather than having an overall measure as deRned byEo.
This is because efRciencies can vary through-out the column. The Murphree tray efRciency for stagej is deRned as:
EM"yj!yj#i yHj!yj#1
[53]
The Murphree tray efRciency measures the change in concentration of the vapour phase for an actual tray relative to that for an ideal stage. 3. Point efRciency, EMP. This measures the
ef-Rciency not only of an individual tray but at a local point on a tray. It is deRned in the same way as the Murphree tray efRciency, but at a point on the tray. It is deRned as:
EMP"yj,local!yj#1,local
yHjlocal!yj#1,local
[54]
EMP varies across the tray and must be integrated
across the tray to obtainEM. The result will depend
on the mixing pattern on the tray. For example, if the tray is perfectly mixed thenEM"EMP.
Correlations are available to predict Eo, EM and
EMP.
Trays have a range within which they can operate satisfactorily in terms of the hydraulic design. For example,Figure 23 shows the range of operation of a sieve tray. Using a sieve tray, internalSows in the distillation column are limited by:
1. Sooding, in which liquid cannot Sow down the column
2. entrainment, in which liquid drops are carried up the column by the vapourSow
3. downcomer backup, in which liquid backs up in the downcomers
4. weeping, in which vapourSow is too low to main-tain liquid on the tray
5. coning, in which poor vapour}liquid contact oc-curs due to the vapour forming jets
Packing
Figure 24A shows a traditional design of packing, which is random or dumped packing. The random or dumped packing is pieces of ceramic, metal or plastic which, when dumped in the column, produce a body with a high voidage. The liquid trickles down over the surfaces of the packing and the vapour is in contact with the liquid as itSows up through the voids in the packing.
Figure 25 Flood point correlation for packing.
with corrugations and holes and then joined together to produce a preformed packing with a high voidage. This is manufactured in slabs and built up in layers within the column.
Many types of both random and structured pack-ing are available. We need to be able to calculate the height of packing required by relating to the theoret-ical stages to the height of packing. For this we need the height equivalent of a theoretical plate, HETP. Thus, the packing height is simply the product of the number of theoretical stages and the HETP. Correla-tions are available for HETP.
As with the hydraulic design of trays, packing has a limited range over which the hydraulic design is acceptable. At very low vapour velocities through the packing, liquidSows are not inSuenced by the vapour Sow. As the vapour velocity increases, the vapour starts to hinder the downwardSow of liquid. This is the loading point. A limit is reached at a high vapour velocity, characterized by heavy entrainment of liquid and a sharp rise in the pressure drop across the pack-ing. This is theSood point. Correlations are used to determine theSood point and a typical correlation is shown in Figure 25. We usually design the packing for a vapour velocity to be some proportion of the Sooding velocity (e.g. 80%).
Complex Distillation Arrangements
All of the distillation arrangements which we have considered so far have involved one feed, produced two products, have a reboiler and condenser, and operation has been assumed to be continuous. Distil-lation designs have been adapted to suit different purposes, as discussed below.
Batch Distillation
In batch distillation, the feed is charged as a batch to the base of the distillation column. Once the feed has been charged, it is subjected to continuous vaporiza-tion. This vapour would thenSow upwards through trays or packing to the condenser and reSux would be returned as with continuous distillation. However, unlike continuous distillation, the overhead product will change with time. TheRrst material to be distilled will be the more volatile components. As the vapor-ization proceeds and product is withdrawn overhead, the product will become gradually richer in the less volatile components. Thus, batch distillation allows different fractions to be taken from the same feed. The batch distillation strategy depends on both the feed mixture and the products required from the distillation. By careful control of the reSux, it is possible to hold the composition of the distillate con-stant for a time until the required reSux ratio becomes intolerably large, as illustrated inFigure 26.
Azeotropic Distillation
Figure 26 Reflux ratio can be varied in batch distillation to maintain overhead product purity.
Figure 27 Azeotropic behaviour.
pressure. The second method is to add a mass separ-ation agent (known as an entrainer or a solvent). The mass separating agent must change the relative vola-tility of the original mixture in a way which allows the separation to be achieved.
Steam Stripping
Sometimes live steam is added at the base of the distillation column. When steam is used in this way, for example for the separation of hydrocarbon
mix-tures, the steam acts as an inert carrier, the presence of which decreases the partial pressure of the compo-nents in the vapour phase. This is like operating the distillation column at a lower pressure as far as the separation is concerned. However, the use of strip-ping steam is not quite the same as reducing the operating pressure.
Intermediate Reboiling and Condensing
Rather than use a single reboiler at the bottom of the column and a single condenser at the top of the column, it is possible to add or reject heat at inter-mediate points within the column. Below the feed but above the base of the column, liquid can be with-drawn from one of the stages into an intermediate reboiler to be vaporized and the vapour returned to the column. This inter-reboiling substitutes part of the reboiling at the base of the column. The advant-age of inter-reboiling is that the heat can be supplied at a lower temperature in the inter-reboiler, com-pared with the temperature required for the reboiler at the base of the column.
Figure 28 Sequencing simple distillation columns. (A) Direct sequence; (B) indirect sequence.
Figure 29 Thermally coupled columns. (A) Side-stripper, (B) side-rectifier; (C) fully thermally coupled (Petlyuk) column; (D) dividing wall column.
the column into an intercondenser. Because of this, it is more usual to take a liquid side-stream from the column, sub-cool the liquid and return the sub-cooled liquid to the column. The sub-cooled liquid provides condensation directly. Such arrangements are known as pump-arounds or pump-backs.
Multiple Feeds
Sometimes it is necessary to separate two or more streams with the same components but with dif-ferent compositions. If this is the case, it is wrong to mix the streams with different compositions to produce a single feed for the distillation column. This is because we would mix streams only to separate them later and this is thermodynamically inef-Rcient. If we have several streams with the same components but signiRcantly different composi-tions, then it is better to feed them to the distillation column at different points, trying as much as possible to match the composition of each feed with that of one of the stages in the column.
Multiple Products
It is sometimes possible to withdraw more than two products from the same column. Part of the liquid Sowing down the column or part of the vapourS
ow-ing up the column can sometimes be taken as a side-stream to form a third product. Such side-side-stream column designs are only possible under special circumstances.
Column Sequences
If a feed mixture needs to be separated into more than two products, then more than one distillation column will usually be required.Figure 28illustrates the op-tions for the separation of a mixture of three prod-ucts. In theRrst arrangement, the lightest component is taken overheadRrst and the two heavier products are separated in the second column. In the second arrangement, the heaviest product is separatedRrst and then the two lightest products are separated in the second column. For a three-product separation, there are two possible sequences, as shown in Fig-ure 28. As the number of products in the mixtFig-ure increases, the number of possible distillation se-quences increases signiRcantly. For example, if we have six products, then there are 42 possible se-quences of columns.
Thermal Coupling
Table 1 Cases not suited to separation by distillation
Case Problem Possible solutions
Separate materials of low molecular mass Low condensation temperature Absorption, adsorption, membranes Separate heat-sensitive materials of high
molecular mass
Thermal degradation of products Vacuum distillation
Separate components present in low concentrations
High flow rates in columns Absorption, adsorption
Separate classes of components (e.g. aromatics from aliphatics)
Boiling temperatures/volatilities of components in a class are not adjacent
Liquid}liquid extraction
Separate components with similar relative volatilities
Difficult separation: high operating and capital costs
Add mass separating agent and employ extractive or heterogeneous distillation or liquid}liquid extraction,
crystallization Separate components which form an
azeotrope
Azeotrope limits product composition Add mass separating agent and employ extractive or heterogeneous distillation or liquid}liquid extraction,
crystallization Separate volatile and involatile components Distillation requires that all components
are mobile for countercurrent flow
Evaporation, drying, nanofiltration
Separate condensible and noncondensible components
Only partial condenser can be used overhead
Use single-stage separation (flash)
two products and had a reboiler and a condenser. Sometimes, it is desirable to exchange heat between columns directly using thermal coupling connections.
Figure 29shows some thermally coupled distillation designs for the separation of a three product mixture. Figure 29A shows a side-stripper and Figure 29B a side-rectiRer. Figure 29C shows a fully thermally coupled arrangement, sometimes known as a Petlyuk column. Figure 29D shows what is known as a divid-ing wall column. This is the same arrangement as the Petlyuk column but the arrangement is built in a single shell with a dividing wall down the middle of the column. The arrangements in Figure 29C and 29D are both equivalent thermodynamically, if there is no heat transfer across the dividing wall in Figure 29D.
Summary
Distillation is a versatile, robust and well-understood technique and is the most commonly used method for the separation of homogeneousSuid mixtures. There are cases for the separation of homogeneous Suid mixtures for which distillation is not well suited.
Table 1 presents a summary of these cases, along with possible solutions. It should be noted, however, that even though distillation is not well suited to the separation duties in Table 1, distillation is still used in some form for many of these problematic cases.
Symbols
bi bottomsSow rate of componenti
B molar bottomsSow rate
di distillateSow rate of componenti
D molar distillateSow rate
EM Murphree tray efRciency
EMP point efRciency
Eo overall tray efRciency
fL
i fugacity of componentiin the liquid phase
fV
i standard-state fugacity of component at the
temperature of the system
f0
i fugacity of componentiin the vapour phase
F molar feedSow rate
H molar enthalpy
Ki equilibrium constant for componenti
L molarSow of liquid
Nmin minimum number of stages
N number of stages
Ncomp number of components
P system pressure
PSAT
i saturated vapour pressure of component i at
the system temperature
q feed condition
Q heat duty
R reSux ratio
r recovery
Rmin minimum reSux ratio
T temperature
U vapour velocity
V molarSow of vapour
xi mole fraction ofiin the liquid phase
yi mole fraction ofiin the vapour phase
yHj mole fraction of vapour that would be in
equi-librium with liquid leaving stagej
yHj,local mole fraction of vapour that would be in
eq-uilibrium with the local concentration on stagej zi feed composition of componenti
ij relative volatility between componentsiandj
density
L
i liquid-phase fugacity coefRcient for
V
i vapour-phase fugacity coefRcient for componenti i activity coefRcient for componenti
See Colour Plate 5.
Further Reading
Geankoplis CJ (1993)Transport Processes and Unit Op-erations. New Jersey: PTR Prentice Hall.
King CJ (1980)Separation Processes. New York: McGraw-Hill.
Kister HZ (1992) Distillation Design. New York: McGraw-Hill.
Seader JD and Henley EJ (1998)Separation Process Prin-ciples. New York: John Wiley.
Stichlmair JG and Fair JR (1998)Distillation Principles and Practice. New York: Wiley-VCH.
ELECTROPHORESIS
D. Perrett, St Bartholomew’s and the Royal London School of Medicine and Dentistry,
St Bartholomew’s Hospital, London, UK
Copyright^ 2000 Academic Press
An Outline of the Historical
Background to Electrophoretic
Separations
The movement of charged particles under the inS u-ence of an electricReld was observed as long ago as 1807 by Ferdinand Frederic Reuss. In 1909, the term, electrophoresis, was introduced by Michaelis as a de-scription of this phenomenon and is derived from the Greek word elektron meaning amber (i.e. electric) and phoremeaning bearer. Yet it was not until the 1930s that electrophoresis, as we know it today, developed from the work of Tiselius, who, in 1948, was awarded the Nobel Prize for this development.
Table 1charts the development of the technique over the last century. By the 1950s electrophoresis was a common laboratory technique equivalent in useful-ness to planar chromatography techniques such as paper and thin layer. However, with the advent of high-performance liquid chromatography (HPLC) in the 1970s, analytical electrophoresis became some-thing of a ‘Cinderella’ technique. Only in biochemical and clinical laboratories did electrophoresis continue in use as a qualitative separation technique for mac-romolecules, such as proteins and DNA.
It has been claimed that currently at least half of all separations are performed by electrophoresis since separations of blood proteins and DNA digests are routinely performed by the technique. The technique is now so routine in biomedicine and related disci-plines that it is rarely referred to in the abstracts and titles of papers where it is a core technology, for example DNA sequencing. Even so, it is mentioned by name in almost as many papers as is chromatogra-phy (Table 2). However, with the development of
capillary electrophoresis after 1981 electrophoresis has returned as a substantial topic of interest to main-stream analytical chemistry.
Fundamentals of Electrophoresis
Unlike chromatography, there is no formal Interna-tional Union of Pure and Applied Chemistry (IUPAC) deRnition of electrophoresis, although one is being developed at the time of writing. However, through teaching the subject over the past 10 years, I have developed the following deRnition:
‘Electrophoresis is a mainly analytical method in which separations are based on the differing mobilities (i.e. speed plus direction of movement) of two or more charged analytes (ionic com-pounds) or particles held in a conducting medium under the inSuence of an applied direct current electricReld’ (Figure 1).
Electrophoresis therefore contrasts to chromatog-raphy which is deRned as a method used primarily for the separation of two or more components of a mix-ture, in which the components are distributed be-tween two phases, one of which is stationary while the other moves. Another difference is that in chromatography the modelling of the separation from Rrst principles is complex, difRcult and im-precise whereas a relatively simple theoretical back-ground to electrophoresis has been developed and is reproduced below. For a more complete discussion of electrophoretic theory see Mosheret al. (1992).