Deformation simulation of cells seeded on a collagen-GAG scaffold in a flow
perfusion bioreactor using a sequential 3D CFD-elastostatics model
Jungreuthmayer C1,2,3, Jaasma MJ1,2, Al-Munajjed AA1,2, Zanghellini J4,
Kelly DJ2, O'Brien FJ1,2
1
Department of Anatomy, Royal College of Surgeons in Ireland, Ireland
2
Trinity Centre for Bioengineering, Dept of Mechanical and Manufacturing Engineering, Trinity College
Dublin, Ireland
3
Siemens Medical Ireland, Leeson Close, Dublin 2, Ireland
4
Institute of Chemistry, Karl Franzens University Graz, Austria
Address Correspondence and Reprints Requests to:
Professor Fergal J. O'Brien, PhD Department of Anatomy
Royal College of Surgeons in Ireland 123 St. Stephen’s Green
Dublin 2 Ireland
Abstract
Tissue-engineered bone shows promise in meeting the huge demand for bone grafts caused by up to
4 million bone replacement procedures per year, worldwide. State-of-the-art bone tissue engineering
strategies use flow perfusion bioreactors to apply biophysical stimuli to cells seeded on scaffolds
and to grow tissue suitable for implantation into the patient's body. The aim of this study was to
quantify the deformation of cells seeded on a collagen-GAG scaffold which was perfused by culture
medium inside a flow perfusion bioreactor. Using a µCT scan of an unseeded collagen-GAG
scaffold, a sequential 3D CFD-deformation model was developed. The wall shear stress and the
hydrostatic wall pressure acting on the cells were computed through the use of a CFD simulation
and fed into a linear elastostatics model in order to calculate the deformation of the cells. The model
used numerically seeded cells of two common morphologies where cells are either attached flatly
on the scaffold wall or bridging two struts of the scaffold. Our study showed that the displacement
of the cells is primarily determined by the cell morphology. Although cells of both attachment
profiles were subjected to the same mechanical load, cells bridging two struts experienced a
deformation up to 500 times higher than cells only attached to one strut. As the scaffold's pore size
determines both the mechanical load and the type of attachment, the design of an optimal scaffold
must take into account the interplay of these two features and requires a design process that
Introduction
Every year, up to 4 million bone replacement procedures are performed worldwide which require
the use of a bone graft [1]. However, both of the most common treatments show substantial
drawbacks. Autografts, where bone is taken from the patient‘s own body and then re-implanted, has
only limited availability and an additional invasive surgery is necessary which raises the possibility
of donor site morbidity. Allograft, where bone is removed from an organ donor, possesses a small
risk of disease transmission and again has limited availability. Therefore, the recent focus of bone
graft research has switched to bone tissue engineering, where cells (taken from the patient’s bone
marrow) are seeded onto a biological scaffold. These cells produce bone tissue in vitro [2] using
chemical and biological growth factors or by responding to biophysical stimuli applied by a
bioreactor.
Scaffolds play a key role in tissue engineering and must meet various demands. The scaffold
material has to be biodegradable and the products of degradation should be non-toxic [3]. The
scaffold structure has to be highly porous with a high interconnectivity and a surface area [4] which
allows nutrient flow throughout the scaffold and the surrounding host tissue.
Collagen-glycosaminoglycan (GAG) scaffolds developed by Yannas et al. [5] and adapted for bone tissue
engineering by O’Brien et al [6] fulfil all these key criteria and show promising results in vitro [7]
and in vivo [8].
The only disadvantage of the collagen-GAG scaffold for bone tissue engineering is that it has
relatively poor mechanical properties. However, the mechanical properties of the cell-seeded
collagen-GAG scaffold can be improved through in vitro matrix production and mineralisation.
Biophysical stimuli can be used to increase this matrix production and improve the levels of
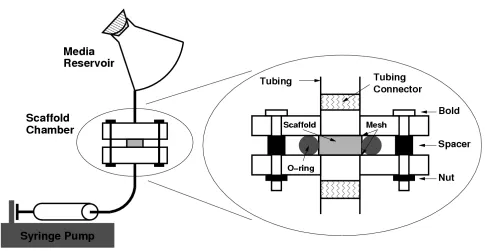
mineralisation. One way of applying biophysical stimuli is through the use of a flow perfusion
bioreactor as shown in Figure 1, where culture medium is pumped through the cell-seeded scaffold
[9,10,11] exposing the cells to a shear stress.
stress, and principal strain [29,30] it has been established that shear stress is the main biophysical
stimulus which causes cells to activate matrix production and mineralization [12,17,31]. The
applied wall shear stress needs to be in a physiologically relevant range. In vivo, bone cells
experience estimated shear stresses of 0.8Pa to 3.0Pa for the range of routine physical activity [32].
Shear stress values outside the physiologically relevant range might lead to a lack of osteogenic
stimulation or a stimulation of osteogenic activity that is sub-optimal. A number of studies have
estimated the levels of shear stress required to stimulate osteoblasts to upregulate osteogenic
markers and produce extracellular matrix. Smalt et al. [13] reported that wall shear stress values of
3Pa caused osteoblastic cells seeded on a substrate to release the early bone formation marker
prostaglandin E2 but that levels of shear stress as low as 30mPa did not result in a significant
increase of prostaglandin E2. A calcium phosphate scaffold (pore size ~350µm) seeded with MC3T3
cells were used by Vance et at. [14] to stimulate the cells to release prostaglandin E2 by applying
wall shear stress values of up to 1.2Pa using a flow perfusion bioreactor. However, Jaasma and
O’Brien [22] reported that much lower wall shear stress values (~20mPa) are sufficient to stimulate
osteoblastic cells seeded on collagen-GAG scaffolds (pore size ~96µm) to release prostaglandin E2.
Besides the fluid flow, the cell morphology and the cell’s position within the scaffold also affect the
mechanical response [18]. This indicates that the applied wall shear stress alone is an inadequate
measure to determine the optimal biophysical stimulus. We hypothesize that the cell deformation is
more suitable to characterize the applied biophysical stimulus, because it not only takes into
account the acting forces caused by the fluid flow, but also the cell morphology.
Computational fluid-dynamics models (CFD) have been successfully used to quantify the shear
stresses acting inside microstructures [15,16,34], whereas finite element deformation simulations
have been used to quantify the deformation of cells caused by a fluid flow [17]. Little work has
been done in combining these two methods to determine the exact fluid conditions inside a scaffold
and calculate its mechanical effect on the seeded cells.. The objective of this study was to determine
fluid flow using a bioractor by quantifying the mechanical deformation of the cells. We hypothesise
that the different cell attachment profiles to the scaffold struts that are observed experimentally [19]
will determine the levels of cell deformation within the scaffold. To investigate this hypothesis, a
novel 3D CFD-elastostatics model of a cell-seeded collagen-GAG scaffold was developed to (i)
quantify the velocity, the shear stress, and the hydrostatic pressure of the fluid inside the scaffold, to
(ii) determine the wall shear stress and the hydrostatic wall pressure, that cells seeded on the
scaffold are exposed to, and to (iii) analyse the deformation of cells of two common cell attachment
Methods
A computational model was designed to characterize the deformation of osteoblastic cells seeded on
a collagen-GAG scaffold [6] exposed to flow perfusion in a bioreactor. The scaffolds were
fabricated in our laboratory [20] and had an average pore size of 96µm [6]. 2x10⁶ cells were seeded
on the scaffold (diameter = ~12.0 mm, thickness = ~3.5 mm) as described in [11].
The development of the model required a five step procedure: geometry reconstruction, numerical
cell seeding, mesh creation, CFD simulation, and elastostatic simulation.
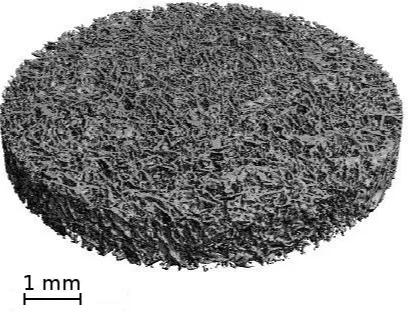
Step 1: A micro-computed tomography (µCT) scan of an unseeded collagen-GAG scaffold was used
to obtain a numerical model of the scaffold. The µCT scan was performed by SCANCO Medical
AG (Bassersdorf, Switzerland). The scan comprised a volume of 10,240µm x 10,240µm x 520µm
(Figure 2). The pixel size was 5µm x 5µm x 5µm. In order to reduce the computational costs, three
randomly chosen sub-volumes with dimensions of 640µm x 640µm x 480µm were analysed. The
3D model of the scaffold geometry was reconstructed from the grey-scale µCT raw data by
extracting the chosen sub-volumes, filtering (Gaussian rank filter) and thresholding.
Step 2: A computer program was developed to numerically seed cells on the 3D model of the
scaffold obtained in Step 1. Previous investigations using confocal microscopy, differentiate two
types of cell attachment in the collagen scaffolds used in our laboratory [19]: approximately 25% of
the cells are attached flatly to the scaffold wall and 75% of the cells are attached bridging two struts
of the scaffold [19,35]. The seeding program was able to seed both types of cells on the 3D model.
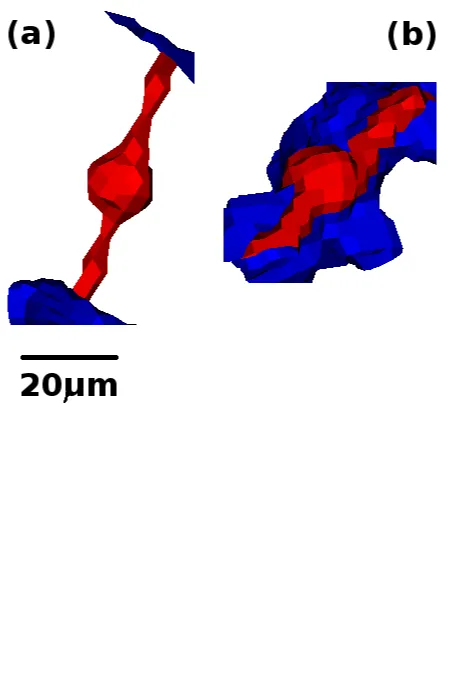
The seeded cells were between 45 and 65µm long. Cells attached to two struts had the form of a
sphere representing the cell body and two processes. The average diameter of the sphere was 15µm
and the average diameter of the cylinder-shaped processes was 2.2µm [21] (see Figure 3a). Cells
flatly attached to the scaffold wall had the form of a hemisphere representing the cell body (see
Figure 3b) and two processes with a semi-circular cross section. In order to obtain the same cell
volume for both cell types, the average diameter of the hemispherical-shaped cell body was 19µm
similar algorithms for the two attachment types. The procedures started with randomly picking a
void-scaffold interface. From this starting face the algorithms tried to propagate cell material
through the scaffold void in a randomly chosen direction. If an entire cell could not be propagated
without hitting an obstacle in the form of scaffold material or an already seeded cell then the
seeding attempt of this cell was aborted and a new propagation direction or a new starting
void-scaffold interface was picked. This procedure was repeated until all cells were successfully seeded
on the scaffold. The main difference between the two seeding algorithms was that for bridging cells
a potential opposite attachment face was determined before the propagation attempt was started.
The opposite attachment face was computed using the normal vectors of the attachment faces, the
minimum and maximum cell length. In total approximately 900 (675 bridging and 225 flat) cells
were numerically seeded on the used sub-volume which corresponds to the experimental setup,
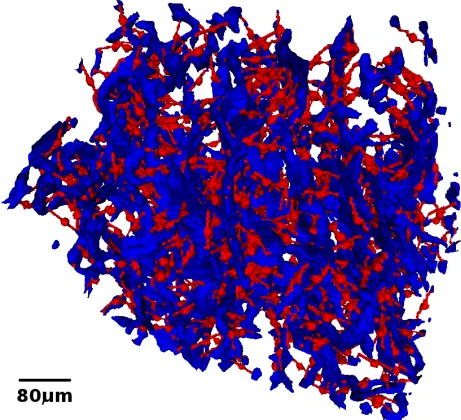
where 2x10⁶ cells had been used on scaffolds with a volume of 0.443cm3. The model of the
cell-seeded scaffold (sub-volume number two) is shown in Figure 4. The final geometry had a volume of
640µm x 640µm x 480µm = 0.197mm3 of which 2.2%, 9.6%, and 88.2% were cells, scaffold
material, and void, respectively.
Step 3: A smoothing procedure of the cell-seeded structure and the creation of the mesh were
performed. A hexahedral mesh containing approximately 1,700,000 hexahedrons was created from
the interstice of the structure. This mesh was used in the CFD simulation. Mesh refinement analyses
of the CFD mesh showed that the maximum error on wall shear stress and hydrostatic pressure was
below 1.5%. Furthermore, for each cell a hexahedral mesh was calculated from the structure. The
cell meshes consisted of roughly 2,200 hexahedrons and were used separately in the deformation
simulation. The maximum error on displacement and von Mises stress of the elastostatics
simulation was investigated by a mesh refinement analyses and was below 1%.
Step 4: A CFD simulation with the following parameters and boundary conditions was performed:
laminar fluid flow, incompressible Newtonian fluid with the viscosity of water at 37° Celsius,
experimental maximum velocity of 1ml/min [22]), zero-pressure outlet, and impermeable cell and
scaffold walls. Using an FE deformation simulation, the Young’s modulus of the whole scaffold
[23] was used to determine the Young’s modulus of the collagen-GAG material. In agreement with
[24], the simulations showed that the Young’s modulus of the collagen-GAG material of our
scaffold was > 106Pa. The obtained Young’s modulus of the collagen-GAG material was used in
another FE study of the scaffold which revealed that the relative deformation of the scaffold caused
by the fluid flow is less than 0.2%. Hence, it was assumed that the scaffold material is rigid and that
the walls of the scaffold do not move during the CFD simulation. Due to the small cell volume, cell
deformation contributes insignificant changes to the fluid dynamics system. Therefore, the cells
were also assumed to be rigid during the CFD simulation. An inlet area of a length of 100µm was
added to the simulation volume to allow the nutrition fluid to distribute freely before entering the
scaffold. The simulation was performed using the FV (finite volume) solver icoFoam of the open
source CFD toolbox OpenFOAM [25].
Step 5: The deformation of the cells was simulated using the wall shear stress and the hydrostatic
wall pressure computed in Step 4. The cells were assumed to be of isotropic, homogeneous material
with a constant Young's modulus of 1kPa [26,27] simplifying the complex mechanical nature of the
cells to a linear elastic behavior. The nodes of cell faces touching the scaffold were set to the
constraint: ux = uy = uz = 0, where ux, uy ,and uz are the displacements of a node in x-, y-, and
z-direction. This constraint resulted in immobile nodes at the contact area between scaffold and cells
and from a simulation point of view caused the cells to stick on the scaffold. The forces caused by
the wall shear stress and the hydrostatic wall pressure were applied to the nodes of faces exposed to
fluid flow. The deformation simulation was done separately for each cell and performed using the
FE (finite element) solver stressFemFoam of the open source CFD toolbox OpenFOAM.
The CFD simulations were performed on a 64-Bit Linux computer cluster using 8 CPUs in parallel.
The CFD simulation of one sub-volume took ~78 hours. A 32-Bit Linux PC was used to perform the
Results
All average values and histogram distributions presented in this study have been calculated over the
three simulated sub-volumes. The maximum difference in shear stress, pressure and deformation of
the 3 sub-volumes was < 4%. Furthermore, all results concerning cells – as forces acting on cells
and the displacement of cells - presented in this work are from inner cubes of the size of 320µm x
320µm x 320µm in order to avoid boundary artefacts [16].
Figure 5 shows (a) the magnitude of the fluid velocity and (b) the hydrostatic pressure of the culture
medium inside the simulated volume (sub-volume number two). As a result of the complex scaffold
geometry the fluid velocity widely varied from 0µm/s to a maximum of 1425µm/s with an average
value of 281µm/s (regarding all 3 sub-volumes). The minimum, maximum, and mean hydrostatic
pressure obtained over all three sub-volumes was -86mPa, 877mPa, and 379mPa, respectively.
As shown in the distribution of the magnitude of the fluid velocity inside the cell-seeded scaffold
(Fig. 6), most of the scaffold volume was perfused with low fluid velocities (50% of the volume is
perfused with a fluid velocity less than 220µm/s and less than 3% of the volume were subjected to a
fluid velocity larger than 900µm/s). The pronounced peak at a velocity of 200-300µm/s corresponds
to the inlet velocity of 235µm/s.
In agreement with the distribution of the fluid velocity in Figure 6, the simulations revealed that
most of the scaffold and cell walls were exposed to low values of shear stress (Fig. 7(a)). The wall
shear stress ranged from 0 to 162mPa and less than 38% of the wall was exposed to a shear stress
larger than 20mPa. However, the hydrostatic wall pressure acting on the scaffold and cell walls
showed a plateau-like shape (Fig. 7(b)). The plateau-like pressure distribution is in agreement with
Darcy’s law, which predicts a linear increase of the pressure if the permeability of the scaffold is
homogenous. The minimum and maximum hydrostatic wall pressure values were -79mPa and
557mPa, respectively.
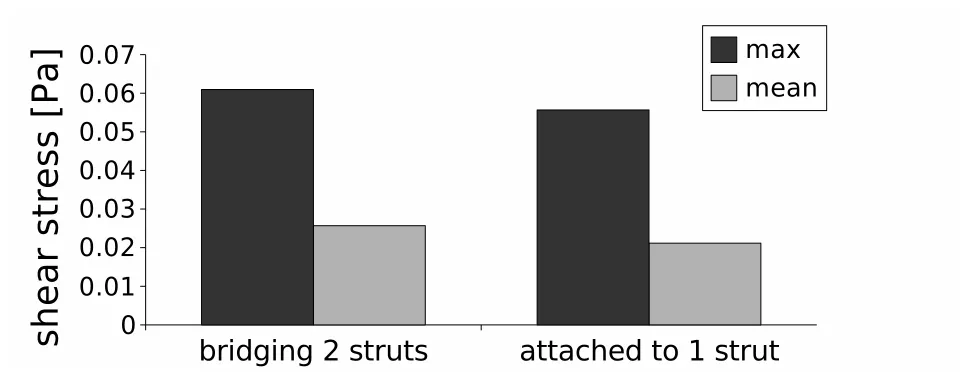
Figure 8 depicts the average values of the maximum wall shear stress and the average value of the
approximately the same maximum and the same mean wall shear stress regardless of attachment
profile.
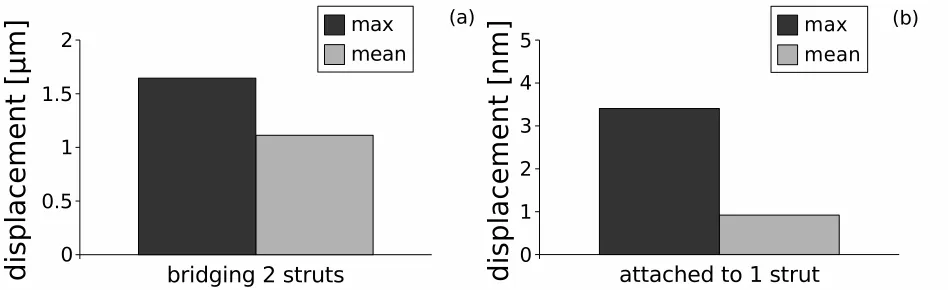
Figure 9 shows (a) the average of the maximum displacement and (b) the average of the mean
displacement of the cells caused by the wall shear stress and the hydrostatic wall pressure. Unlike
the wall shear stress and the wall pressure (Fig. 8), the displacement of the cells differs largely
depending on the type of cell attachment. Cells attached to two struts experienced a deformation of
up to 500 times higher than cells attached to only one strut (bridging cells 1.6µm compared to flatly
attached cells 3.4nm). The respective contributions of the wall shear stress and the wall pressure
were estimated by additionally performing the deformation simulations with the shear forces
included and the pressure forces excluded and vice versa. When the two separately obtained
displacement values are combined, a good agreement is found with the total displacement that was
computed using both input types, the wall shear stress and the wall pressure. This indicates that the
two contributions constructively superimpose and that the respective contributions of the wall shear
stress and wall pressure can simply be calculated by neglecting the other input type. The wall shear
stress and the wall pressure contributed approximately 47% and 53% to the maximum and mean
displacement of the cells attached to two struts. However for flatly attached cells there was an
average contribution of 62% by wall shear stress and of 38% by wall pressure to the maximum and
mean displacement, respectively.
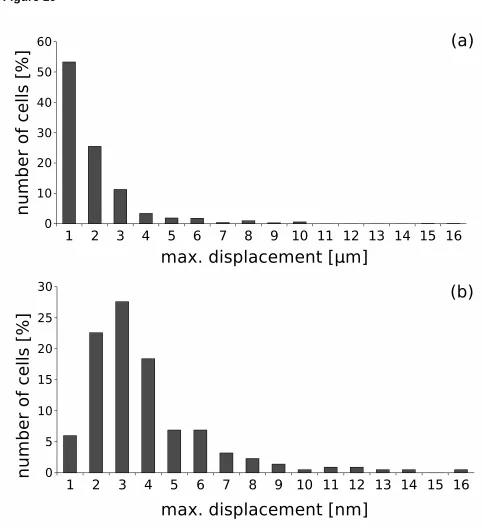
The distribution of displacement maxima is shown in Figure 10. Figure 10(a) and Figure 10(b)
depict the distribution of cells attached to two struts and of cells attached to one strut respectively. It
can be seen that the maximum displacement in both groups of attachment varied widely and that
only a minority of the cells experienced a displacement close to the absolute maximum of each
attachment type. The pronounced variety of displacement maxima in both groups is a result of the
variety of flow conditions and fluid velocities inside the scaffold. Depending on their position the
cells were exposed to a wide range of acting forces and therefore showed a broad distribution of
Despite the fact that cells with both attachment profiles were on average subjected to the same
mechanical load (Fig. 8) the cellular von Mises stress in bridging cells is much higher than in flatly
attached cells. The averaged maximum cellular von Mises stress of bridging cells was 34mPa,
Discussion
The aim of this numerical study was to quantify the wall shear stress and hydrostatic wall pressure
acting on cells seeded to collagen-GAG scaffolds and to analyse the effect of the two common
attachment profiles on the cell deformation during flow perfusion experiments. The wall shear
stress and the hydrostatic wall pressure were computed through the use of a CFD simulation and fed
into an elastostatics model in order to calculate the deformation of the cells. Our study showed that
the displacement of the cells is primarily determined by the cell attachment. Although cells of both
attachment profiles were subjected to a similar flow environment, cells bridging two struts
experienced a deformation up to 500 times higher than cells only attached to one strut.
Recently, two types of computational studies have been reported which looked at the response of
cells to fluid flow [15,16,17]. In the first type, 3D CFD models were used to calculate the shear
stress acting on the walls of a scaffold without incorporating cells to the model. The forces acting
on the cells were estimated by the results obtained from the CFD simulation and the deformation of
the cells was not calculated [15,16]. In the second type, 3D FE models were utilized to calculate the
deformation of cells without determining the exact fluid dynamical environment of the deformed
cells [17]. The novel work presented in this article combines these two approaches. Firstly, the
forces acting on the cells caused by the fluid flow were determined by a CFD simulation. In a
second step these forces were used to calculate the deformation of the cells and the cellular von
Mises stress.
The following three limitations should be considered in the interpretation of this work. Firstly, the
cells were seeded to the scaffolds numerically, because it is not possible to do a µCT scan of
materials which are minimally radio absorbent such as collagen and living cells. Furthermore, µCT
scans do not differentiate between scaffold material and cells. Confocal microscopy images of
cell-seeded scaffolds [19] have been used to optimize the cell morphology created by the numerical
seeding algorithms. The most critical parameter was the diameter of the processes of bridging cells.
diminish the qualitative validity of our concept as the difference between bridging and flatly
attached cells is still very pronounced for a wide range of diameters (1 to 8µm). The second
limitation was that for computational reasons a sequential and not a combined CFD-deformation
simulation was used, meaning that the deformation of the cells was not fed back to the fluid
dynamics model. Instead it was assumed that the flow conditions are only weakly altered by the
deformation of the cells as the cells only occupy 2.5% of the scaffold's interstice. The third
limitation was that the cells were assumed to be of linear isotropic and homogeneous material
whose mechanical properties did not change with the applied mechanical load. This simplification
did not mirror the complex structure of real cells and a more realistic model of the cellular
components as suggested in [17] might further improve the precision of our simulations.
The large range of the fluid velocity and the wall shear stress (Fig. 5 - 7) was as a result of the
complex geometry of the scaffold. Although the flow conditions varied widely inside the scaffold,
on average cells with both attachment profiles were exposed to approximately the same mechanical
load (Fig. 8). However, the deformation of the cells strongly depended on the attachment type. Fig.
9 clearly shows that flatly attached cells were much less deformed than cells which were attached to
two struts.
The variation in the cell deformation depending on the type of attachment may explain the fact that
in 3D experiments, much lower fluid velocities are required to stimulate cells than in 2D
experiments (without a scaffold) [28]. It might also explain why in 3D bioreactor experiments using
scaffolds with pore sizes too large to allow cells to bridge two struts, instead forcing them to attach
to one strut only thus simulating 2D experiments, higher fluid velocities are used [14]. In 2D
experiments, a wall shear stress of 30mPa is not sufficient to stimulate osteoblastic cells to release
the early bone formation marker prostaglandin E2 [13], whereas in our 3D experiments shear stress
values of 1mPa were sufficient [22].
In [14], an experiment with a calcium phosphate scaffold (with an average pore size of ~350µm
which is approximately 230 higher than the maximum fluid velocity of 235µm/s we used in our
experiments with the collagen-GAG scaffold (average pore size of ~96µm) [22]. In both
experiments the fluid velocities caused the cells to respond to the mechanical stimulus with the
release of prostaglandin E2 indicating that the bone formation process was initiated. According to
our simulations, the large difference in the fluid velocities is of the same order of magnitude as the
difference in the displacement experienced by bridging and flatly attached cells when they are
exposed to the same fluid velocity. Assuming that all cells in our scaffold were flatly attached, a
fluid velocity in the order of 50mm/s would be required to obtain a similar displacement as bridging
cells experience at fluid velocity of 235µm/s. This indicates that the requirement of different flow
rates in 3D experiments of different scaffolds could solely be explained by the type of cell
attachment.
The use of flow rates in 2D experiments commonly used in 3D experiments would result in very
low bone formation activity as the shear forces are not high enough to activate bone formation on
flatly attached cells. On the other hand, the use of flow rates in 3D experiments similar to values in
2D experiments would result in the loss of a significant proportion of the cells, because the high
flow rates would wash many of the bridging cells off the scaffold.
Taken together, the results indicate that the cell morphology - in particular the type of cell
attachment - has a major impact on the magnitude of the deformation of the cells and thereby on the
activation of the bone formation process. Cells attached flatly to one strut and cells bridging two
struts were exposed to approximately the same wall shear stress and the same hydrostatic wall
pressure. However, the maximum displacement values of both types of cells varied significantly:
single strut cells showed an average maximum displacement of 3.4nm, whereas cells attached to
two struts experienced an average maximum displacement of 1.6µm.
The pore size of scaffolds for tissue engineering is very important. The optimal pore size must allow
the cells to migrate into the scaffold and provide the cells with a sufficient amount of nutrition.
cells are attached to the scaffold. As shown in the present work the sensitivity of the cells to the
mechanical load applied by a fluid flow dramatically changes with the type of the attachment.
Hence, the design of the optimal scaffold must take into account the interplay of the mechanical
load and the type of attachment and requires a design process that optimizes both parameters at the
Acknowledgements
We are very grateful to Dr. Alex Lennon for his technical support and assistance with the Linux
computer cluster.
This project was funded by a Science Foundation Ireland Industry Research Partnership with
Conflict of Interest
All authors declare they have no financial or personal relationships with other people or
References
[1] American Association of Orthopaedic Surgeons Report 2002
[2] F. R. A. J. Rose and R. O. C. Oreffo, Bone Tissue Engineering: Hope vs Hype, Biochemical and
Biophysical Research Communications 292:1-7, 2002
[3] E. Wintermantel and Suk-Woo Ha, “Medizintechnik mit biokompatiblen Werkstoffen und Verfahren”,
Springer Verlag, ISBN: 978-3540412618, 2002
[4] A. G. Mikos and J. S. Temenoff, Formation of highly porous biodegradable scaffolds for tissue
engineering, EJB Electronic Journal of Biotechnology 3(2): 1-6, 2000
[5] I. V. Yannas, E. Lee, D. P. Orgill, E. M. Skrabut, and G. F. Murphy, Synthesis and Characterization of a
Model Extracellular Matrix that Induces Partial Regeneration of Adult Mammalian Skin, Proc Natl Acad Sci U
S A 86:933-937, 1989
[6] F. J. O'Brien, B. A. Harley, I. V. Yannas, and L. Gibson, Influence of freezing rate on pore structure in
freeze-dried collagen-GAG scaffolds, Biomaterials 25:1077-1086, 2004
[7] E. Farrell, F. J. O’Brien, P. Doyle, J. Fischer, I. V. Yannas, B. A. Harley, B. O’Connell, P. J. Prendergast,
and V. A. Campbell, A Collagen-glycosaminoglycan Scaffold Supports Adult Rat Mesenchymal Stem Cell
Differentiation Along Osteogenic and Chondrogenic Routes, Tissue Engineering 12(3): 459-468, 2006
[8] C. C. Compton, C. E. Butler, I. V. Yannas, G. Warland, and Dennis P. Orgill, Organized Skin Structure Is
Regenerated In Vivo from Collagen-GAG Matrices Seeded with Autologous Keratinocytes, J Invest Dermatol,
110(6): 908-916, 1998
[9] G. N. Bancroft, V. I. Sikavitsas, J. van den Dolder, T. L. Sheffield, C. G. Ambrose, J. A. Jansen, and A. G.
Mikos, Fluid flow increases mineralized matrix deposition in 3D perfusion culture of marrow stromal
osteoblasts in a dose-dependent manner, Proc Natl Acad Sci USA 99(20):12600-5, 2002
[10] S. H. Cartmell, B. D. Porter, A. J. Garcia, and R. E. Guldberg, Effects of Media Perfusion Rate on Cell
Seeded 3D Bone Constructs In Vitro, Tissue Engineering 9(6):1197-1203, 2003
[11] M. J. Jaasma, N. A. Plunkett, and F. J. O’Brien, Design and validation of a dynamic flow perfusion
bioreactor for use with compliant tissue engineering scaffolds, J Biotechnology, Accepted for Publication,
2007
[12] P. J. Prendergast, R. Huiskes, and K. Søballe, Biophysical stimuli on cells during tissue differentiation at
implant interfaces, J Biomech. 30(6):539-548, 1997
[13] R. Smalt F. T. Mitchell, R. L. Howard, and T. J. Chambers, Induction of NO and prostaglandin E2 in
E758: 1997
[14] J. Vance, D. Galley, D. F. Liu, and S. W. Donahue., Mechanical Stimulation of MC3T3 Osteoblastic Cells
in a Bone Tissue-Engineering Bioreactor Enhances Prostaglandin E2 Release, Tissue Engineering
11,1832-1839, 2005
[15] B. Porter, R. Zauel, H. Stockman, R. Guldberg, and D. Fyhrie, 3-D computational modeling of media
flow through scaffolds in a perfusion bioreactor, J Biomech 38(3):543-549, 2005
[16] M. Cioffi, F. Boschetti, M. T. Raimondi, and G. Dubini, Modeling Evaluation of the Fluid-Dynamic
Microenvironment in Tissue-Engineered Constructs: A Micro-CT Based Model, Biotechnology and
Bioengineering, 93(3): 500-510, 2005
[17] J. G. McGarry, J. Klein-Nulend, M. G. Mullender, and P. J. Prendergast, A comparison of strain and fluid
shear stress in stimulationg bone cell responses – a computational and experimental study, FASEB Journal
19(3):482-4, 2005
[18] T. Gupta and T. L. H. Donahue, Role of cell location and morphology in the mechanical environment
around meniscal cells, Acta Biomaterialia 2(5): 483-492, 2006
[19] L. McMahon, The effect of cyclic tensile loading and growth factors on the chondrogenic differentiation
of bone-marrow derived mesenchymal stem cells in a collagen-glycosaminoglycan scaffold, PhD thesis,
Trinity College Dublin, 2007
[20] F. J. O’Brien, B. A. Harley, I. V. Yannas, and L. Gibson, The effect of pore size on cell adhesion in
collagen-GAG scaffolds, Biomaterials 26(4): 433-441, 2005
[21] M. Manimaran, F. E. H. Tay, and K. C. Chaw, Cell Deformation in Cancer Metastasis: a BioMEMS
Based Approach, Journal of Physics: Conference Series 34: 1143-1147, 2006
[22] M. J. Jaasma and F. J. O’Brien, Mechanical stimulation of osteoblasts by steady and dynamic fluid flow,
Tissue Engineering, In Review, 2007
[23] M. G. Haugh, M. J. Jaasma, and F. J. O’Brien, The Effect of Dehydrothermal Treatment on the
Mechanical and Structural Properties of Collagen-GAG scaffolds, Journal of Biomedical Materials Research
Part A, accepted, 2007
[24] B. A. Harley, J. H. Leung, E. C. C. M. Silva, and L. J. Gibson, Mechanical characterization of
collagen-glycosaminoglycan scaffolds, Acta biomaterialia 3(4), 463-474, 2007
[25] http://www.opencfd.co.uk/openfoam/
[26] H. Karcher, J. Lammerding, H. Huang, R. T. Lee, R. D. Kamm, and M. R. Kaazempur-Mofrad, A
3336-3349, 2003
[27] D. P. Theret, M. J. Levesque, F. Sato, R. M. Nerem, and L. T. Wheeler, The application of a
homogenous half-space model in the analysis of endothelial cell micropipette measurements, J Biomech
Eng. 110(3): 190-199, 1998
[28] N. Batra, Y. Li, C. Yellowley, L. You, A. Malone, C. Kim, and C. Jacobs, Effects of short-term recovery
periods on fluid-induced signaling in osteoblastic cells, J Biomech 38:1909-1917, 2005
[29] L.E. Claes and C.A. Heigele, Magnitudes of local stress and strain along bony surfaces predict the
course and type of fracture healing, J Biomechanics 32: 255—266, 1999
[30] D.R. Carter, G.S. Beaupré, N.J. Giori and J.A. Helms, Mechanobiology of skeletal regeneration, Clinical
Orthopaedics and Related Research 355S: S41–S55, 1988
[31] Y. Wang, L.M. McNamara, M. B. Schaffler, and S. Weinbaum, A model for the role of integrins in flow
induced mechanotranduction in osteocytes. PNAS 104(40), 15941, 2007
[32] S. Weinbaum, S. C. Cowin, and Y. Zeng, A model for the excitation of osteocytes by mechanical
loading-induced bone fluid shear stresses. J. Biomech. 27, 339, 1994
[33] U. Meyer, B. Kruse-Lösler, and H.P. Wiesmann, Principles of bone formation driven by biophysical
forces in craniofacial surgery. British Journal of Oral and Maxillofacial Surgery 44: 289-295, 2006
[34] C. Sandino, J. A. Planell, and D. Lacroix, A finite element study of mechanical stimuli in scaffolds for
bone tissue engineering 41: 1005-1014, 2008
[35] T. M. Freyman, I. V. Yannas, Y-S. Pek, R. Yokoo, and L. J. Gibson, Micromechanics of Fibroblast
Fig. 1: Flow perfusion bioreactor used in our laboratory to apply biophysical stimuli and thereby
increase the mechanical properties of cell-seeded collagen-GAG scaffolds [11,22].
Fig. 2: µCT scan of the unseeded collagen-GAG scaffold used to reconstruct the 3D geometry for
the sequential CFD-deformation simulation.
Fig. 3: The typical geometry of (a) a numerically seeded cell attached to two struts and of (b) a cell
flatly attached to one strut – blue elements are scaffold material, red elements are cells.
Fig. 4: 3D mesh of the reconstructed cell-seeded collagen-GAG scaffold (pore size ~96µm) used to
perform the CFD simulation (sub-volume number two) - blue elements are scaffold material, red
elements are cells.
Fig. 5: The magnitude of the fluid velocity (a) and the hydrostatic pressure (b) of the culture
medium inside the simulation volume (sub-volume number two) in x-z plane at y=320µm for an
inlet velocity of 235µm/s.
Fig. 6: Histogram distribution of the velocity of the culture medium inside the scaffold for an inlet
velocity of 235µm/s taking into account all three simulated sub-volumes (without inlet area).
Fig. 7: Histogram distribution of (a) the wall shear stress and (b) the hydrostatic wall pressure of all
three simulated sub-volumes acting on the walls (scaffold and cells).
Fig. 8: The average of the maximum and mean wall shear stress acting on the cells. The diagram
was created in a two step process. First, the maximum wall shear stress and the mean wall shear
shear stress (min) were averaged over all cells of an attachment group (taking into account only
cells inside the three 320µm x 320µm x 320µm inner cubes).
Fig. 9: The average displacement of cells attached to two struts (a) and to one strut (b). (max) and
(mean) display the average of the maximum and mean displacement of the cells, respectively. The
average was taken over all cells of a certain attachment type inside the three 320µm x 320µm x
320µm inner cubes. Note that the displacement in (a) is shown in [µm] and in (b) in [nm].
Fig. 10: Histogram distribution of the maximum displacement of cells attached to two struts (a) and
cells flatly attached to one strut (b). Note that the maximum displacement in (a) is shown in µm and