Abstract— Effects of simultaneous weld pool vibrations on
the tensile and fatigue strength of AISI SS 304L butt joint welded joints using gas tungsten arc welding process have been studied. A set up for inducing mechanical vibrations of constant frequency and amplitude in the weld pool was designed and fabricated. A comparative study of the welded joints under the influence of weld pool vibrations and in conventional mode was conducted. Crack tip opening displacement (CTOD) for measuring the fracture toughness and thus indicating the fatigue behaviour, and tensile testing of the welded joints were conducted in compliance of ASTM standards. Test results showed significant improvement in the strength of the joints welded under the effect of weld pool vibrations. Microstructural studies reveal that relatively fine-grained structures have been obtained in the joints which welded under the influence of weld pool vibrations. Weld pool vibrations were found to be effective and fruitful in controlling the grain refinement thereby improving the weld quality in terms of fatigue and tensile strength.
Key words—CTOD test, Grain refinement, Microstructure,
Tensile test, Weld pool vibrations.
I INTRODUCTION
he reason for deterioration in the mechanical strength may be attributed to the fact that the movement of dislocation in the crystal structure in case of coarse grain is much easier as compared to fine grained structure. In case of fine grained structure the movement of dislocation is restricted by more number of grain boundaries and higher dislocation density present in it [1-13]. This can make it more difficult for the dislocations to move and for the metal to get deformed. This may be one of the reasons why fine grained metal is stronger than the coarse grained metal [5]. During welding process the metal is heated close enough to melting point, converted to molten state and thereafter simultaneously cooling to room temperature, there arise the possibilities for the development of residual stresses in the welded joint. This could also be another reason to degrade the mechanical properties of the weldments [9]. Various techniques for grain refinement in weld metal have been studied so far by the many researchers, such as ultrasonic weld-pool vibration [1-3], mechanical vibration [5, 6, and 9], electromagnetic weld-pool vibration [16], and arc oscillation [8]. It was decided to undertake a comparative Dr. J.S.Gill- Corresponding author, Associate Professor, Mechanical engineering, SLIET, Longowal, Sangrur (Punjab), India.
T.Kalyan Reddy- Dept. of Mechanical engineering, SLIET, Longowal Sangrur (Punjab), India. [email protected]
study between the welded joints under conventional and simultaneous weld pool vibrations and to study the fatigue behaviour and tensile properties of butt welded AISI SS304L joints as this technique can turn to be advantageous to obtain finer grain structure [5].
II EXPERIMENTATION
B
ase and filler material combination Work pieces of dimensions 150 50 6 were cut from the stock and butt welded under the influence of weld pool vibrations and in normal or conventional mode i.e. without vibrations. Joint design for the present work was single V, with groove angle of 60º and root gap of 2. SS 308L stainless steel filler rod was used for joining the specimens. Table 1 and Table 2 show the chemical composition of base material and filler rod material respectively.
TABLE 1: CHEMICAL COMPOSITION OF BASE MATERIAL (SS 304L)
C %
Mn %
P% S% Si %
Ni %
Cr %
Mo %
Fe %
0.0 27
1.2 7
0.0 3
0.1 40
0.4 33
8.0 7
18. 09
0.2 Bal
TABLE 2: CHEMICAL COMPOSITION OF FILLER ROD (SS 308L)
C% Mn
%
P% S% Si% Ni% Cr
%
Fe%
0.02 4
1.32 0.03 0.00 9
0.58 9.51 19.9 4
Bala nce
A Weld pool vibrations
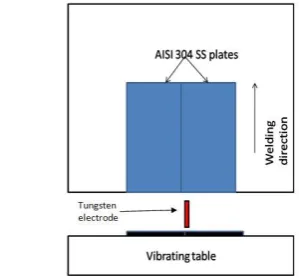
[image:1.595.335.485.619.759.2]A dc motor at 1200 rpm was used to produce vibrations to the base so as to develop constant frequency and amplitude of weld pool vibrations during the welding operation.
FIGURE 1: SCHEMATIC VIEW OF THE VIBRATING WORK TABLE
Effect of Weld Pool Vibration on Fatigue
Strength and Tensile Strength of Stainless Steel
Butt Welded Joints by GTAW Process
J.S. Gill, T. Kalyan Reddy
B Welding of specimens
[image:2.595.312.538.86.330.2]GTAW welding process was used with DC rectifier type power source with straight polarity in the experimentation. Tungsten electrode of diameter was used in the welding process. Filler metal AISI 308L of diameter was used. Shielding gas used was argon with gas flow rate of .
TABLE 3: WELDING PARAMETERS USED FOR THE EXPERIMENT Welding input current Type of pass Welding current (A) Welding speed (mm/s) Gas flow rate (L/min) Low Root pass
100 2.5 13
First pass
120 2.5 13
Second pass
120 2.5 13
High
Root pass
100 2.5 13
First pass
150 2.5 13
Second pass
150 2.5 13
[image:2.595.50.282.163.310.2]Welding was performed manually and speed of travel was maintained at mm/s throughout the welding of all the plates. Only welding current was varied from 120 A to 150 A, whereas all other parameters were kept constant for welding of all plates with and without vibrations of welding base. Table 3 gives the welding conditions used in the experimental work. Root pass at 100 A was given without using any filler followed by first and second pass to weld to fill the groove with filler rod feeding manually by the welder for each weld joint. All the necessary precautions like pre-cleaning of the groove edges and inter pass cleaning between consecutive weld passes were followed to avoid contamination of any sort, thus ensuring defect free welds. Inter pass temperature was maintained according to the standards. The plates were welded with and without vibration of the welding base with two heat input levels respectively. Scheme of experimentation is as shown in the Table 4.
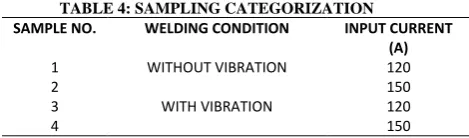
TABLE 4: SAMPLING CATEGORIZATION
Sample No. Welding condition Input current (A)
1 Without vibration 120
2 150
3 With vibration 120
4 150
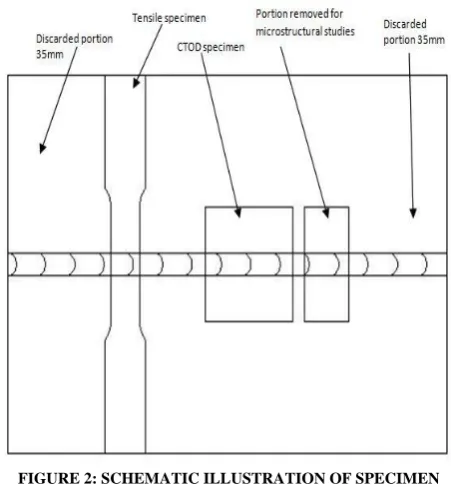
Specimens for compact tension test CTOD, tensile test and microstructural studies were sampled out from the welded plates as shown in the Figure 2. The specimens sampled out are according to ASTM standards for testing. Samples were cut from the welded plates using wire-cut EDM.
It was observed that the number of cycles took by specimens who were welded at low input current values under vibration produced the highest number of cycles among all the specimens. It is also observed that specimens welded under low input current i.e.120 A gave higher resistance to crack propagation than that welded with high input current 150 A. Resistance to crack propagation in CT specimens with weld pool vibrations is much higher as compared to without vibration. An improvement of 11% in the specimen welded with 150 A, whereas 25% with 120 A
when plates are welded in the influence of weld pool vibrations.
FIGURE 2: SCHEMATIC ILLUSTRATION OF SPECIMEN SAMPLING FROM WELDED PLATES
C Welding of Plates
GTAW welding process was used with DC rectifier type power source with straight polarity in the experimentation. Tungsten electrode of diameter was used in the welding process. Filler metal AISI 308L of diameter was used. Shielding gas used was argon with gas flow rate of .
TABLE 3: WELDING PARAMETERS USED FOR THE EXPERIMENT Welding input current Type of pass Welding current (A) Welding speed (mm/s) Gas flow rate (L/min) Low Root pass
100 2.5 13
First pass
120 2.5 13
Second pass
120 2.5 13
High
Root pass
100 2.5 13
First pass
150 2.5 13
Second pass
150 2.5 13
[image:2.595.313.524.463.618.2]contamination of any sort, thus ensuring defect free welds. Inter pass temperature was maintained according to the standards. The plates were welded with and without vibration of the welding base with two heat input levels respectively. Scheme of experimentation is as shown in the Table 4.
TABLE 4: SAMPLING CATEGORIZATION
SAMPLE NO. WELDING CONDITION INPUT CURRENT (A)
1 WITHOUT VIBRATION 120
2 150
3 WITH VIBRATION 120
4 150
Specimens for compact tension test CTOD, tensile test and microstructural studies were sampled out from the welded plates as shown in the Figure 2. The specimens sampled out are according to ASTM standards for testing. Samples were cut from the welded plates using wire-cut EDM.
D CTOD (Crack tip opening displacement) test
The Crack tip opening displacement or CTOD test measures the resistance of a material given to the propagation of a crack. CTOD testing is used on materials capable of plastic deformation before failure occurs causing the tip to stretch open. Accurate measurement of this displacement is one of the essentials of the test. Specimen size was cut from the welded plates according to ASTM E1820 standards. Pre crack or Initial crack of was provided by machining operation at the centre of the weld joint. The number of cycles it takes to extend the crack length from to was recorded by mounting a strain gauge on the specimen. Test was performed on 25KN closed-loop servo hydraulic testing system.
ETensile Test
Tensile test specimens were sampled out from each welded plate as shown below schematically in the Figure 2. Dimensions of the sample were according to ASTM E08 standards. Specifications of dimensions for the tensile test specimen are shown in the Figure 4. Test was performed on 25KN closed-loop servo hydraulic testing system.
F Microstructure analysis
In order to observe microstructural changes that took place during welding, corresponding to each input current value and vibration conditions, samples for microstructure analysis were polished with emery papers of various sizes viz. 100, 200, 400, 600, 800, 1000, 1200, 1500, 2000, 2500, 3000 and finally with diamond paste on the velvet cloth lapping to get the scratch less shiny mirror like finish for the microstructure studies. Following the polishing procedure specimens were etched using “Aqua regia” (hydrochloric acid and nitric acid in ratio 3:1) solution for 1minute. Microstructure of weld metal of different welding combinations viewed and captured using optical microscope coupled with an image analyzing software.
III.RESULTS AND DISCUSSION
T
he results are discussed under forthcoming various headings.A. CTOD test
[image:3.595.301.554.274.434.2]Compact tension i.e. CT specimen tested for CTOD (Crack Tip Opening Displacement) test which gives the number of cycles taken to grow a crack length from a pre-cracked length of 5.5 mm to reach the final length of 11.25 mm which means if number of cycles taken are less, the resistance offered by the material against deformation is low and if number of cycles are more the resistance against crack propagation is high. Results of samples are shown in the Table 5. It was observed that the number of cycles took by specimens who were welded at low input current values under vibration produced the highest number of cycles among all the specimens.
TABLE 5: NUMBER OF CYCLES TAKEN TO REACH THE DESIRED CRACK LENGTH
SAMPLE NO
INPUT CURRENT
VIBRATION CONDITION
NUMBER OF CYCLES TO REACH FINAL
CRACK LENGTH
1 LOW
WITHOUT VIBRATION
789940
2 HIGH 454210
3 LOW WITH
VIBRATION
989478
4 HIGH 503798
Figures 3 (A to D) given below show the graphs plotted between the number of cycles (N) and the crack length for each CT specimen.
FIGURE 3 (A) PLOT BETWEEN THE CRACK LENGTH (MM) AND NUMBER OF CYCLES (N) FOR LOW INPUT CURRENT
FIGURE 3 (B) PLOT BETWEEN THE CRACK LENGTH (MM) AND NUMBER OF CYCLES (N) FOR LOW INPUT CURRENT WITH
WELD POOL VIBRATIONS
FIGURE 3 (C) PLOT BETWEEN THE CRACK LENGTH (MM) AND NUMBER OF CYCLES (N) FOR HIGH INPUT CURRENT
WITH CONVENTIONAL WELDING
FIGURE 3 (D) PLOT BETWEEN THE CRACK LENGTH (MM) AND NUMBER OF CYCLES (N) FOR HIGH INPUT CURRENT
WITH VIBRATION WELDING
It is also observed that specimens welded under low input current i.e.120 A gave higher resistance to crack propagation than that welded with high input current 150 A. Resistance to crack propagation in CT specimens with weld pool vibrations is much higher as compared to without vibration. An improvement of 11% in the specimen welded with 150 A, whereas 25% with 120 A when plates are welded in the influence of weld pool vibrations.
[image:4.595.50.287.49.228.2]B Tensile Test
TABLE 6: TENSILE STRENGTH OF THE JOINTS WELDED UNDER VARIOUS CONDITIONS
SAMPLE NO
INPUT CURRENT
VIBRATION CONDITION
TENSILE PROPERTIES ULTIMATE
TENSILE STRESS
(MPA)
YIELD STRESS
(MPA)
1 LOW WITHOUT
VIBRATION
599.112 479.331
2 HIGH 558.245 446.622
3 LOW WITH
VIBRATION
623.134 498.542
4 HIGH 607.498 486.005
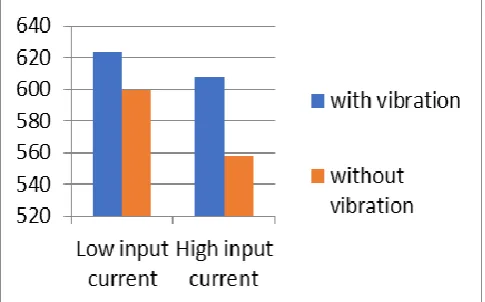
[image:4.595.53.285.292.466.2]Tensile strength of the all the welded joints were tested by sampling the specimen across the weld joint and were evaluated. In each condition of input current and the vibration condition, the corresponding ultimate tensile strength and the yield strength obtained are mentioned in the Table 6. The variations of ultimate tensile stress of welded joints at various combinations of welding parameters can be observed graphically in the Figure 6. It is observed that specimens welded with low input current gave higher tensile strength that those welded with high input current. Welding with vibration significantly improves the tensile strength of the joint as compared to the joint which is conventionally welded. The improvement in tensile strength of the specimens welded with low input current is less significant as compared to high welding current which is 4 % and 8.8% respectively.
FIGURE 4 VARIATION IN ULTIMATE TENSILE STRENGTH (UTS) VALUE
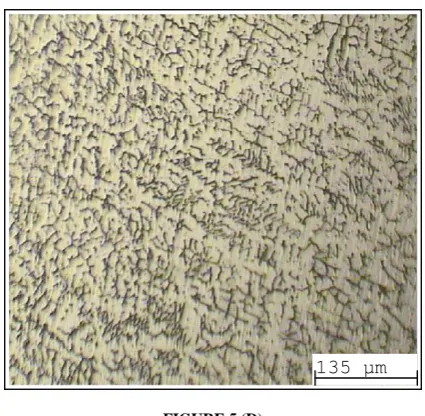
C Microstructural Studies
[image:4.595.306.549.504.655.2] [image:4.595.54.283.522.697.2]FIGURE 5 (A)
FIGURE 5 (B)
FIGURE 5 (C)
FIGURE 5 (D)
Figure 5 (A) & (B) shows the microstructure of weld metal which was deposited at low heat input by conventional and vibration welding respectively.
Figure 5 (C) & (D) shows the microstructure of weld metal which was deposited by conventional and vibration welding respectively. From the microstructure of different weld metal, it was observed that fine grain structure is observed at low heat input value.
Vibration welding results in equiaxed and fine grain structure. The fine and equiaxed grain structure was observed in metal joint which is welded at low heat input current and with simultaneous vibration of welding base.
IV. CONCLUSIONS
Weld pool vibrations or weld pool oscillations have shown significant effect on the mechanical and microstructural behaviour of weld joints as compared to the weld joints which were welded without weld pool vibrations i.e. by conventional welding process. Following conclusions can be drawn from the facts studied during present work: 1.Adequate joint strength was exhibited by all the joints which shows that welding of 6mm thick plate of AISI 304L SS welded by GTAW process offering good quality weld to the fabricator.
2.Number of cycles taken to grow crack up to desired level, for the joint which was welded with low current input value and simultaneous vibration welding observed to be significantly high as compared to the joints without weld pool vibrations or high input current. This indicates the better endurance of the material under fatigue load when welded with vibrations and low input current.
3.Tensile properties of the weld joints both under low current and high current with weld pool vibrations showed a marked improvement over the weld joints fabricated with conventional GTAW process. This can also be attributed to the grain refinement during welding under the influence of continuous vibrations.
4.As compared to high welding current and low welding current, It was further observed that the microstructure of the weld metal fabricated under low welding current is finer and equiaxed when welding under vibration and thus better results of CTOD testing and tensile strength testing are obtained.
135 µm
[image:5.595.320.533.46.254.2] [image:5.595.64.278.47.722.2] [image:5.595.66.275.51.256.2]REFERENCES
[1] Meiyan Lia,Bin Han, Yong Wang, Lixin Song, LanyangGuo. Investigation on laser cladding high-hardness nano-ceramic coating assisted by ultrasonic vibration processing. Optik, Science Direct,Vol 1 No.27, January 2016, 4596-4600.
[2] Tao Yuan, Sindo Kou, Zhen Luo. Grain refining by ultrasonic stirring of the weld pool. ActaMaterialia Inc. Elsevier Ltd .Vol106 January 2016, 144-154.
[3] S. HabibAlavi, Sandip P. Harimkar. Melt expulsion during ultrasonic vibration-assisted laser surface processing of austenitic stainless steel. Ultrasonics, Science Direct,Vol 59, January 2015, 21-30.
[4] Hongxi Liu, QianXu ,Chuanqi Wang, Xiaowei Zhang. Corrosion and wear behaviour of Ni60CuMoW coatings fabricated by combination of laser cladding and mechanical vibration processing. Journal of Alloys and Compounds,Elsevier,Vol 621, October 2014, 357-363. [5] A Mostafapour, V. Gholizadeh. Experimental investigation of the
effect of vibration on mechanical properties of 304 stainless steel welded parts. International journal of Advance Manufacturing Technology,Vol 70,Spinger, August 2011, 113-1124.
[6] P Sakthivel, P Sivakumar. Effect of vibration in TIG and arc welding using AISI316 stainless steel .International Journal of Engineering Research and Science &Technology,Vol 3,No 4, November 2014, 117-130
[7] Y. Sharir, J. Pelleg, A. Grill. Effect of arc vibration and current pulses on microstructure and mechanical properties of TIG tantalum welds Metal Technology, Taylor & Francis, December 2013, 190-196 [8] Chih-Chun Hsieh, Chien-Hong Lai, and Weite Wu. Effect of vibration
on microstructures and mechanical properties of 304 stainless steel GTA welds. Met.Mater.Int., Vol. 19, No.4, Springer, April 2012, 835-844.
[9] Ashwe Abugh, Kunchy I.K. Microstructure and mechanical properties of vibrated castings and weldments: A review. Journal of Engineering Studies and Research – Volume 19, No.1, 2013, 7-12.
[10] Jaskirat Singh, Gaurav Kumar, Narayan Garg. Influence of vibrations in arc welding over mechanical properties and microstructure of butt-welded-joints. International Journal of Science &Technology,Vol 2, Issue 1, February 2012, 1-6.
[11] K. BalasubramanianS.Raghavendran, V. Balusamy. Studies on the effect of mechanical vibration on the microstructure of the weld metal. International journal of technology and engineering systems,Vol 2(3), 2011, 253-256.
[12] ShufengWanga, Huiqi Li, Xiang Chen, Jing Chia, Min Li, Lu Chai, HuiXu. Improving microstructure and wear resistance of plasma clad Fe-based alloy coating by a mechanical vibration technique during cladding. Materials Science and Engineering, Science Direct,Vol A 528, September 2011, 397-401.
[13] Takehiko Watanabe, Masataka Shiroki, Atsushi Yanagisawa, Tomohiro Sasaki. Improvement of mechanical properties of ferritic stainless steel weld metal by ultrasonic vibration. Journal of Materials Processing Technology,Vol 210, Elsevier, May 2010. 1646-1651. [14] Subodh Kumar, A.S. Shahi. Studies on metallurgical and impact