warwick.ac.uk/lib-publications Manuscript version: Author’s Accepted Manuscript
The version presented in WRAP is the author’s accepted manuscript and may differ from the published version or Version of Record.
Persistent WRAP URL:
http://wrap.warwick.ac.uk/108527
How to cite:
Please refer to published version for the most recent bibliographic citation information. If a published version is known of, the repository item page linked to above, will contain details on accessing it.
Copyright and reuse:
The Warwick Research Archive Portal (WRAP) makes this work by researchers of the University of Warwick available open access under the following conditions.
© 2019 Elsevier. Licensed under the Creative Commons Attribution-NonCommercial-NoDerivatives 4.0 International http://creativecommons.org/licenses/by-nc-nd/4.0/.
Publisher’s statement:
Please refer to the repository item page, publisher’s statement section, for further information.
2
1, 2 * Steven Marwaha, 3Charlotte Price, 4Jan Scott, 5Scott Weich, 1Aimee Cairns, 3
6Jeremy Dale, 1Catherine Winsper, 2Matthew R. Broome 4
5
1Mental Health and Wellbeing, Division of Health Sciences, University of Warwick
6
CV47AL, UK 7
2 Institute for Mental Health, University of Birmingham, Edgbaston, Birmingham, B15 2TT,
8
UK 9
10
* Corresponding author 11
12
3 Operational Research and Management Sciences Group, Warwick Business School, 13
University of Warwick, CV4 7AL, UK 14
15
4Institute of Neuroscience, Newcastle University, Newcastle upon Tyne, UK and
16
IOPPN, Kings College London, UK 17
18
5 Mental Health Research Unit, School of Health and Related Research (ScHARR), 19
University of Sheffield, Regent Court, 30 Regent Street, Sheffield S1 4DA, UK 20
21
6 Department of Primary Care, Warwick Medical School, University of Warwick, CV47AL,
22
UK 23
24 25
Word count: 4292 26
28
1. Introduction 29
Affective Instability (AI) is a transdiagnostic symptom (Broome et al., 2015b; Henry et al., 30
2001b). It has been defined as rapid oscillations of intense affect, with difficulty regulating 31
these or their behavioural consequences (Marwaha, 2013). Multiple strands of evidence have 32
associated AI with suicidal thinking (Palmier-Claus et al., 2012; Yen et al., 2004), health 33
service use (Marwaha et al., 2013c), new onset of depression (Marwaha et al., 2015), 34
psychotic symptoms (Marwaha et al., 2013a), onset of bipolar disorder and increasing time to 35
recovery (Howes et al., 2011; Stange et al., 2016). It is also independently linked to greater 36
medication use and detention under mental health legislation (Patel et al., 2015). It is 37
associated with childhood trauma experiences (including abuse) and it is suggested that it 38
may partly explain the connection between these and psychiatric disorders (Aas et al., 2016; 39
Marwaha et al., 2016; Moffa et al., 2017). The estimated prevalence of AI in the general 40
population is 14%, with levels being higher in younger people and women (Marwaha et al., 41
2013c; Patel et al., 2015). We (Broome et al., 2015a), and others (Harrison et al., 2017) have 42
suggested that trans-diagnostic investigation of AI is compatible with the NIMH Research 43
Domain Criteria project (Insel, 2014), a framework for understanding mental disorders by 44
study of dysfunction in individual psychological and biological systems. 45
46
Through systematically reviewing the literature we have previously identified AI as 47
having three core affect components: intensity, lability, and ability to control the oscillations 48
or their behavioural consequences (Marwaha et al., 2014). The review also identified that 49
comprehensive measurement of all three components is rarely undertaken. The current 50
literature is limited in part by theoretical and methodological heterogeneity in how AI is 51
be compared, and hence understanding whether AI is similar in different disorders and how it 53
contributes to outcomes such as functioning are hard to ascertain. As such, there is a 54
significant gap in understanding this clinical phenomenon. A second major shortcoming of 55
the current literature is that nearly all studies to date, apart from a few notable exceptions 56
(Ben-Zeev and Young, 2010; Ben-Zeev et al., 2009), have lacked comparisons with 57
individuals without mental disorder. This means it is unclear how far AI represents 58
psychopathology needing intervention or indeed whether it is a core aspect of abnormal 59
mental states, or is a feature of normal mental life. 60
61
To our knowledge, only three studies to date have compared AI in different diagnostic 62
groups using the same assessment procedures but limiting assessment of AI to two if its 63
domains. Henry et al. (2001a) examined AI using the Affect Lability Scale (ALS) and Affect 64
Intensity Measure (AIM) in out-patients with Borderline Personality Disorder (BPD) (N=29), 65
bipolar disorder: type II without BPD (N=14), BPD and bipolar disorder: type II (N=12), and 66
no BPD or bipolar disorder but other personality disorders (N=93). Lability scores were 67
significantly (p< 0.05) higher in BPD, whilst bipolar patients tended (p=0.06) to have higher 68
lability scores than other personality disorders. No differences in affect intensity were 69
observed. 70
71
In a similar study those with bipolar disorder had significantly higher scores on the 72
euthymia-elation subscale of the ALS as well as significantly higher scores on affect 73
intensity, whereas those with BPD experienced more shifts between anxiety-depression, 74
euthymia-anger and significantly fewer shifts between euthymia-elation and depression-75
elation (Reich et al., 2012). Most recently Richard-Lepouriel et al (Richard-Lepouriel et al., 76
hyperactivity disorder (ADHD) and controls (dentistry students and doctors). Those with 78
ADHD and bipolar disorder scored higher on ALS than controls, with AIM scores being 79
highest for ADHD. Whilst affective lability appears to be higher in BPD, and people with 80
bipolar disorder, results for affective intensity are discrepant between studies with some 81
evidence that affective intensity may be higher in people with mental disorders than in 82
controls. 83
84
Given the paucity of previous research, we aimed to expand the diagnostic groups in 85
which AI is examined (given the suggestion that AI is transdiagnostic), compare these 86
“cases” with psychologically “healthy controls”, assess AI more comprehensively, and test 87
whether AI is independently linked to functioning within a clinical population. 88
89
2. Aims 90
91
We aimed to answer the following research questions: 92
93
1. Does affective instability differ between clinical cases and controls and between 94
diagnostic groups? 95
2. To what extent are measures of affective lability, intensity and ability to control affect 96
correlated in a trans-diagnostic clinical sample? 97
3. Is affective instability associated with functioning in a clinical population independent 98
of diagnosis? 99
3. Methods 100
We undertook a case-control study among users of secondary care mental health services 101
(cases) and primary care attenders without evidence of current mental disorder (controls). 102
Participant consent and data collection was completed by an experienced researcher with a 104
psychology background. 105
106
3.1 Participants 107
108
Individuals with a range of diagnoses were recruited from secondary care mental 109
health services within Coventry and Warwickshire, UK through convenience sampling. The 110
aim was to include individuals who were representative of the ‘typical’ case mix of these 111
services, so participants were recruited in out-patient departments, day hospitals, community 112
mental health teams and a specialist personality disorder service. Inclusion criteria were: a] 113
aged 18-65 years; b] capacity to give informed consent; c] the primary reason for attending 114
the mental health service was for management of a clinical diagnosis of BPD, bipolar 115
affective disorder, major depressive episode (moderate or severe depressive episode) or non-116
affective psychosis as reported by a Consultant Psychiatrist. The researcher confirmed the 117
diagnosis with the Psychiatrist using ICD-10 criteria. 118
119
Exclusion criteria were: a] an acute illness episode (sufficient to require urgent or 120
inpatient care) according to the patient’s Consultant Psychiatrist; b] unable or unwilling to 121
complete the assessments (e.g. individuals with a clinically assessed learning disability, with 122
insufficient command of the English language to understand and complete questionnaires); or 123
c] individuals with a primary ICD-10 diagnosis of dependency to drugs or alcohol (to avoid 124
confounding by drug or alcohol misuse). 125
126
Control participants were recruited from primary care (general practitioner surgeries). 127
Physicians asked patients if they were interested, a researcher in the waiting room then 128
consented the patients and completed the battery of questionnaires. Exclusion criteria for the 129
disorders such as depression or anxiety disorders); b] dependency on substances or alcohol; 131
c] previous diagnosis of BPD, bipolar disorder, or non-affective psychosis, according to their 132
primary care records. 133
134
3.2 Materials 135
136
Details were collected on participants’ diagnosis (for cases) and confirmed by their 137
Consultant Psychiatrist. Details on duration of illness (cases only) and current medications 138
were identified by a researcher, from clinical records. Medications were grouped as anti-139
psychotic, anti-depressant, anti-anxiety, mood stabiliser, anti-depressant/mood-stabiliser or 140
‘other’ (medication not directly related to the patient’s psychiatric diagnosis). 141
Sociodemographic information was collected on age (years), gender, marital status 142
(married/cohabiting, single, separated/widowed), employment (employed, unemployed, 143
other), ethnicity (White British, other), and highest education level (None/GCSE, A Level, 144
Degree/higher degree) (see Table 1). 145
146
3.3 Assessment scales 147
148
Participants were asked to complete four questionnaires relating to affective / mood 149
instability. 150
1. The Affective Lability Scale - short form (ALS-18) (Harvey et al., 1989), is a 151
reliable and valid measure comprising 18 items coded 0-3. Overall score is 152
obtained by taking the mean of the scores for each item as indicated by the scale 153
developers. Three subscales can be derived; ‘anxiety-depression’, ‘depression-154
elation’, and ‘anger’. 155
2. The Affective Intensity Measure-20 (AIM) (Larsen et al., 1986a) was used to 156
overall score is obtained by taking the mean of the scores for each item. The AIM 158
has good internal consistency, test-retest reliability and construct validity (Larsen 159
et al., 1986b). 160
3. The Affective Control Scale (ACS) (Williams et al., 1997) comprises 42 items, 161
coded 1 to 7 (with some items requiring reverse scoring); it has good 162
psychometric properties including construct validity. A higher ACS score 163
indicates reduced ability to control affect. Four subscales can be derived; ‘anger’, 164
‘positive affect’, ‘depressed mood’, and ‘anxiety’. 165
4. Mood fluctuation rate: Because of the lack of a previously well validated scale for 166
fluctuation rate (Marwaha, 2013) we used a new bespoke schedule for this study. 167
Mood fluctuation rate was assessed using a question from the Structured Clinical 168
Interview for DSM Disorders (SCID). It asks the respondent to state how often 169
they experienced a sudden marked shift in mood. Study participants rated the 170
number of significant mood fluctuations they experienced over a week. 171
Respondents were asked to consider this for each one of the weeks in the last 172
month prior to assessment, and possible responses were 0, 1-3, 4-7, or >7 mood 173
changes over each week. 174
175
Functioning was measured using the WHO Disability Assessment Schedule 2.0 – 12 176
item version (WHODAS; (Üstün, 2010). This contains 12 items each coded 0 to 4. To obtain 177
a person’s final score, the simple version entails summing the scores from each of the 12 178
items, scores range from 0-48. For consistency in comparing with the other scores above, the 179
181
3.4 Data analysis 182
183
Descriptive statistics including means/medians with standard deviations/interquartile ranges, 184
or frequencies with percentages where relevant, were used to investigate participant 185
demographics and characteristics of AI in the different diagnostic groups and controls. There 186
are no clear rules about the acceptable fraction of missing data to justify imputation. As such, 187
we decided on 10%, as a level that would allow imputation, thus enabling us to use as much 188
of the data as possible, whilst also retaining reliability and accuracy (Steyerberg, 2008). As 189
such scores were imputed if the patient had less than 10% missing items. This translates as: 190
AIM: Up to 2 missing values, ALS-18: Up to 2 missing values, ACS: Up to 4 missing values, 191
WHODAS: 1 missing value. 192
193
Two sample t-tests were used to compare means between the cases and controls after 194
verifying that relevant assumptions were valid. Proportions were compared using chi-squared 195
tests. General linear models (GLMs) were used to compare the mean lability (ALS), intensity 196
(AIM), and subjective ability to control affect (ACS) outputs across cases (different 197
diagnostic groups) and the control group. Adjustment was made for age, sex and educational 198
level if necessary. Model assumptions were checked and, in the case of an overall significant 199
difference in mean score across the diagnosis groups, pairwise post-hoc comparisons of 200
adjusted mean scores were performed with a Bonferroni correction. To investigate how far 201
the different aspects of affective instability correlate with each other, the linear association 202
between each pair of measurement scales for the full sample and for the cases only was 203
assessed using Pearson’s product moment correlation. Association between each 204
measurement scale and the mood fluctuation rate was assessed using Spearman’s rank 205
207
Multiple regression was used to examine the association between affective instability 208
and general assessment of functioning as measured by the WHODAS (Üstün, 2010) in 209
clinical cases, adjusting for diagnosis and other patient characteristics. A purposeful selection 210
approach was used to fit the model. Manual backward elimination was first used to remove 211
variables based on Wald statistics using p = 0.05 as the cut-point for removal. Removed 212
variables were then re-entered into the model one-by-one to check their significance. 213
Variables initially considered in the model included: (a) socio-demographics: age, sex, 214
ethnicity, education level, marital status, (employment status was not considered in the model 215
since the WHODAS incorporates this parameter in ratings), (b) illness characteristics: 216
diagnosis, duration of illness, total number of medications, (c) AI measures: mood fluctuation 217
rate and the mean scores for the ACS, ALS-18 and AIM. All analyses were conducted in 218
IBM SPSS Statistics 24. 219
220
4. Results 221
222
4.1 Participant characteristics 223
224
The initial dataset comprised 101 participants, but 9 individuals were excluded due to 225
missing data (3 bipolar, 2 major depression, and 2 controls). Hence the final sample (N=94) 226
comprised of 69 cases and 25 controls. 227
228
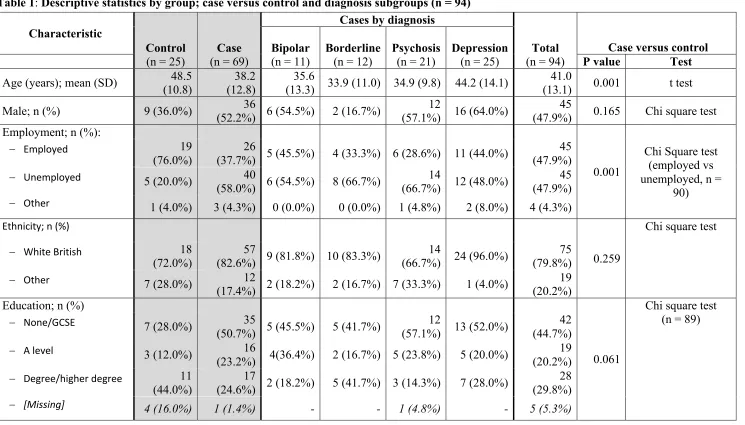
Table 1 describes the socio-demographic characteristics of included participants by 229
group (case versus control), and diagnostic subgroups (bipolar disorder (n=11), BPD (n=12), 230
psychosis (n=21), and major depression (n=25)). There was a significant difference between 231
cases and controls in mean age (p=0.001), employment status (p=0.001) and marital status 232
(Marwaha et al., 2013b). Duration of illness was recorded in the dataset for 67 out of the 69 234
cases and was positively skewed with the sample having been ill for a median duration of 36 235
months (interquartile range (IQR) 15-156 months). Across the diagnostic groups, participants 236
with depression reported the longest duration of illness (median 120 months, IQR 12-258), 237
followed by participants with BPD (median 36 months, IQR 24-120), psychosis (median 27 238
months, IQR 20.5-111), and bipolar disorder (median 24 months, IQR 9-36), respectively. 239
240
Table 1 about here 241
242
The commonest class of medication prescribed was anti-depressants, and most patients 243
reported being prescribed one (25%) or two (25%) medications. Seventeen percent of cases 244
(N=12) were not taking any medication. We did not explore, type of medications and their 245
impact on our results because of the lack of a robust typology of the effectiveness of 246
medications indicated for affective instability (Lieb et al., 2010). 247
248
4.2 Comparison of questionnaire scores between cases and controls 249
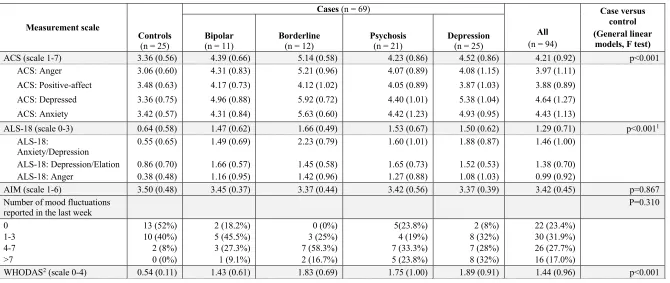
Differences in the unadjusted mean scores between cases and the controls for all 250
measures are presented in Table 2. Age and sex were found not to be significant across the 251
sample in the general linear model (GLM) for the ACS, AIM, and WHODAS scores; whilst 252
there was trend towards significance for the effect of age on ALS score (P = 0.068). 253
254
Table 2 about here 255
256
Affect lability (ALS): When adjusted for age, a statistically overall significant 257
7.195, p < 0.001). Post-hoc pairwise comparisons of mean scores revealed significantly lower 259
mean ALS-18 scores for the control group compared to each diagnosis group but no 260
significant differences between diagnoses. 261
262
Affect intensity (AIM): There was little difference in the mean AIM scores between 263
groups, with slightly higher mean scores found for controls compared to cases. These 264
differences were not statistically significant (p = 0.867). 265
266
Ability to control affect (ACS): An overall significant difference was found between 267
mean ACS scores across the different diagnostic groups, including controls (F (4,89) = 268
14.520, p < 0.001). Post-hoc pairwise comparisons of the mean scores revealed significantly 269
higher mean ACS scores (meaning lower control) for each diagnostic group compared to 270
controls (p < 0.05). A significant difference was also found between the mean scores in 271
borderline personality disorder patients and patients with non-affective psychosis (p = 0.010). 272
273
Mood fluctuations in the last week: Table 2 shows the number of participants (i.e. 274
frequency with percentage) who reported each number of mood fluctuations over the past 275
week prior to assessment. This revealed that cases tended to have more changes in their mood 276
state than controls, although no overall differences were found in rate of mood fluctuation 277
between groups (p=0.310). Those with major depression reported the greatest number of 278
mood fluctuations in the last week, followed by non-affective psychosis, borderline 279
personality disorder and then bipolar disorder. 280
281
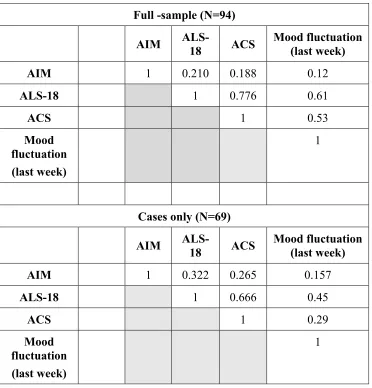
Correlations are shown in table 3. Strong positive correlations were found between 283
the ALS and the ACS in the full and cases only analysis. Weak to moderate correlations were 284
found between the AIM and the ALS. When assessing the association between each 285
measurement scale and mood fluctuation rate ‘last week’, moderate to strong positive 286
correlations were found between mood fluctuation and ALS and ACS. There was a weak 287
correlation between AIM and mood fluctuation rate. All correlations were weaker when 288
focusing on the cases only. 289
290
Table 3 about here 291
292
4.4 AI and functioning 293
294
In the clinical sample, an overall significant difference was observed between mean 295
WHODAS scores across the different diagnosis groups, F (4,89) = 11.454, p < 0.001 (p < 296
0.05 for bipolar disorder). Post-hoc pairwise comparisons revealed significantly lower mean 297
WHODAS scores for the control group compared to each diagnosis group, as might be 298
expected, but differences between diagnostic groups were not significant. 299
300
A multiple regression model investigating factors associated with the WHODAS 301
score, demonstrated that both ALS-18 and ACS scores were significantly associated with 302
current level of functioning. After correcting for multicollinearity, ALS-18 score was retained 303
in the final model (beta=0.845, p<0.001), along with the total number of medications 304
(beta=0.107, p<0.046). All other variables considered, including diagnosis, were not 305
significantly associated with WHODAS score in the final model. 306
307
5. Discussion 308
5.1 Main findings 310
311
This is the first study, to our knowledge, that has comprehensively assessed the core 312
components of affective instability in a trans-diagnostic clinical population and compared 313
clinical cases with a control group without mental disorder. We found only affective lability 314
and affective control is significantly different in people with a range of mental disorders in 315
comparison to those without. No differences were observed between people with and without 316
mental disorder in the intensity of affect experienced or the rate of mood fluctuation in the 317
last week. Two of the three components of affective instability (lability and intensity) did not 318
differ significantly between individuals with different psychiatric diagnoses, although ability 319
to control affect was significantly different in individuals with BPD in comparison to non-320
affective psychosis. Whilst the small numbers within each diagnostic group mean that 321
interpretation can only be exploratory, contrary to expectation, we found that the greatest 322
number of mood changes in a week was experienced by people with major depression, 323
followed by non-affective psychosis, BPD and then bipolar disorder. 324
325
In terms of the affective instability construct, the strongest inter-correlation was found 326
between lability and ability to control affect, with much weaker (modest) correlations 327
between affective intensity and ability to control affect (or lability and control). Finally, only 328
affective lability, but not affective intensity, ability to control affect or mood fluctuation rate 329
was associated within functioning independent of diagnosis and other important confounders. 330
331
5.2 Limitations 332
333
Our sample size was relatively modest (just under 100). This limited the statistical 334
power of our analyses and increased the risk that our results might be due to type II error. 335
should be considered entirely exploratory, and other interpretations tentative. Another caveat 337
to comparisons between diagnoses is that we did not complete inter-rater reliability 338
assessments. However, this is the largest study to date exploring our questions. 339
340
Our observations related to affective instability are limited to the four mental 341
disorders that we sampled. We cannot therefore generalize our findings to other disorders, 342
where affective instability is known to be important such as OCD (Bowen et al., 2015) or 343
ADHD (Asherson et al., 2007). Furthermore, we could not take into account the contribution 344
made by mental or physical comorbidities in our sample. However, given our sample of cases 345
were those in contact with secondary mental health services there are likely to be high levels 346
of comorbidity. Therefore, it is possible that high levels of affective lability and problems 347
with affective control are linked to comorbidity and this should be the focus of future studies. 348
In our regression modelling we were not able to control for some factors known to impact 349
functioning such as cognition, illness severity, premorbid functioning and depressive 350
symptoms. 351
352
The cases sampled were not in an acute illness episode and it is conceivable that this 353
biased estimate of group difference towards the null, that is, there is no difference between 354
the cases and controls on affective instability measures. Affect intensity (and possibly 355
instability) might vary with illness acuity, which might explain why differences between 356
cases and controls in the present study were smaller than those reported in an in-patient 357
sample (Henry et al., 2008; Reich et al., 2012). Whilst we did not assess illness severity, we 358
adjusted for illness duration and number of medications, both of which might be expected to 359
be associated with illness severity. More specifically, we also did not assess current mood 360
mood (e.g depth of depression) could have impacted on our results. There is little current 362
evidence on how far AI changes, as mood becomes lower or more elated to guide how this 363
could have influenced out main findings. Indeed, in bipolar disorder, AI is found in both 364
euthymic and periods of acute illness (Harvey, 2008). We explored whether AI is different 365
between cases and controls. Future studies should also aim to explain the differences between 366
affective instability in people with mental disorders and without. 367
368
We used assessment measures which require recall of affective experiences. These 369
may be prone to bias, particularly when compared to ecological momentary assessments 370
(EMA) (Broome et al., 2015b). How accurately people with mental disorders recall their 371
affective experiences might differ depending on diagnosis. The ratings themselves at an 372
individual level may also be dependent on an initial calibration to understand what is meant 373
by a “marked” shift in mood (Holmes et al., 2016). Therefore, paradoxically individuals with 374
fewer mood fluctuations may better report retrospective fluctuations as they would have 375
stood out in their experience, whilst those with more frequent fluctuations may only report 376
“marked” ones, as small fluctuations were perhaps normalised by their experience. This is 377
one potential explanation of why depressed patients reported more fluctuations than other 378
groups, though this was not statistically significant. The question used to assess mood 379
fluctuation didn’t specify type of affect and therefore could have excluded swings in anger 380
and irritability, which have been shown to differentiate between diagnosis (Tsanas et al., 381
2016). We also recognise that current mood state may have impacted on assessment. 382
383
Whilst momentary assessment of psychopathology appears feasible using 384
smartphones (Tsanas et al., 2016), it is as yet unclear whether retrospective affective 385
especially as the former will be subject to important cognitive processes (e.g contextual 387
processing), which control how mood is experienced (Dubad et al., 2018). There is also the 388
issue of how far individuals recognize and name affective states in the same way. 389
390
5.3 Theoretical and clinical implications 391
392 393
Our findings only partly validated our original definition of affective instability as a 394
trans-diagnostic parameter incorporating affect lability, ability to control and intensity 395
(Marwaha et al., 2014). Affect lability and the ability to control these were indeed found to 396
occur at higher levels than in controls and at similar levels across the different diagnostic 397
groups. Scores on both measures were also relatively strongly correlated with each other re-398
enforcing the notion that they are facets of the same or similar underlying latent construct. 399
Affective intensity was only relatively weakly associated with other affective instability 400
measures. Replication in a much larger sample is required to understand how far this pattern 401
holds true. In the current study affective intensity was no different between cases and controls 402
or between the cases themselves consistent with previous literature (Henry et al., 2001b). 403
Whilst caution is necessary in interpretation, this does suggest that intensity of affect may not 404
be a feature that may help delineate the boundaries of “normal” or “abnormal” affective 405
experience, or at least in the way that it was measured here. Again, a study with a larger 406
sample size is required. 407
408
Mood fluctuation rate (as measured by our bespoke instrument) showed some 409
concurrent validity with two measures of affective instability, and surprisingly, fluctuation 410
rate was no different between cases and controls. This may be a function of our sample size, 411
assessments to investigate this area. Crucially, these studies need to include people without 413
mental disorders as controls. 414
415
We used a comprehensive way to measure affective instability in people with 416
different diagnoses and the current results as well as previous research provides some 417
counterbalance to the notion that affective instability is specific to or more severe in people 418
with bipolar disorder or borderline personality disorder. The challenge now is to understand 419
whether more subtle differences exist that may be clinically useful, such as whether a 420
particular valence change is more or less common in different disorders (Reich et al., 2012) 421
or whether richer, digitally captured mood data is helpful in differentiating disorders. Current 422
evidence indicates clinicians do not use diagnostic criteria effectively to distinguish disorders 423
such as BPD and bipolar disorder in which affective instability symptoms are seen to overlap 424
(Saunders et al., 2015). Further research into common and uncommon valence changes in the 425
disorders, perhaps incorporating digital mood monitoring, may help to resolve this clinical 426
difficulty. 427
428
Finally, we demonstrate that affective instability independently adversely impacts 429
functioning in people with mental disorders, and this is independent of diagnosis. The 430
measure of functioning that we used suggests the impact could be on multiple domains 431
including learning new tasks, joining in community activities, day to day work and 432
maintaining friendships. We have previously found that interpersonal conflict is part of the 433
pathway from affective instability and incident depression (Marwaha et al., 2015) and the 434
current study is also consistent with other work highlighting the impact of affective instability 435
We extend these previous findings by identifying that affective lability, as opposed to other 437
aspects of AI such as ability to control affect or intensity, has the greatest impact. 438
439
As such affective lability has the potential for being a therapeutic target that could 440
improve functional outcomes in mental disorders. Pharmacological interventions that are 441
widely used (e.g mood stabilising antipsychotics) and emotional regulation training (Berking 442
et al., 2008) need more robust trial evidence, but could have a significant impact on distress 443
and outcomes. 444
445
References 478
479
1. Aas, M., Henry, C., Bellivier, F., Lajnef, M., Gard, S., Kahn, J.-P., Lagerberg, T., Aminoff, S., Bjella, T., 480
Leboyer, M., 2016. Affective lability mediates the association between childhood trauma and suicide 481
attempts, mixed episodes and co-morbid anxiety disorders in bipolar disorders. Psychological 482
Medicine, 1-11. 483
484
2. Asherson, P., Chen, W., Craddock, B., Taylor, E., 2007. Adult attention-deficit hyperactivity 485
disorder: recognition and treatment in general adult psychiatry. The British Journal of Psychiatry 486
190, 4-5. 487
488
3. Ben-Zeev, D., Young, M.A., 2010. Accuracy of hospitalized depressed patients' and healthy 489
controls' retrospective symptom reports: an experience sampling study. The Journal of nervous and 490
mental disease 198, 280-285. 491
492
4. Ben-Zeev, D., Young, M.A., Madsen, J.W., 2009. Retrospective recall of affect in clinically 493
depressed individuals and controls. Cognition and Emotion 23, 1021-1040. 494
495
5. Berking, M., Wupperman, P., Reichardt, A., Pejic, T., Dippel, A., Znoj, H., 2008. Emotion-regulation 496
skills as a treatment target in psychotherapy. Behaviour research and therapy 46, 1230-1237. 497
498
6. Bowen, R., Balbuena, L., Baetz, M., Marwaha, S., 2015. Mood instability in people with obsessive 499
compulsive disorder and obsessive-compulsive personality traits. Journal of Obsessive-Compulsive 500
and Related Disorders 6, 108-113. 501
502
7. Broome, M.R., He, Z., Iftikhar, M., Eyden, J., Marwaha, S., 2015a. Neurobiological and behavioural 503
studies of affective instability in clinical populations: a systematic review. Neuroscience & 504
Biobehavioral Reviews 51, 243-254. 505
506
8. Broome, M.R., Saunders, K., Harrison, P., Marwaha, S., 2015b. Mood instability: significance, 507
definition and measurement. The British Journal of Psychiatry 207, 283-285. 508
509
9. Dubad, M., Winsper, C., Meyer, C., Livanou, M., Marwaha, S., 2018. A systematic review of the 510
psychometric properties, usability and clinical impacts of mobile mood-monitoring applications in 511
young people. Psychological medicine 48, 208-228. 512
513
10. Harrison, P.J., Geddes, J.R., Tunbridge, E.M., 2017. The Emerging Neurobiology of Bipolar 514
Disorder. Trends in neurosciences. 515
516
11. Harvey, A.G., 2008. Sleep and circadian rhythms in bipolar disorder: seeking synchrony, harmony, 517
and regulation. American journal of psychiatry 165, 820-829. 518
519
12. Harvey, P.D., Greenberg, B.R., Serper, M.R., 1989. The affective lability scales: development, 520
reliability, and validity. Journal of clinical psychology 45, 786-793. 521
522
13. Henry, C., Mitropoulou, V., New, A.S., Koenigsberg, H.W., Silverman, J., Siever, L.J., 2001a. 523
Affective instability and impulsivity in borderline personality and bipolar II disorders: similarities and 524
differences. Journal of psychiatric research 35, 307-312. 525
14. Henry, C., Mitropoulou, V., New, A.S., Koenigsberg, H.W., Silverman, J., Siever, L.J., 2001b. 527
Affective instability and impulsivity in borderline personality and bipolar II disorders: similarities and 528
differences. Journal of Psychiatric Research 35, 307-312. 529
530
15. Henry, C., Van den Bulke, D., Bellivier, F., Roy, I., Swendsen, J., M'Baïlara, K., Siever, L.J., Leboyer, 531
M., 2008. Affective lability and affect intensity as core dimensions of bipolar disorders during 532
euthymic period. Psychiatry Research 159, 1-6. 533
534
16. Holmes, E.A., Bonsall, M.B., Hales, S.A., Mitchell, H., Renner, F., Blackwell, S.E., Watson, P., 535
Goodwin, G.M., Di Simplicio, M., 2016. Applications of time-series analysis to mood fluctuations in 536
bipolar disorder to promote treatment innovation: a case series. Translational Psychiatry 6, e720. 537
538
17. Howes, O.D., Lim, S., Theologos, G., Yung, A.R., Goodwin, G.M., McGuire, P., 2011. A 539
comprehensive review and model of putative prodromal features of bipolar affective disorder. 540
Psychological Medicine 41, 1567-1577. 541
542
18. Insel, T.R., 2014. The NIMH research domain criteria (RDoC) project: precision medicine for 543
psychiatry. American Journal of Psychiatry 171, 395-397. 544
545
19. Larsen, R.J., Diener, E., Emmons, R.A., 1986a. Affect intensity and reactions to daily life events. 546
Journal of personality and social psychology 51, 803. 547
548
20. Larsen, R.J., Diener, E., Emmons, R.A., 1986b. Affect Intensity And Reactions To Daily Life Events. 549
Journal of Personality and Social Psychology 51, 803-814. 550
551
21. Lieb, K., Völlm, B., Rücker, G., Timmer, A., Stoffers, J.M., 2010. Pharmacotherapy for borderline 552
personality disorder: Cochrane systematic review of randomised trials. British Journal of Psychiatry 553
196, 4-12. 554
555
22. Marwaha, S., Balbuena, L., Winsper, C., Bowen, R., 2015. Mood instability as a precursor to 556
depressive illness: A prospective and mediational analysis. Australian and New Zealand Journal of 557
Psychiatry, 0004867415579920. 558
559
23. Marwaha, S., Broome, M., Bebbington, P., Kuipers, E., Freeman, D., 2013a. Mood instability and 560
Psychosis: findings from British national surveys. Schizophrenia Bulletin. 561
562
24. Marwaha, S., Gordon-Smith, K., Broome, M., Briley, P., Perry, A., Forty, L., Craddock, N., Jones, I., 563
Jones, L., 2016. Affective instability, childhood trauma and major affective disorders. Journal of 564
affective disorders 190, 764-771. 565
566
25. Marwaha, S., He, Z., Broome, M., Singh, S.P., Scott, J., Eyden, J., Wolke, D., 2014. How is affective 567
instability defined and measured? A systematic review. Psychol Med 44, 1793-1808. 568
569
26. Marwaha, S., He, Z., Broome, M. Singh, S.P., Scott, J., Eyden, J., Wolke, D., 2013. How is affective 570
instability defined and measured. A systemtaic review. Psychological medicine. 571
572
27. Marwaha, S., Parsons, N., Flanagan, S., Broome, M., 2013b. The prevalence and clinical 573
associations of mood instability in adults living in England: results from the Adult Psychiatric 574
28. Marwaha, S., Parsons, N., Flanagan, S., Broome, M., 2013c. The prevalence and clinical 576
associations of mood instability in adults living in England: results from the Adult Psychiatric 577
Morbidity Survey 2007. Psychiatry research 205, 262-268. 578
579
29. Moffa, G., Catone, G., Kuipers, J., Kuipers, E., Freeman, D., Marwaha, S., Lennox, B.R., Broome, 580
M.R., Bebbington, P., 2017. Using directed acyclic graphs in epidemiological research in psychosis: an 581
analysis of the role of bullying in psychosis. Schizophrenia bulletin 43, 1273-1279. 582
583
30. Palmier-Claus, J.E., Taylor, P.J., Gooding, P., Dunn, G., Lewis, S.W., 2012. Affective variability 584
predicts suicidal ideation in individuals at ultra-high risk of developing psychosis: An experience 585
sampling study. British Journal of Clinical Psychology 51, 72-83. 586
587
31. Patel, R., Lloyd, T., Jackson, R., Ball, M., Shetty, H., Broadbent, M., Geddes, J.R., Stewart, R., 588
McGuire, P., Taylor, M., 2015. Mood instability is a common feature of mental health disorders and 589
is associated with poor clinical outcomes. BMJ Open 5, e007504. 590
591
32. Reich, D.B., Zanarini, M.C., Fitzmaurice, G., 2012. Affective lability in bipolar disorder and 592
borderline personality disorder. Comprehensive Psychiatry 53, 230-237. 593
594
33. Richard-Lepouriel, H., Etain, B., Hasler, R., Bellivier, F., Gard, S., Kahn, J.-P., Prada, P., Nicastro, R., 595
Ardu, S., Dayer, A., 2016. Similarities between emotional dysregulation in adults suffering from 596
ADHD and bipolar patients. Journal of affective disorders 198, 230-236. 597
598
34. Saunders, K., Bilderbeck, A., Price, J., Goodwin, G., 2015. Distinguishing bipolar disorder from 599
borderline personality disorder: A study of current clinical practice. European Psychiatry 30, 965-600
974. 601
602
35. Stange, J.P., Sylvia, L.G., da Silva Magalhães, P.V., Miklowitz, D.J., Otto, M.W., Frank, E., Yim, C., 603
Berk, M., Dougherty, D.D., Nierenberg, A.A., 2016. Affective instability and the course of bipolar 604
depression: results from the STEP-BD randomised controlled trial of psychosocial treatment. The 605
British Journal of Psychiatry 208, 352-358. 606
607
36. Steyerberg, E.W., 2008. Clinical prediction models: a practical approach to development, 608
validation, and updating. Springer Science & Business Media. 609
610
37. Strejilevich, S., Martino, D., Murru, A., Teitelbaum, J., Fassi, G., Marengo, E., Igoa, A., Colom, F., 611
2013. Mood instability and functional recovery in bipolar disorders. Acta Psychiatrica Scandinavica 612
128, 194-202. 613
614
38. Tsanas, A., Saunders, K., Bilderbeck, A., Palmius, N., Osipov, M., Clifford, G., Goodwin, G., De Vos, 615
M., 2016. Daily longitudinal self-monitoring of mood variability in bipolar disorder and borderline 616
personality disorder. Journal of affective disorders 205, 225-233. 617
618
39. Üstün, T.B., 2010. Measuring health and disability: Manual for WHO disability assessment 619
schedule WHODAS 2.0. World Health Organization. 620
621
40. Williams, K.E., Chambless, D.L., Ahrens, A., 1997. Are emotions frightening? An extension of the 622
fear of fear construct. Behaviour research and therapy 35, 239-248. 623
41. Yen, S., Shea, M.T., Sanislow, C.A., Grilo, C.M., Skodol, A.E., Gunderson, J.G., McGlashan, T.H., 625
Zanarini, M.C., Morey, L.C., 2004. Borderline personality disorder criteria associated with 626
prospectively observed suicidal behavior. The American journal of psychiatry 161, 1296-1298. 627
Table 1: Descriptive statistics by group; case versus control and diagnosis subgroups (n = 94)
Characteristic
Control
(n = 25) (n = 69) Case
Cases by diagnosis
Total (n = 94)
Case versus control Bipolar
(n = 11) Borderline (n = 12) Psychosis (n = 21) Depression (n = 25) P value Test Age (years); mean (SD) 48.5
(10.8)
38.2 (12.8)
35.6
(13.3) 33.9 (11.0) 34.9 (9.8) 44.2 (14.1)
41.0
(13.1) 0.001 t test
Male; n (%) 9 (36.0%) (52.2%) 36 6 (54.5%) 2 (16.7%) (57.1%) 12 16 (64.0%) (47.9%) 45 0.165 Chi square test Employment; n (%):
0.001
Chi Square test (employed vs unemployed, n =
90)
- Employed 19
(76.0%)
26
(37.7%) 5 (45.5%) 4 (33.3%) 6 (28.6%) 11 (44.0%)
45 (47.9%)
- Unemployed 5 (20.0%) 40
(58.0%) 6 (54.5%) 8 (66.7%) (66.7%) 14 12 (48.0%) (47.9%) 45
- Other 1 (4.0%) 3 (4.3%) 0 (0.0%) 0 (0.0%) 1 (4.8%) 2 (8.0%) 4 (4.3%)
Ethnicity; n (%)
0.259
Chi square test
- White British 18
(72.0%) (82.6%) 57 9 (81.8%) 10 (83.3%) (66.7%) 14 24 (96.0%) (79.8%) 75
- Other 7 (28.0%) 12
(17.4%) 2 (18.2%) 2 (16.7%) 7 (33.3%) 1 (4.0%)
19 (20.2%) Education; n (%)
0.061
Chi square test (n = 89)
- None/GCSE 7 (28.0%) 35
(50.7%) 5 (45.5%) 5 (41.7%)
12
(57.1%) 13 (52.0%)
42 (44.7%)
- A level 3 (12.0%) 16
(23.2%) 4(36.4%) 2 (16.7%) 5 (23.8%) 5 (20.0%) (20.2%) 19
- Degree/higher degree 11
(44.0%)
17
(24.6%) 2 (18.2%) 5 (41.7%) 3 (14.3%) 7 (28.0%)
28 (29.8%)
Marital status; n (%)
< 0.001
Chi square test
- Married/cohabiting 20
(80.0%)
22
(31.9%) 1 (9.1%) 6 (50.0%) 5 (23.8%) 10 (40.0%)
42 (44.7%)
- Single/separated/
Table 2: Unadjusted mean scores (with standard deviation) and count (%) for each measurement scale and subscales
Measurement scale
Controls
(n = 25)
Cases (n = 69)
All
(n = 94)
Case versus control (General linear
models, F test) Bipolar
(n = 11) Borderline (n = 12) Psychosis (n = 21) Depression (n = 25)
ACS (scale 1-7) 3.36 (0.56) 4.39 (0.66) 5.14 (0.58) 4.23 (0.86) 4.52 (0.86) 4.21 (0.92) p<0.001
ACS: Anger 3.06 (0.60) 4.31 (0.83) 5.21 (0.96) 4.07 (0.89) 4.08 (1.15) 3.97 (1.11)
ACS: Positive-affect 3.48 (0.63) 4.17 (0.73) 4.12 (1.02) 4.05 (0.89) 3.87 (1.03) 3.88 (0.89)
ACS: Depressed 3.36 (0.75) 4.96 (0.88) 5.92 (0.72) 4.40 (1.01) 5.38 (1.04) 4.64 (1.27)
ACS: Anxiety 3.42 (0.57) 4.31 (0.84) 5.63 (0.60) 4.42 (1.23) 4.93 (0.95) 4.43 (1.13)
ALS-18 (scale 0-3) 0.64 (0.58) 1.47 (0.62) 1.66 (0.49) 1.53 (0.67) 1.50 (0.62) 1.29 (0.71) p<0.0011
ALS-18:
Anxiety/Depression 0.55 (0.65) 1.49 (0.69) 2.23 (0.79) 1.60 (1.01) 1.88 (0.87) 1.46 (1.00)
ALS-18: Depression/Elation 0.86 (0.70) 1.66 (0.57) 1.45 (0.58) 1.65 (0.73) 1.52 (0.53) 1.38 (0.70)
ALS-18: Anger 0.38 (0.48) 1.16 (0.95) 1.42 (0.96) 1.27 (0.88) 1.08 (1.03) 0.99 (0.92)
AIM (scale 1-6) 3.50 (0.48) 3.45 (0.37) 3.37 (0.44) 3.42 (0.56) 3.37 (0.39) 3.42 (0.45) p=0.867
Number of mood fluctuations
reported in the last week P=0.310
0 1-3 4-7 >7
13 (52%) 10 (40%) 2 (8%) 0 (0%)
2 (18.2%) 5 (45.5%) 3 (27.3%) 1 (9.1%)
0 (0%) 3 (25%) 7 (58.3%) 2 (16.7%)
5(23.8%) 4 (19%) 7 (33.3%) 5 (23.8%)
2 (8%) 8 (32%) 7 (28%) 8 (32%)
22 (23.4%) 30 (31.9%) 26 (27.7%) 16 (17.0%)
WHODAS2 (scale 0-4) 0.54 (0.11) 1.43 (0.61) 1.83 (0.69) 1.75 (1.00) 1.89 (0.91) 1.44 (0.96) p<0.001
Table 3: Correlation coefficients between each pair of measurement scales
Full -sample (N=94)
AIM
ALS-18 ACS
Mood fluctuation (last week)
AIM 1 0.210 0.188 0.12
ALS-18 1 0.776 0.61
ACS 1 0.53
Mood fluctuation (last week)
1
Cases only (N=69)
AIM ALS-18 ACS Mood fluctuation (last week)
AIM 1 0.322 0.265 0.157
ALS-18 1 0.666 0.45
ACS 1 0.29
Mood fluctuation (last week)