© 2019, IRJET | Impact Factor value: 7.211 | ISO 9001:2008 Certified Journal | Page 4206
Morphometric Analysis of Venna River Basin Using Geospatial Tool
Indrajeet Mane
1, Abhishek Gharge
2, Mustkim Patel
31,2,3Sahyadri College of Agricultural Engineering, Yeshwantnagar, Karad, Satara (MH)
---***--- ABSTRACT:- The drainage basin is most important fundamental hydrologic and geomorphic areal unit when dealing with thewater resource.Watershed is considered as basic unit in which hydrologic cycle completes. Morphometric analysis of a river basin is essential to identify and assess seasonal changes in drainage basin characteristics, understand the groundwater potential, and address issues related to soil and water conservation.In the present study Venna river basin was considered for morphometric analysis using digital elevation model, toposheet and geospatial tools. Morphometric results are estimated under linear, areal and relief aspect. Results of the analysis reveals that, Venna basin has trunk
stream of 7th order, total streams of all orders were found to be 3906, Bifurcation Ratio (Rb) varies from 2 to 5.12 and
main channel length 58.83 km. Areal aspect of the basin showed that area of the basin is 324 sq.km, drainage density 5.57 km/sq.km, and elongation ratio (Re) 0.41. Relief parameters were revealed that total basin relief (H) of Vena watershed is 824 m, Ruggedness number (Rn) 4.58 and Relief ratio (Rhl) 16.87. From the results it is observed that Venna basin having highly dendric drainage pattern and affected by erosion which is reflected by drainage density and overland flow length. Basin is highly undulating terrain and needs protection to control deterioration of natural resources such as soil and water.
Keywords:Morphometric Analysis, Linear Aspect, Areal aspect, Relief Aspect.
INTRODUCTION
Morphometry analysis is the measurement and mathematical analysis of the configuration of the earth’s surface, shape and dimensions of its landforms. Morphometric analysis, quantitative description and analysis of landforms as practiced in geomorphology that may be applied to a particular kind of landform or to drainage basins, many quantitative measures have been developed to describe valley side and channel slopes, relief, area, drainage network type and extent, and other variables. Attempts to correlate statistically parameters defining drainage basin characteristics and basin hydrology have yield significant results. The morphometric analysis of the drainage basin and channel network play an important role in understanding the geo-hydrological behaviour of drainage basin and expresses the prevailing climate, geology, geomorphology, structural antecedents of the catchment. Morphometric analysis of a drainage basin expresses fully the state of dynamic balance that has been attained due to dealings between matter and energy. It finds out geomorphologic and structural control of flow and runoff and is helpful in predicting floods, their extent and intensity. The study reveals that morphometric analysis based either in GIS environment or otherwise is a competent tool for geo-hydrological studies. These studies are very useful for identifying and planning the groundwater potential zones and watershed management, including the whole gamut of natural resources connected with the watershed.Before developing any watershed we need to find the proper solution to delineate the area.As all the rivers from the world are more or less affected by environment.Before planning any watershed analysis we need to study the basin morphometrology
thoroughly. GIS techniques are now a day used for assessing various terrain and morphometric parameters of the drainage
basins and watersheds, as they provide a flexible environment and a powerful tool for the manipulation and analysis of spatial information. The present paper describes the drainage characteristics of sahyadri area in satara district obtained through ARC GIS based morphometric analysis. It is felt that the study will be useful to understand hydrological behavior of basin.
Study Area
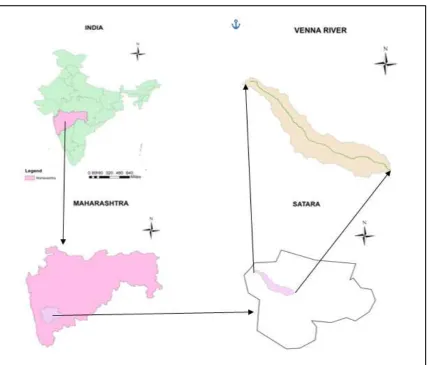
The Venna River rises in Mahabaleshwar(17.9307°N,73.6477E), and is a tributary of theKrishna River in Satara district of western Maharashtra, India. It rises near Mahabaleshwar, a famous hill station in theWestern Ghats. The river meets the Krishna river and this confluence takes place at Sangam Mahuli which is located in eastern part of Satara city. The River Krishna is one of the three largest rivers in southern India.
© 2019, IRJET | Impact Factor value: 7.211 | ISO 9001:2008 Certified Journal | Page 4207
The watershed basin lies at high altitude and stream network flows from northwest to southeast direction.The watershed area mostly consist of laterite soil and also black alluvial soil.Crops cultivated in this area are mainly rice and sugarcane.Figure 1. Location map of study area Data Used and Methodology
ARC GIS 10.3 is used to analyse the basin with input data such as dem.length of stream is based on the break value which was decided with the help of toposheet the different mophometric characteristics are calculated by the method or
formulae developed by different scientists and further used in obtaining all the parameters. Topographical Map: Survey of
India (Nakshe) E43N9, E43N13, E43N14 & E3O2; Aster (DEM) with ˜32m spatial resolution.Remote sensing data : Cartosat-1:DEM-Version-3R1satellite imagery with 3.2m spatial resolution. Period 2005 to 2014.Morphometric Analysis: Quantitative analysis has been done based on SOI toposheets/Cartosat (DEM) & different morphometric characteristics have been generated in GIS environment.
RESULTS
Linear Aspects of the Channel System
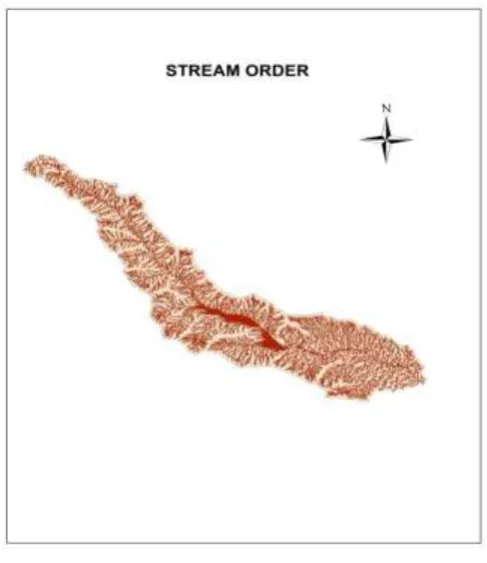
Stream Order (SU):
The stream order (SU) is a dimensionless number, which can be used for comparison of geometry for drainage networks on different linear scales. system has been followed because of its simplicity in the present study.
Stream Number (Nu):
© 2019, IRJET | Impact Factor value: 7.211 | ISO 9001:2008 Certified Journal | Page 4208
Stream Length (Lu):In Venna basin, 1st order streams have the maximum length of 1059.41 km compared to that of other orders.The stream length of various orders is presented in the Table.2
Mean Stream Length (Lum):
Mean Stream length is a dimensional property revealing the characteristic size of components of a drainage network and its contributing watershed surfaces (Strahler, 1964).It is obtained in table no.2.
Table 1: Stream Order, Streams Number, and Bifurcation Ratios in Kanher Watershed
Su Nu Rb Nu-r Rb*Nu-r Rbwm
I 3093
II 603 5.12 3696 18923.52
III 170 3.54 773 2736.42
IV 31 5.48 301 1649.48 4.883
V 6 5.16 36 185.76
VI 2 3 8 24
VII 1 2 3 6
Total 3906 24.3 4817 23525.06
Mean 558 4.05 802.33 3920.84
[image:3.595.177.421.382.664.2]Su: Stream order, Nu: Number of streams, Rb: Bifurcation ratios, Rbm: Mean bifurcation ratio*, Nu-r: Number of stream used in the ratio, Rbwm: Weighted mean bifurcation ratios.
Figure 2. stream order venna
Stream Length Ratio (Lurm):
Horton (1945, p.291) states that the length ratio is the ratio of the mean (Lu) of segments of order (So) to mean length of segments of the next lower order (Lu-1), which tends to be constant throughout the successive orders of a basin.
Bifurcation Ratio (Rb) :
© 2019, IRJET | Impact Factor value: 7.211 | ISO 9001:2008 Certified Journal | Page 4209
Strahler (1957) demonstrated that bifurcation shows a small range of variation for different regions or for different environment except where the powerful geological control dominates. It is observed from the Rb is not same from one order to its next order these irregularities are dependent upon the geological and lithological development of the drainage basin (Strahler 1964). The bifurcation ratio is dimensionless property and generally ranges from 2.0 to 5.12.Weighted Mean Bifurcation Ratio (Rbwm):
[image:4.595.54.545.234.360.2]To arrive at a more representative bifurcation number Strahler (1953) used a weighted mean bifurcation ratio obtained by multiplying the bifurcation ratio for each successive pair of orders by the total numbers of streams involved in the ratio and taking the mean of the sum of these values.
Table 2: Stream Length, and Stream Length Ratio in Table 2: Stream Length, and Stream Length Ratio in Venna Watershed.
Su Lu Lu/Su Lur Lur-r Lur*Lur-r Luwm
I 1059.41 0.34
II 420.46 0.69 2.02 1479.87 2989.33
III 196.64 1.15 1.66 617.10 1024.22
IV 71.73 2.31 2.00 268.37 536.74 1.96
V 19.62 3.27 1.41 91.35 128.80
VI 8.66 4.33 1.32 28.28 37.32
VII 28.50 28.50 6.58 35.16 231.35
Total 1805.02 40.59 14.99 2520.13 4947.76
Mean 257.86 5.71 2.4 420.02 824.62
Su: Stream order, Lu: Stream length, Lur: Stream length ratio, Lurm: Mean stream length ratio*, Lur-r: Stream length used in the ratio, Luwm: Weighted mean stream length ratio
Length of Main Channel (Cl):
This is the length along the longest watercourse from the outflow point of designated sunwatershed to the upper limit to the watershed boundary. Author has computed the main channel length by using ArcGIS-10 software, which is Kms, Table 4.
Channel Index (Ci) & Valley Index (Vi):
The river channel has divided into number of segments as suggested by Muller (1968), and Friend and Sinha (1998) for determination of sinuosity parameter.
Rho Coefficient (ρ):
The Rho coefficient is an important parameter relating drainage density to physiographic development of a watershed which facilitate evaluation of storage capacity of drainage network and hence, a determinant of ultimate degree of drainage development in a given watershed (Horton 1945). The climatic, geologic, biologic, geomorphologic, and anthropogenic factors determine the changes in this parameter. Rho values of theVenna watershed is 0.641.
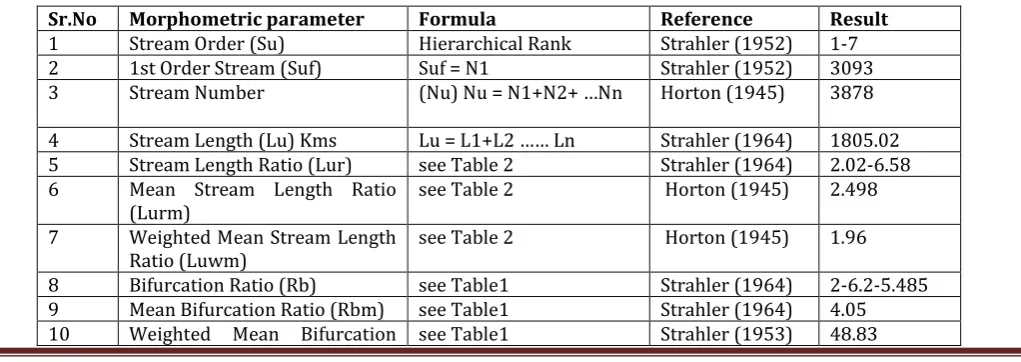
Table 3: Linear Aspects of Venna Basin.
Sr.No Morphometric parameter Formula Reference Result
1 Stream Order (Su) Hierarchical Rank Strahler (1952) 1-7
2 1st Order Stream (Suf) Suf = N1 Strahler (1952) 3093
3 Stream Number (Nu) Nu = N1+N2+ …Nn Horton (1945) 3878
4 Stream Length (Lu) Kms Lu = L1+L2 …… Ln Strahler (1964) 1805.02
5 Stream Length Ratio (Lur) see Table 2 Strahler (1964) 2.02-6.58
6 Mean Stream Length Ratio
(Lurm) see Table 2 Horton (1945) 2.498
7 Weighted Mean Stream Length
Ratio (Luwm) see Table 2 Horton (1945) 1.96
8 Bifurcation Ratio (Rb) see Table1 Strahler (1964) 2-6.2-5.485
9 Mean Bifurcation Ratio (Rbm) see Table1 Strahler (1964) 4.05
[image:4.595.48.559.601.782.2]© 2019, IRJET | Impact Factor value: 7.211 | ISO 9001:2008 Certified Journal | Page 4210
Ratio (Rbwm)11 Main Channel Length (Cl) Kms GIS Software Analysis - 58.83
12 Valley Length (Vl) Kms GIS Software Analysis - 53.63
13 Minimum Aerial Distance
(Adm) Kms GIS Software Analysis - 48.83
14 Channel Index (Ci) Ci = Cl / Adm (H & TS) Miller (1968) 1.20
15 Valley Index (Vi) Vi = Vl / Adm (TS) Miller (1968) 1.09
16 Rho Coefficient (ρ) ρ = Lur / Rb Horton (1945) 0.614
Arial parameters
Length of the Basin (Lb)
Several people defined basin length in different ways, such as Schumm (1956) defined the basin length as the longest dimension of the basin parallel to the principal drainage line. Gregory and Walling (1973) defined the basin length as the longest in the basin in which are end being the mouth.Gardiner (1975) defined the basin length as the length of the line from a basin mouth to a point on the perimeter equidistant from the basin mouth in either direction around the perimeter.
Basin Area (A)
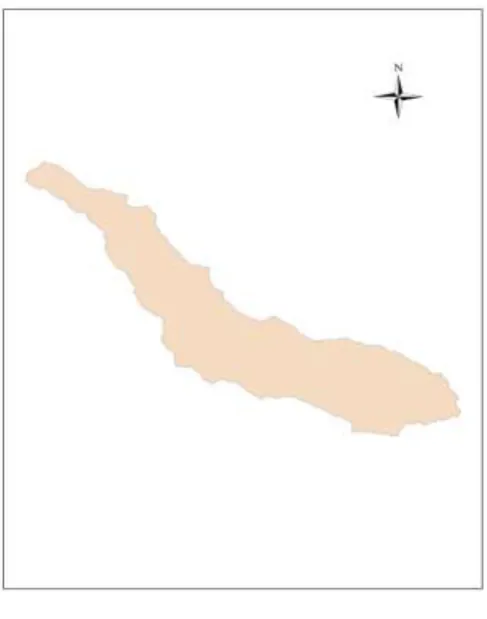
[image:5.595.177.421.354.664.2]The area of the watershed is another important parameter like the length of the stream drainage. Schumm (1956) established an interesting relation between the total watershed areas and the total stream lengths, which are supported by the contributing areas.Area calculated of watershed is 324 sq km.
Figure 3 . Venna watershed Area Basin Perimeter (P)
Basin perimeter is the outer boundary of the watershed that enclosed its area. It is measured along the divides between watershed and may be used as an indicator of watershed size and shape.The perimeter is 128.46 kms.
Length Area Relation (Lar)
© 2019, IRJET | Impact Factor value: 7.211 | ISO 9001:2008 Certified Journal | Page 4211
Lemniscate’s (k) :Chorely (1957), express the lemniscate’s value to determine the slope of the basin. In the formula k = Lb2 / 4 * A.
Form Factor:
According to Horton (1932), form factor may be defined as the ratio of basin area to square of the basin length.
Elongation Ratio (Re)
According to Schumm (1965, p. 612), 'elongation ratio is defined as the ratio of diameter of a circle of the same area as the basin to the maximum basin length. Strahler states that this ratio runs between 0.6 and 1.0 over a wide variety of climatic and geologic types.
Texture Ratio (Rt)
The texture ratio is expressed as the ratio between the first order streams and perimeter of the basin (Rt = Nl / P) and it depends on the underlying lithology, infiltration capacity and relief aspects of the terrain.
Circularity Ratio (Rc)
For the out-line form of watershed (Strahler, 1964, pp 4-51 and Miller, 1953, pp 8) used a dimensionless circularity ratio as a quantitative method. Circularity ratio is defined as the ratio of watershed area to the area of a circle having the same perimeter as the watershed and it is pretentious by the lithological character of the watershed.RC=0.24
Drainage Texture (Dt)
Drainage texture is one of the important concept of geomorphology which means that the relative spacing of drainage lines. Drainage texture is on the underlying lithology, infiltration capacity and relief aspect of the terrain. Dt is total number of stream segments of all orders per perimeter of that area (Horton, 1945).DT=3.18
Compactness Coefficient (Cc)
According to Gravelius (1914), compactness coefficient of a watershed is the ratio of perimeter of watershed to circumference of circular area, which equals the area of the watershed. The Cc is independent of size of watershed and dependent only on the slope.Cc=0.22
Fitness Ratio (Rf)
As per Melton (1957), the ratio of main channel length to the length of the watershed perimeter is fitness ratio, which is a measure of topographic fitness.Rf=0.45
Wandering Ratio (Rw)
According to Smart & Surkan (1967), wandering ratio is defined as the ratio of the mainstream length to the valley length. Valley length is the straight-line distance between outlet of the basin and the farthest point on the ridge.Rw=1.20
Watershed Eccentricity (τ)
Black (1972) has given the expression for watershed eccentricity, which is: τ = [(|Lcm2 - Wcm2|)]0.5 / Wcm
Where: τ = Watershed eccentricity, a dimensionless factor, Lcm = Straight length from the watershed mouth to the centre of mass of the watershed, and Wcm = Width of the watershed at the centre of mass and perpendicular to Lcm.
Centre of Gravity of the Watershed (Gc)
It is the length of the channel measured from the outlet of the watershed to a point on the stream nearest to the center of the watershed.It is computed the centre of gravity of the watershed by using ArcGIS-10 software, which is a point showing the latitude 17.78N, and longitudes 73.86E (Table 4).
Sinuosity Index (Si)
Sinuosity deals with the pattern of channel of a drainage basin. Sinuosity has been defined as the ratio of channel length to down valley distance. In general, its value varies from 1 to 4 or more. Rivers having a sinuosity of 1.5 are called sinuous, and above 1.5 are called meandering (Wolman and Miller, 1964, p. 281).
Stream Frequency (Fs)
© 2019, IRJET | Impact Factor value: 7.211 | ISO 9001:2008 Certified Journal | Page 4212
Drainage Density (Dd)Drainage density is the stream length per unit area in region of watershed (Horton, 1945, p.243 and 1932, p. 357; Strahler, 1952, and 1958; Melton 1958) is another element of drainage analysis.Dd=5.57
constant of Channel Maintenance (1/D)
Schumm (1956) used the inverse of drainage density or the constant of channel maintenance as a property of landforms. The constant indicates the number of Kms2 of basin surface required to develop and sustain a channel 1 Km long.Channel maintenance constant of the watershed is 0.17 Kms2/Km (Table 4 ).I/D=0.17
Infiltration Number (If)
[image:7.595.56.547.283.789.2]The infiltration number of a watershed is defined as the product of drainage density and stream frequency and given an idea about the infiltration characteristics of the watershed.If=66.61
TABLE 4: Areal Aspects of Venna Basin
Sr.No Morphometric parameter Formula Reference Result
1 Length from W’s Center to
Mouth of W’s (Lcm) Kms GIS Software Analysis 22.20
2 Width of W’s at the Center of
Mass (Wcm) Kms GIS Software Analysis Black (1972) 8.33
3 Basin Length (Lb) Kms GIS Software Analysis Black (1972) 48.83
4 Mean Basin Width (Wb) Wb = A / Lb Horton (1932) 6.635
5 Basin Area (A) Sq Kms GIS Software Analysis Schumm(1956) 324
6 Basin Perimeter (P) Kms GIS Software Analysis Schumm(1956 ) 128.46
7 Relative Perimeter (Pr ) Pr = A / P Schumm(1956 ) 2.52
8 Length Area Relation (Lar) Lar = 1.4 * A0.6 Hack (1957) 44.927
9 Lemniscate’s (k ) k = Lb2 / A Chorley (1957) 7.35
10 Form Factor Ratio (Rf) Ff = A / Lb2 Horton (1932) 0.13
11 Shape Factor Ratio (Rs) Sf = Lb2 / A Horton (1956) 7.35
12 Elongation Ratio (Re) Re = 2 / Lb * (A / π) 0.5 Schumm(1956 ) 0.41
13 Elipticity Index (Ie) Ie = π * Vl2 / 4 A 0.28
14 Texture Ratio (Rt) Rt = N1 / P Schumm(1965 ) 24.07
15 Circularity Ratio (Rc) Rc = 12.57 * (A / P2) Miller (1953) 0.24
16 Circularity Ration (Rcn) Rcn = A / P Strahler (1964) 2.52
17 Drainage Texture (Dt) Dt = Nu / P Horton (1945) 3.18
18 Compactness Coefficient (Cc) Cc = 0.2841 * P / A 0.5 Gravelius (1914) 0.22
19 Fitness Ratio (Rf) Rf = Cl / P Melton (1957) 0.45
20 Wandering Ratio (Rw) Rw = Cl / Lb Smart & Surkan
(1967) 1.20
21 Centre of Gravity of the
Watershed (Gc) GIS Software Analysis Rao (1998) 73°86’E &17°78’N
22 Hydraulic Sinuosity Index
© 2019, IRJET | Impact Factor value: 7.211 | ISO 9001:2008 Certified Journal | Page 4213
23 Topographic Sinuosity Index
(Tsi) % Tsi = ((Vi - 1)/(Ci- 1))*100 Mueller (1968) 45
24 Standard Sinuosity Index (Ssi) Ssi = Ci / Vi Mueller (1968) 1.1
25 Longest Dimension Parallel to
the Principal Drainage Line (Clp) Kms
GIS Software Analysis - 51.77
26 Stream Frequency (Fs) Fs = Nu / A Horton (1932) 11.96
27 Drainage Density (Dd) Km /
Kms2 Dd = Lu / A Horton (1932) 5.57
28 Constant of Channel
Maintenance (Kms2 / Km) C = 1 / Dd Schumm(1956) 0.17
29 Drainage Intensity (Di) Di = Fs / Dd Faniran (1968) 2.14
30 Infiltration Number (If) If = Fs * Dd Faniran (1968) 66.61
31 Drainage Pattern (Dp) Horton (1932) Dn & Ra
32 Length of Overland Flow (Lg)
Kms Lg = A / 2 * Lu Horton (1945) 0.08
Drainage Pattern (Dp)
In the watershed, the drainage pattern reflects the influence of slope, lithology and structure. Finally, the study of drainage pattern helps in identifying the stage in the cycle of erosion. Drainage pattern presents some characteristics of drainage basins through drainage pattern and drainage texture. It is possible to deduce the geology of the basin, the strike and dip of depositional rocks, existence of faults and other information about geological structure from drainage patterns. Drainage texture reflects climate, permeability of rocks, vegetation, and relief ratio, etc. Howard (1967) related drainage patterns to geological information. Author has identified the dendritic and radial pattern in the study area. Dendritic pattern is most common pattern is formed in a drainage basin composed of fairly homogeneous rock without control by the underlying geologic structure. The longer the time of formation of a drainage basin is, the more easily the dendritic pattern is formed.
Length of Overland Flow (Lg)
Horton (1945) used this term to refer to the length of the run of the rainwater on the ground surface before it is localized into definite channels. Since this length of overland flow, at an average, is about half the distance between the stream channels, Horton, for the sake of convenience, had taken it to be roughly equal to half the reciprocal of the drainage density,Lg=0.08
Relief Aspects Relief Ratio (Rhl)
Difference in the elevation between the highest point of a watershed and the lowest point on the valley floor is known as the total relief of the river basin. The relief ratio may be defined as the ratio between the total relief of a basin and the longest dimension of the basin parallel to the main drainage line.Relief Ratioof watershed is 16.87.(Schumm, 1956).
Relative Relief
The maximum basin relief was obtained from the highest point on the watershed perimeter to the mouth of the stream. Using the basin relief (174 m), a relief ratio was computed as suggested by Schumm (1956), which is 0.006. Melton’s (1957) relative relief was also calculated using the formula: Rhp = (H*100) / P, where P is perimeter in metres.
Absolute Relief (Ra)
The difference in elevation between a given location and sea level. Ra=830
Channel Gradient (Cg)
© 2019, IRJET | Impact Factor value: 7.211 | ISO 9001:2008 Certified Journal | Page 4214
Figure 4. Elevation of Venna River WatershedRuggedness Number (Rn)
Strahler’s (1968) ruggedness number is the product of the basin relief and the drainage density and usefully combines slope steepness with its length. Calculated accordingly, the Venna watershed has a ruggedness number of 4.58, Table 5.Rn=4.58
Melton Ruggedness Number (MRn)
The MRn is a slope index that provides specialized representation of relief ruggedness within the watershed (Melton 1965).MRn=5.08
Dissection Index (Dis)
Dissection index is a parameter implying the degree of dissection or vertical erosion and expounds the stages of terrain or landscape development in any given physiographic region or watershed (Singh and Dubey 1994). On average, the values of Dis vary between‘0’ (complete absence of vertical dissection/erosion and hence dominance of flat surface) and‘1’ (in exceptional cases, vertical cliffs, it may be at vertical escarpment of hill slope or at seashore).Dis=1.28
Gradient Ratio (Rg)
Gradient ratio is an indicator of channel slope, which enables assessment of the runoff volume (Sreedevi, 2004).Rg=16.87
Gradient & Channel Slope (Sgc)
Gradient in the steepness of a slope, expressed as a proportion between its vertical intervals (Vei) reduced to unity, and its horizontal equivalent (Hoe). Gradient was computed as Sgc = Vei / Hoe.
Slope Analysis (Sa)
© 2019, IRJET | Impact Factor value: 7.211 | ISO 9001:2008 Certified Journal | Page 4215
Average Slope of the Watershed (S)According to Wenthworth’s (1930), Erodibility of a watershed can be studied and can be compared from its average slope. More the percentage of slopes more are its erosion, if all other things are kept constant. The average slope of the watershed is determined as, S = (Z * (Ctl / H)) / (10 * A).
Mean Slope of Overall Basin (Ѳs)
[image:10.595.60.537.233.372.2]Mean slope of overall basin was computed after (Chorley, 1979), but slightly modified as Ѳs = ∑Ctl * Cin / A. Where Ѳs = Mean slope of overall basin, Ctl = Total length of contour in the watershed, Cin = Contour interval, and A = Area of the watershed. Mean slope of Vennawatershed is 0.21, Table 4.
TABLE:- 5 Hypsometric Data of Hypsometric Integrals.
Sr.No. Altitude
Range(m) Height(m)h Area(kms
2)a h/H1 a/A2
1 >1300 765 1.39 1 0.004
2 1200-1300 665 15.29 0.869 0.0471
3 1100-1200 565 15.35 0.738 0.0473
4 1000-1100 465 21.72 0.607 0.067
5 900-1000 365 23.43 0.477 0.072
6 800-900 265 27.15 0.346 0.083
7 700-800 165 43.83 0.215 0.135
8 600-700 65 175.16 0.089 0.540
9 535 0 324 0.000 1
Comparison of Drainage Basin Characteristics
The details of the morphometric analysis and comparison of drainage basin characteristics of Karawan watershed are present in Table 4.
Table 6: Relief Aspects of Venna Basin.
Sr.No Morphometric parameter Formula Reference Result
1 Height of Basin Mouth (z) m GIS Analysis / DEM - 541
2 Maximum Height of the Basin (Z) m GIS Analysis / DEM - 365
3 Total Basin Relief (H) m H = Z - z Strahler (1952) 824
4 Relief Ratio (Rhl) Rhl = H / Lb Schumm(1956 ) 16.87
5 Absolute Relief (Ra) m GIS Software Analysis 830
6 Relative Relief Ratio (Rhp) Rhp = H * 100 / P Melton (1957) 641.44
7 Dissection Index (Dis) Dis = H / Ra Singh & Dubey
(1994) 1.28
8 Channel Gradient (Cg) m / Kms Cg = H / {(π/2) * Clp} Broscoe (1959) 10.13
9 Gradient Ratio (Rg) Rg = (Z - z) / Lb Sreedevi (2004) 16.87
10 Watershed Slope (Sw) Sw = H / Lb 16.87
11 Ruggedness Number (Rn) Rn = Dd * (H / 1000) Patton & Baker
(1976) 4.58
12 Melton Ruggedness Number (MRn) MRn = H / A0.5 Melton (1965) 5.08
13 Total Contour Length (Ctl) Kms GIS Software Analysis - 7075.68
14 Contour Interval (Cin) m GIS Software Analysis 10
15 Slope Analysis (Sa) GIS Analysis / DEM Rich (1916) 0.036
16 Average Slope (S) % S = (Z * (Ctl/H)) / (10 * A) Wenthworth’s
(1930) 3.61
17 Mean Slope of Overall Basin (Ѳs) Ѳs = (Ctl * Cin) /A Chorley (1979) 0.21
18 Relative Height (h/H) see Table 4 (h/H ) Strahler (1952) 1-0
[image:10.595.50.554.455.788.2]© 2019, IRJET | Impact Factor value: 7.211 | ISO 9001:2008 Certified Journal | Page 4216
20 Surface Area of Relief (Rsa) Sq Kms Composite Profile Brown (1952) 324
21 Composite Profile Area (Acp) Sq
Kms Area Composite between Curve and the
Horizontal Line
Pareta (2004) 324
CONCLUSION:
The present study has demonstrated that GIS is a valuable tool for analysis of various morphometric parameters. The morphometric parameters evolved here will be of immense utility in river basin evaluation, flood management, watershed prioritization for soil and water conservation, and natural resources management at micro level.
Acknowledgement
We are thankful to JD INFOTECH, Aurangabad, Maharashtra for providing Technical Assistance during INPLANT Training program. We also extend our gratitude to Sir Choturam college of Agril. Engg. And Tech. Lodga, Latur, Maharashtra for providing opportunity to prepare this research work. We are also thankful to Dr. S. H. Jedhe and Mr. Swapnil Ullewad sir for the motivation of this work.
REFERENCES
1. Abboud I A and Nofal R A 2017 J. African Earth Sci. 126 58-74
2. Alexander, P.O (1979), "Age and Duration of Deccan Volcanism: K. Ar. Evidence", Deccan Volcanism Geological Society of India, Memoir No. 3, Bangalore, pp 244257.
3. Broscoe, A.J (1959), “Quantitative Analysis of Longitudinal Stream Profiles of Small Watersheds”, Project N.
389-042, Tech. Bep. 18, Geology Department, Columbian University, ONR, Geography Branch, New York.
4. Calef, W. C (1950), “Form and Process, Cambridge University Press”, London, pp 473.
5. Chandrashekar H, Lokesh K V, Sameena M, Roopa J and Ranganna G 2015 Proc. Int. Conf. on Water Resources,
Coastal and Ocean Engineering (Mangalore) vol 4 ed G S Dwarakish(Elsevier Procedia) 1345 – 1353
6. Chorley, R.J (1972), “Spatial Analysis in Geomorphology”, Mathuen and Co. Ltd., London.
7. Chorley, R.L (1967), “Models in Geomorphology”, in R.J. Chorley and P. Haggett (eds.), Models in Geography, London, pp 59-96.
8. Dury, G.H (1952), “Methods of Cartographical Analysis in Geomorphological Research”, Silver Jubilee Volume,
Indian Geographical Society, Madras, pp 136-139.
9. Faniran, A (1968), “The Index of Drainage Intensity - A Provisional New Drainage Factor”, Australian Journal of
Science, 31, pp 328-330.
10. Gold, D. P (1980), “Structural Geology”, Chapter 14 in Remote Sensing in Geology, edit by Siegal, B. S. and Gillespie,
A. R., John Wiley, New York, pp 410-483.
11. Gregory, K.J. & Walling, D.E (1968), “The Variation of Drainage Density within a Catchment”, International Association of Scientific Hydrology - Bulletin, 13, pp 6168.
12. Horton, R.E (1932), “Drainage Basin Characteristics”, Transactions, American Geophysical Union, 13, pp 350-61.
13. Horton, R.E (1945), “Erosional Development of Streams and their Drainage Basins”, Bulletin of the Geological Society of America, 56, pp-275-370.
14. King, C.A.M (1966), “Techniques in Geomorphology”, Edward Arnold, (Publishers) Ltd. London, pp 319-321.
15. Pareta, K (2003), “Morphometric Analysis of Dhasan River Basin, India”, Uttar Bharat Bhoogol Patrika, Gorakhpur,
39, pp 15-35.
16. Pareta, K (2005), “Rainfall-Runoff Modelling, Soil Erosion Modelling, Water Balance Calculation, and
Morphometric Analysis of Molali Watershed, Sagar, Madhya Pradesh using GIS and Remote Sensing Techniques”, Proceeding in 25th International Cartographic Congress, INCA.
17. Pareta, K (2011), “Geo-Environmental and Geo-Hydrological Study of Rajghat Dam, Sagar (Madhya Pradesh) using
Remote Sensing Techniques”, International Journal of Scientific & Engineering Research, 2(8) (ISSN 2229-5518), pp 1-8.
18. Pareta, K. and Koshta, Upasana (2009), “Soil Erosion Modeling using Remote Sensing and GIS: A Case Study of Mohand Watershed, Haridwar”, Madhya Bharti Journal, Dr. Hari Singh Gour University, Sagar (M.P.), 55, pp 23-33.
19. Rai P K, Mishra V N and Mohan K 2017 Remote Sens. Appl. Soc. Environ.7 9-20
20. Richards, K.S. Arnett, R.R. and Ellis, J (1985), “Geomorphology and Soils”, George Allen and Unwin, London, pp 441.
21. Scheidegger, A.E (1965), “The Algebra of Stream Order Number”, U.S. Geological Survey Professional Paper, 525B,
© 2019, IRJET | Impact Factor value: 7.211 | ISO 9001:2008 Certified Journal | Page 4217
22. Schumm, S.A (1954), “The relation of Drainage Basin Relief to Sediment Loss”, International Association ofScientific Hydrology, 36, pp 216-219.
23. Schumm, S.A (1956), “Evolution of Drainage Systems & Slopes in Badlands at Perth Anboy, New Jersey”, Bulletin of
the Geological Society of America, 67, pp 597-646.
24. Schumm, S.A (1963), “Sinuosity of Alluvial Rivers on the Great Plains”, Bulletin of the Geological Society of America, 74, pp 1089-1100.
25. Shreve, R.L (1966), “Statistical Law of Stream Numbers”, Journal of Geology, 74, pp 17-37.
26. Smith, G.H (1939), “The Morphometry of Ohio: The Average Slope of the Land (abstract)”, Annals of the
Association of American Geographers, 29, pp 94.
27. Strahler, A.N (1952), “Hypsometric Analysis of Erosional Topography”, Bulletin of the Geological Society of America, 63, pp 1117-42.
28. Strahler, A.N (1956), “Quantitative Slope Analysis”, Bulletin of the Geological Society of America, 67, pp 571-596.
29. Strahler, A.N (1964), “Quantitative Geomorphology of Drainage Basin and Channel Network”, Handbook of
Applied Hydrology, pp 39-76.
30. Thornbury, W.D (1954), “Principles of Geomorphology”, John Wiley and Sons, London.
31. Vittala S S, Govindaiah S and Gowda H H 2004 J Indian Soc Remote 32 351-362
32. Wentworth, C.K (1930), “A Simplified Method of Determining the Average Slope of Land Surfaces”, American
Journal of Science, 21, pp 184-194.
33. West, W.D. and Choubey, V.D (1964), "The Geomorphology of the Country around Sagar and Katangi (M.P.)", Journal of Geological Society of India, 5, pp 41-55.
34. Woldenberg, N.J (1967), “Geography & Properties of Surface”, Handward Paper in Theoretical Geography, 1 pp
95-189.
35. Yangchan J, Jain A K, Tiwari A K and Sood A 2015 IJSER 6 1015-1023
36. Young, A (1972), "Slope", Oliver & Boyd, Edinburgh, pp 5.