Multiscale modelling of drug-polymer nanoparticle assembly identifies
parameters influencing drug encapsulation efficiency
R. Mackenziea, J. Boothb, C. Alexanderc, M. C. Garnettc, C.A. Laughton*a
aDivision of Medicinal Chemistry & Structural Biology, School of Pharmacy, University of Nottingham, UK
bPharmaceutical Development, AstraZeneca, UK
cDivision of Drug Delivery & Tissue Engineering, School of Pharmacy, University of Nottingham, UK
* Author for correspondence: Tel: +441159513405 Fax: +441159513412 !
Email addresses:
Robert Mackenzie:[email protected] Jonathan Booth:[email protected]
Cameron Alexander:[email protected] Martin Garnett:[email protected]
Charles Laughton: [email protected]
ABSTRACT
Using a multiscale (dual resolution) approach combining an atomistic (GROMOS96) and coarse-grain (MARTINI) force field, we have been able to simulate the process of drug-polymer nanoparticle assembly by nanoprecipitation from mixed solvents. Here we present the development and application of this method to the interaction of three poly(glycerol adipate) polymer variants with the anti-cancer drug dexamethasone phosphate. Differences in encapsulation efficiency and drug loading between the polymers are in agreement with the experimental trend. Reference atomistic simulations at key points along the predicted aggregation pathway support the accuracy of the much more compute-efficient multiscale methodology.
INTRODUCTION
There is an increasing interest in nanomedicines due to the way that nanoparticles are handled physiologically within the body. Compared to conventional formulations, nanoparticles provide opportunities to exploit different barriers and uptake mechanisms to treat difficult diseases such as cancer1 and parasitic infections2. Research and
development related to drug delivery technology is therefore becoming increasingly important for the pharmaceutical industry. Methodologies for encapsulation of drugs into micro and nanoparticles for use as drug delivery systems has been under development for at least two decades. A variety of different types of materials are used for drug encapsulation but mainly divide into lipid based technologies such as liposomes or solid lipid nanoparticles, and polymer based methodologies3. There are examples of liposome
based nanoparticles which have been in clinical use for several years. But while drug encapsulation within polymeric nanoparticles has been achieved for a variety of polymers and small molecule drugs4–10, it is only recently that the first polymer based nanoparticle became clinically available3. This is important because the mechanisms of
drug incorporation for the former are relatively easy to appreciate, but there is not a clearly understood mechanism for drug incorporation in the latter. It is these polymer based technologies which are of interest in this paper.
There are a number of established methods for production of nanoparticles and incorporation of drugs11. Some of these processes have been investigated and analysed
from a physicochemical viewpoint12 but these have not been modelled at a detailed
level. Many of the nanoparticles produced have poor incorporation of drug and rapid drug release rates, where most delivery applications require high drug incorporation and slow release rates. Currently, improvements in encapsulation are dependent largely on trial and error to improve methodology and to introduce materials and excipients with different properties which may be beneficial for nanoparticle performance. Part of the problem with polymer nanoparticles is that we need to use processes which will both create the nanoparticle and simultaneously facilitate the incorporation of drug into that nanoparticle. The mechanisms of both of these aspects are poorly understood at a molecular level.
Molecular simulation methods have the potential to provide insight into the fundamental processes at the atomic level that govern the emergent properties of a complex system at the macroscopic scale. However, until recently the computational expense of applying such techniques to the study of drug-polymer interactions has limited its application13,14. Samanta et al. have analysed the interactions of a single drug molecule with a few polymer chains15 and Ahmad et al. have simulated 20 drug molecules with 8 polymer
chains in a single solvent16. Other papers have taken a mesoscale approach to
modelling the polymers using dissipative particle dynamics17,18. This allows simulation of
larger structures such as polymersomes19 but as these methods do not deal with the
limit the metrics that can be extracted from such simulations for comparison with experimental observables, such as spectroscopic properties.
In the light of ever-increasing computational power, and new developments in simulation methods, it is timely to tackle this problem. We have chosen one particular drug-polymer assembly process, namely nanoprecipitation, which is widely used for nanoparticle preparation8. In this method droplets of a water-insoluble polymer in a water-miscible
organic solvent were added to a large excess of water. Drug can either be present in the organic polymer solution, or the aqueous receiving solution, depending on the drug properties. We have previously published work where the drug dexamethasone phosphate (DXMP) has been encapsulated into polymers based on poly(glycerol adipate) (PGA). PGA is synthesised using an enzymic method to produce a functionalised biodegradable polymer bearing pendant hydroxyl groups9. PGA may be flexibly modified by functionalization of some or all of its free hydroxyl groups to produce polymers with different physicochemical properties7,9. We have demonstrated that drug loading of DXMP into PGA is affected by polymer molecular weight and functionalization by acylation (both acyl chain length and percentage acylation). A partial functionalization by stearate (C18) was most effective for drug loading. The physicochemical rationalisation for these data is not obvious. While steroids such as cholesterol are known to intercalate with acyl lipid chains in biological membranes, the details of why and how a relatively polar steroid drug is encapsulated efficiently into a very hydrophobic polymer by the nanoprecipitation method are not obvious.
Conceptually, nanoprecipitation involves a number of processes that will be somewhat interdependent in a complex way. Firstly there is the solvent diffusion process, whereby the water-miscible organic solvent disperses into bulk water, and water enters into the volume of the original droplet. This change in the solvent environment of the (hydrophobic) polymer triggers other processes; such as change in the polymer chains from an extended to a compacted conformation, intramolecular collapse, intramolecular aggregation and polymer chain entanglement. At the same time the drug molecules will be diffusing into the region around the polymer in response to a concentration gradient, modulated by their affinity for the various species present.
Nanoprecipitation has been modelled previously, by Spaeth et al. using a single solvent type whose interaction parameters with the solutes were changed during the simulation to recreate the dispersion of acetone20. Some preliminary simulations we performed
detailed insights into some of the factors, at the atomic scale, that influence encapsulation efficiency.
METHODS
Polymer designations
The unmodified polymer is designated simply PGA100. Acylation of the pendant hydroxyl group with stearyl moieties is designated by C18PGA with a subscript to denote the percentage of monomers modified.
Multiscale Model
Our aim has been to model the time evolution of a system that begins as a spherical drop of a PGA polymer solution in acetone within a large box of water containing DXMP. To mimic the previously reported experimental conditions7,9 we calculated that a suitable
fully atomistic model that contained all the relevant species would consist of a 12nm diameter droplet containing 16,000 molecules of acetone and two molecules of a PGA100 30mer (or one molecule of PGA20-co-C18PGA80 or C18PGA100 30mer) at the centre of a
60 nm3 box of c. 7 million molecules of water and 1270 molecules of DXMP. In total this
would consist of over 21 million atoms. Such a system would be at the limits of what is practical to simulate on even Tier0 computational resources and yet would only contain a single molecule of C18PGA100 polymer. To include more polymer molecules we would need a larger droplet of the organic solvent and a larger box of water to surround it.
To address these issues we have taken advantage of the facility in the MD code GROMACS21 to use multiscale, dual-resolution, modelling methods. Water and acetone
have been modelled as purely coarse-grained entities, using the MARTINI model and parameters22 . PGA and DXMP were modelled at both atomistic and coarse-grained levels, using the virtual sites approach23,24. Thus in our simulations all solute-solute interactions are treated fully atomistically, but solute-solvent and solvent-solvent interactions are treated using a coarse-grain force approach. While the modelled concentration of the drug in water is comparable to experiment at 3.22mg/ml, we have decreased the amount of acetone present in the system whilst increasing the polymer concentration to about four times the experimental value. This allowed us to observe how multiple polymer chains interact together to form a nanoparticle on a reasonable time scale (around 5 days on 192 cores). Increased concentrations were also used in similar work by Spaeth et al.20 Overall, we have thus been able to reduce the number of
particles in the simulation system to 1,054,063 for two PGA20-co-C18PGA80 chains and
1,053,653 for three PGA100 chains with 500 molecules of DXMP.
Atomistic models, compatible with the GROMOS96 53a625 force field, for PGA, C18PGA and DXMP were generated using the automated topology builder (ATB)26. PGA
100 consists of 30 PGA monomers and PGA20-co-C18PGA80 consists of 4 PGA monomers
For the MARTINI force field22 the polymer has been modelled with 4 coarse grain (CG) sites per monomer. DXMP is modelled as 9 CG sites, because ring structures require a 3 to 1 or lower mapping The CG beads were mapped on to the atomistic coordinates using VOTCA27 and converted to virtual sites.
As per the standard MARTINI approach, four water molecules are represented by a single water bead and a single acetone molecule is represented by a single acetone bead. Details of the mapping and all non-standard parameters for the simulations are reported in the supplementary material.
Simulation Parameters
GROMACS version 4.6 was used for all production molecular dynamics. Simulations used periodic boundary conditions with Coulomb and van der Waals interactions shifted between 0 and the 1.2nm cut-off. The Berendsen barostat and v-rescale thermostat were used to equilibrate the system to 1 bar, 300K before a constant volume production run. Bonds were constrained using the LINCS algorithm to allow for a 2fs time step. Simulations were run for 80 ns with coordinates saved every 100ps. All simulations were repeated three times, starting from different, randomised, initial velocity distributions.
Resolution Transformation
As part of the simulation validation procedure (discussed below), at various points 11nm3 sub-sections of the 50nm3 multiscale systems were converted back to fully atomistic representations. We used the backward python script28 to reintroduce atomistic detail to
our coarse-grain solvent. Atomistic molecules (one for acetone and four for water) are placed in position of coarse-grain beads and subjected to energy minimisation and iterative molecular dynamics simulations with increasing time step up to 2fs. The original polymer, drug molecules with counter ions were reintroduced to the simulation box without their coarse-grain virtual sites to create a fully atomistic subsystem.
Comparative analysis of multiscale and atomistic simulations
Fully atomistic MD on these subsystems was run for 5 ns using the GROMOS96 53a6 force field. A 2fs time step was used with all bonds constrained. Temperature and pressure were kept constant at 300K and 1 bar with the v-rescale thermostat and Berendsen barostat respectively. The particle mesh Ewald method was used for Coulomb interactions with a 1.2nm cut-off and van der Waals interactions were cut-off at 1.2nm. For comparison, each 11nm3 sub-section was also simulated for 5 ns using the
multiscale force field.
The performance of the multiscale simulation vis-a-vie the atomistic “gold standard” MD, was analysed with regard to two key parameters. Firstly the time evolution of the total radius of gyration of the polymer clusters in the two simulations was compared using
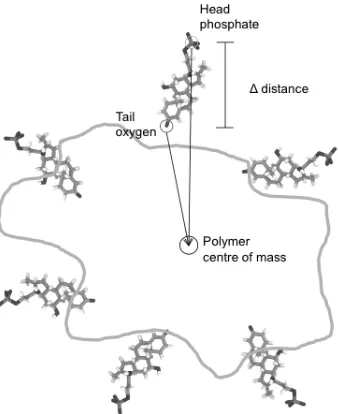
Secondly the average orientation of the absorbed DXMP molecules with respect to the polymer nanoparticle was evaluated. For this we measured the difference in the distance of the phosphate and O3 oxygen atoms of DXMP from the polymer cluster centre of mass over the course of the simulation using g_dist (Figure 1). This was repeated for five different (randomly-selected by number) drug molecules and averaged. In addition the radial distribution of all DXMP molecules from the centre of mass of the polymer nanoparticle was calculated over the last 30ns of the simulation using g_rdf.
Figure 1 Calculation of the orientational metric (Δ distance).
Calculation of drug loading and encapsulation efficiency
Experimentally polymer-based drug delivery systems are analysed for their ability to encapsulate drug molecules. There are a variety of experimental techniques used to discern the amount of drug that is encapsulated. For our simulations we have the luxury of being able to see exactly how many drug molecules make contact with the polymer nanoparticle when it has formed.
To alleviate this problem the DL is also calculated. DL is an indication of the total capacity for a polymer nanoparticle to encapsulate drug molecules. Ideally this value should be as large as possible to get the optimal delivery of drug from the polymer nanoparticle. However, DL is often very low for polymer-based drug delivery systems. EE for a polymer could be 100% yet the DL may still be low depending on the amount of drug present in solution at the start. In our simulations, a drug was considered bound to the nanoparticle if it made contact with it.
!"#$%&'($)*+"!
!""#$#%&$'
=
!
!"##!"#$%!!"##!!"!!"#$!!"!!"!!"!#$"%&'()*!!"#$!!"#$!!
!
!
!
(1.1)
!"#$
!!"#$%&'
=
!
!"##!"#$%!!"##!!"!!"!!"#$!!"!!"!#$"%&'()*!!"!#$"%&'()*!!!!
!
!!
!
!
!
!!
!
!!!!!
(1.2)
RESULTS and DISCUSSION
Optimisation/Calibration of the Multiscale model
The relative dielectric constant (εr) must be carefully chosen for any multiscale
simulation. The εr specifies the strength of electrostatic interactions between molecules
in the system, with high values of εr resulting in increased dampening of Coulombic
forces. The MARTINI force field is designed to use εr = 15; however, the GROMOS96
53a6 atomistic force field is calibrated to a value of 1. This results in difficult calibration for the multiscale model, which uses both force fields but must select one value of εr for
the whole simulation. After extensive test runs we found that, with careful adjustment of the non-bonded CG virtual site interactions with the solvent molecules, excellent agreement between multiscale and reference atomistic simulations could be achieved using εr = 6 for the former. The effect of εr on simulation behaviour is discussed in more
detail below.
The MARTINI force field claims a 3-8 effective speed up over atomistic simulations22,
mainly due to the loss of effective friction when using CG beads. To ensure that the rate of acetone dispersion, and subsequently the rate of polymer nanoprecipitation, was correct in the multiscale simulations, we carried out test MD simulations. Atomistic and coarse-grained models on mixed acetone/water systems showed that default MARTINI parameters underestimate the acetone diffusion coefficient (1.367x10⁻⁵ cm2/s by the
Einstein relation, compared to 2.113 x10⁻⁵ cm2/s for the atomistic simulation). This
Simulation of PGA100 nanoprecipitation in the presence of DXMP
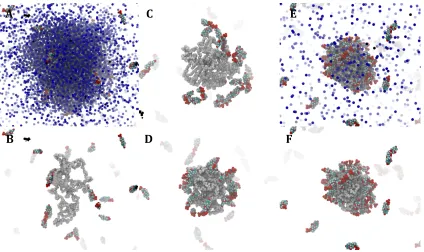
Figure 2 Snapshots taken during the 80 ns multiscale simulation of PGA100 with DXMP. A: 5 ns (with
acetone shown), B: 5 ns, C: 30 ns, D: 50 ns, E: 80 ns (with acetone shown), F: 80 ns. DXMP (multi), PGA (white), acetone (blue). For clarity water and coarse-grain virtual sites not shown.
Using the simulation set-up in the Methods section (a droplet of a polymer in acetone solution within a box of an aqueous solution of DXMP), we first explored the nanoprecipitation of the parent, un-substituted, PGA100 over an 80 ns multiscale simulation. The polymer molecules in the acetone drop at the beginning of the simulation are initially well dispersed and in chain-extended conformations (Figure 3B). As the acetone disperses into the surrounding water, the relatively hydrophobic polymer chains move towards the centre of the shrinking droplet. Because the rate of diffusion of the polymer chains is slower than that of the solvents, they experience an increasingly polar environment and polymer-polymer interactions become more prominent. This produces both intramolecular collapse of individual polymer chains and stronger, more entangled, intermolecular interactions. DXMP binds to the polymer at the surface of the acetone drop as PGA100 is exposed in these regions to the surrounding water. Eventually enough acetone disperses to cause full aggregation of the polymer chains; at this point a proportion of DXMP molecules become encapsulated in the nascent nanoparticle (Figure 2D-F).
Many of the features of this simulation are critically dependent on the nature and kinetics of the solvent exchange and dispersion process. It was originally assumed that acetone-water equilibration of the droplet happens instantaneously, compared with polymer-polymer dynamics preventing the need to simulate acetone dispersion. However, in preliminary simulations beginning with dispersed and extended polymer chains in pure water, polymer chains tended to undergo intramolecular collapse much more rapidly
A
B
C
D
F
than intermolecular aggregation, producing a very different form of granular material (results not shown). Simulations using a single solvent type whose characteristics were ‘morphed’ with properties ranging from pure acetone to pure water over the course of the simulation, in a manner similar to Spaeth at al21, also produced much less entangled
structures, because there is no retreating acetone/water interface to drive association (results not shown).
[image:9.612.90.515.190.443.2]Simulation of PGA20-co-C18PGA80nanoprecipitation in the presence of DXMP
Figure 3 Snapshots taken during the 80 ns multiscale simulation of PGA20-co-C18PGA80 with DXMP. A: 5 ns (with acetone shown), B: 5 ns, C: 30 ns, D: 50 ns, E: 80 ns (with acetone shown), F: 80 ns. DXMP (multi), PGA (white with C18 chains yellow), acetone (blue). For clarity water and coarse-grain virtual sites not shown.
The aggregation of the PGA20-co-C18PGA80 polymer chains is subtlety different to that
of the parent, un-functionalised PGA. The more hydrophobic carbon chains are sparingly soluble in acetone and are free to extend away from the polymer (Figure 3C). Towards the end of the simulation the polymer chains become more exposed to the water rich environment resulting in the carbon chains becoming buried in the emerging nanoparticle (Figure 3D-F). However due to the degree of side-chain functionalisation of this polymer there is insufficient PGA backbone to fully shield the hydrophobic C18 chains from the surrounding water. This leaves hydrophobic chains exposed to interact with DXMP molecules at the surface (Figure 3F).
Similarly to the PGA100 simulation, DXMP molecules that diffuse into the nascent
nanoparticle bury their more hydrophobic groups in the C18/acetone phase keeping the hydrophilic phosphate group in the polar PGA backbone/aqueous phase (Figure 3).
A
B
C
D
F
In practical formulation experiments, DXMP-loaded nanoparticles were found to display a 20% larger zeta potential than non-loaded polymer nanoparticles5. This finding is one indication that the simulation is consistent with wet-lab data and suggests the orientational preference of DXMP seen in these simulations – i.e. with the exposed phosphate groups at the surface of the nanoparticles, is a plausible explanation for the observed negative zeta potential in the experimental nanoparticles.
Model Validation
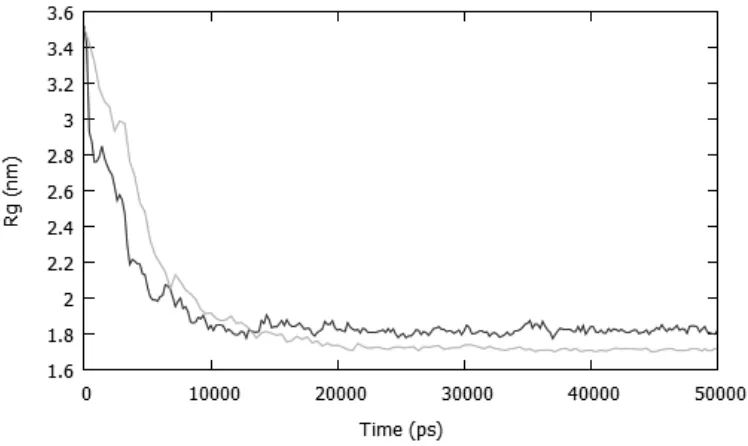
To assess the accuracy of our multiscale simulations a single fully atomistic simulation of the nanoprecipitation of the polymer was run and the aggregation of the polymer chains compared with the behaviour observed using the multiscale force field (Figure 4). In general the agreement is excellent, though the Rg decreases slightly faster using our
multiscale force field and in addition the final nanoparticle is denser using the fully atomistic (GROMOS96) force field. This appears to be due to CG acetone lubricating polymer chains in the multiscale nanoparticle and so decreasing the particle’s density.
[image:10.612.94.468.311.534.2]!
Figure 4 The total radius of gyration for a two polymer cluster over a 50 ns nanoprecipitation simulation performed using a fully atomistic (light grey), or multiscale (dark grey) force field.
To repeat all simulations at the fully atomistic level was computationally too costly, therefore to further compare these force fields, snapshots of manageable but representative sub-sections of the whole simulation system, centred on the nascent nanoparticle, were extracted at three time points (30, 50, and 80 ns) from each multiscale simulation). We then used a procedure originally developed for multiscale biomolecular systems28 to re-introduce atomistic detail for the solvent molecules (see
multiscale parameterisation. As discussed above, two particular features of the simulations that seemed to be important for influencing encapsulation efficiency were the density of the nascent nanoparticle, and the orientational preferences of absorbed drug molecules. We evaluated the former by comparing the total radius of gyration of the nanoparticle in atomistic versus multiscale representations, and the latter using the orientational metric described in the Method section.
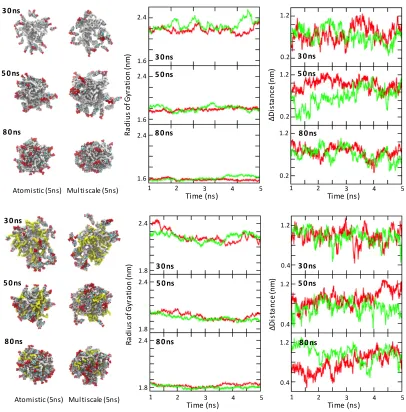
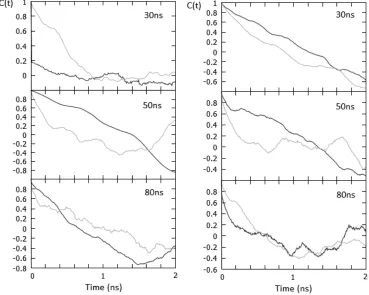
Figure 5 Analysis for PGA100 (top) PGA20-co-C18PGA80 (bottom) with DXMP. Left: Two snapshots from the end of the 5 ns simulations using both atomistic and multiscale force fields. DXMP (multi), PGA (white with C18 chains yellow). Graphs for the total radius of gyration of the polymer cluster (middle) and the orientation of DXMP in relation to the centre of mass of the polymer chains (right). Atomistic (red), multiscale (green).
Since we were studying sub-sections from a larger simulation, taken at non-equilibrated periods, we expected that, even over 5 ns, the simulations would show some temporal-evolution in the chosen metrics. At the same time, the confinement of the system within a much smaller periodic box meant that its behaviour would probably differ to some
Ra di us 'o f'G yr at io n' (n m ) 1.6 1.6 1.6 2.4 2.4 2.4 1 5 Time'(ns)
2 3 4
ΔDi st an ce '(n m ) 1 5 Time'(ns)
2 3 4
0.2 1.2 0.2 1.2 0.2 1.2 Multiscale'(5ns) Atomistic'(5ns) 30ns 50ns 80ns 30ns 50ns 80ns 30ns 50ns 80ns Ra di us 'o f'G yr at io n' (n m ) 1.8 1.8 1.8 2.4 2.4 2.4 1 5 Time'(ns)
2 3 4
ΔDi st an ce '(n m ) 1 5 Time'(ns)
2 3 4
[image:11.612.95.501.173.585.2]extent from that observed in the parent simulation. The key test was that atomistic and multiscale subsystems should behave equivalently as, indeed, was found to be the case (Figure 5). Changes from the initial configurations were minor, and the degree and rate of change in each parameter was very similar between atomistic and multiscale models. The simulations started at 30 ns showed the greatest relaxation, presumably because they began from configurations that were furthest from equilibrium (Figure 5).
Due to the short nature of these comparison simulations we wanted to analyse the autocorrelation function to ascertain how relaxed the polymer was during the simulations (Figure 6).
[image:12.612.95.464.228.523.2]!
Figure 6 The autocorrelation function for PGA100 (left) and PGA20-co-C18PGA80 (right) was calculated using the radius of gyration for the polymer in Fig 4. Atomistic (dark grey), multiscale (light grey).
Due to the limited number of data points and replicas, the curves are noisy, but it can be seen that in general the relaxation rates of the polymer chains are broadly similar in the multiscale and fully atomistic simulations.
Further Investigation of the Relative Dielectric Constant
To assess the effects of the relative dielectric constant (εr) on the multiscale simulation
(Figure 7A). Our original multiscale simulation uses εr = 6; we tested the DXMP
orientation and nanoparticle structure obtained using values of 1 and 15 and a pure coarse-grained model using εr = 15.
With εr = 1 the DXMP has an orientation almost the opposite of that found in the
atomistic and original multiscale (εr = 6) simulations. The phosphate head groups tend to
be closer to the centre of mass of the nanoparticle than the oxygen atoms at the tail end of the molecule. This is not unexpected, because in the multiscale simulations the solvent is only modelled at the coarse-grained level and so does not have any electrostatic interactions. Our multiscale parameterisation increases the coarse-grained phosphate-water non-bonded interactions, which leads to a better approximation of atomistic behaviour. An increase of the dielectric constant to 15 allows the orientational preference of the absorbed drug to be predominantly maintained, but the reduction in the strength of all electrostatic interactions results in a generally flatter potential energy surface and orientational fluctuations become much more pronounced.
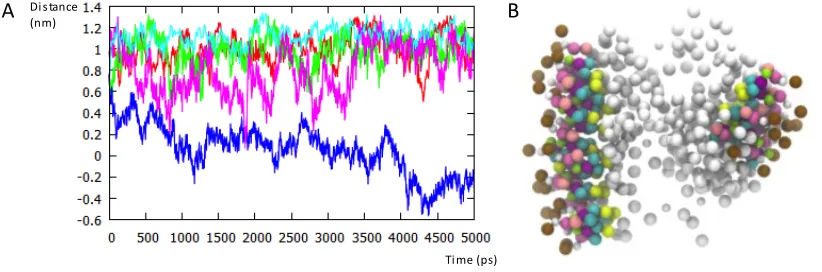
Figure 7 A: Graph for the orientation of DXMP with respect to the polymer centre of mass in five different systems. Atomistic (red), multiscale (εr = 6) (green), multiscale (εr = 1) (blue), multiscale (εr = 15) (pink), coarse-grain (εr = 15) (cyan). B: A snapshot taken at the end of the coarse-grain simulation. PGA20-co-C18PGA80 (white), DXMP (multi), brown spheres represent the phosphate group of DXMP.
Perhaps surprisingly, the pure coarse-grained system, though lacking any atomistic solute-solute interactions, shows an orientation of DXMP that is very similar to that of the atomistic simulation, though with reduced fluctuations. However, while this single metric seems well satisfied, other aspects of the simulation are different from the atomistic standard such DXMP molecules aligning in an ordered crystal-like structure (Figure 7B). This result demonstrates the way in which the atomistic and coarse-grained aspects of a multiscale force field can interact in a complex way which is challenging to predict.
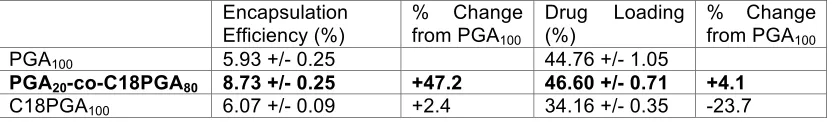
Encapsulation Efficiency and Drug Loading
Experimentally, PGA20-co-C18PGA80 nanoparticles have shown a higher DXMP loading
and encapsulation efficiency than those based on PGA10. Our simulation results are in
qualitative agreement with this trend: after running triplicates of both simulations we found an increase in encapsulation efficiency and drug loading between these two polymers (Table 1).
Time%(ps) Distance
(nm)
[image:13.612.96.507.301.437.2]To test our model further we also simulated the encapsulation of DXMP by 100% C18 esterified PGA. Experimentally a lower encapsulation efficiency is seen compared with PGA20-co-C18PGA8010. We found that our model also confirmed this experimental trend
with a reduction in encapsulation efficiency and drug loading for C18PGA100 when
compared with PGA20-co-C18PGA80 (Table 1). Encapsulation
Efficiency (%)
% Change from PGA100
Drug Loading (%)
% Change from PGA100
PGA100 5.93 +/- 0.25 44.76 +/- 1.05
PGA20-co-C18PGA80 8.73 +/- 0.25 +47.2 46.60 +/- 0.71 +4.1
C18PGA100 6.07 +/- 0.09 +2.4 34.16 +/- 0.35 -23.7
Table 1 Encapsulation efficiency and drug loading for the three polymer systems is calculated for triplicate repeats. Data is obtained from the final snapshot of the simulation.
The correlation between simulations and the experimental trends observed for drug incorporation provide mechanistic insight as to why PGA20-co-C18PGA80 is the most
effective polymer at encapsulating DXMP. DXMP is amphiphilic (logP = 1.56) and can interact favourably with both the organic and aqueous phases in the system. From our simulations we observed that DXMP is surface active, with multiple molecules positioned at the surface of the shrinking acetone drop. As the drop reduces in size this brings the drug molecules towards the surface of the aggregating polymer chains. This drives the interaction of DXMP with the polymer nanoparticle.
One advantage of using a computational model is that it can be quickly adjusted to test the new hypotheses. To further assess the effect of acetone dispersion on drug loading and encapsulation efficiency we ran a simulation of PGA20-co-C18PGA80 with DXMP in pure water without acetone. The polymer and drug molar ratios were kept the same as in the original multiscale simulation with acetone. We found a 23% reduction in the drug loading and 43% decrease in the encapsulation efficiency when compared to the original simulations using an acetone droplet.
This result, albeit difficult to test experimentally, confirms our initial findings that acetone plays a major role in bringing drug molecules close to the surface of the polymer. A lack of acetone also results in faster polymer intermolecular collapse which prevents the polymer chains from interacting with DXMP. It also indicates that a drug molecule benefits from having interactions with both the acetone and water as this will allow the drug to be drawn towards the polymer as the acetone drop shrinks, increasing encapsulation efficiency and loading.
The positioning of DXMP at the acetone drop surface could also explain why experimental work shows that this drug is encapsulated better than cytarabine by these polymers10. Cytarabine, with a log P of -2.8 and no charged groups may not show affinity
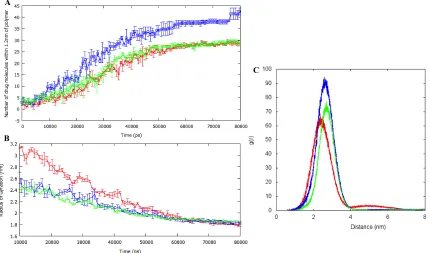
[image:14.612.91.508.155.216.2]Figure 8 Metrics obtained from the 80ns nanoprecipitation simulations: (A) Number of DXMP molecules within 1.2nm of the polymer chains. (B) Radius of gyration of the all the polymers during the 10-80ns phase in the simulation. (C) The radial distribution functions of DXMP from the centre of mass of the polymer during the last 30ns of the simulation. Error bars are included (on A and B) for the standard error of the mean from triplicate repeats. PGA100 (red), PGA20-co-C18PGA80 (blue), C18PGA100 (green).
The dispersion of acetone is consistent in all three systems yet we see differences in encapsulation efficiency i.e. the amount of drug that reaches the surface of the polymer nanoparticle. We analysed the interaction of the polymer chains with the drug molecules over the course of the 80 ns simulations (Figure 8A). Specifically we looked within the 1.2nm cut-off for intermolecular interactions used in the simulations.
As the acetone drop disperses, DXMP molecules are brought within the 1.2nm cut-off and they interact with the polymer chains. A saturation process is evident, and it is evident that PGA20-co-C18PGA80 is able to interact with more drug molecules than the
other two polymers.
Calculating the radial distribution of DXMP around the centre of mass of the polymer cluster during the last 30ns of the nanoprecipitation simulations also revealed similar results (Figure 8B). The PGA20-co-C18PGA80 nanoparticle has a larger number of drug
molecules surrounding it than PGA100 or C18PGA100.
To analyse these results further the total radius of gyration (Rg) for all the polymers was
calculated during the 10-50 ns time period (Figure 8C). As acetone disperses the polymer is exposed to water and this triggers the aggregation of the polymer chains. PGA100 is most soluble in both acetone and water and so maintains the highest Rg during
A
B
[image:15.612.94.523.78.331.2]this time period. C18PGA100 is the most hydrophobic polymer, and it compacts most
quickly and most extensively. We conclude therefore that the optimal drug loading properties of PGA20-co-C18PGA80 are a result of a balance between the possibility of
favourable, hydrophobic, drug binding sites on the surface of the nanoparticle (favoured by increasing levels of acylation) and the degree of collapse, and so effective surface area, of the nanoparticle (favoured by decreased levels of acylation).
These results are in agreement with contact angle measurements on similar PGA polymers by Orafai et al.29 A PGA60-co-C8PGA40 polymer showed the lowest surface
free energy when compared with PGA100 and C8PGA100 polymers due to a balance of
polar and nonpolar components. CONCLUSION
A multiscale (dual resolution) modelling method has been used to simulate the encapsulation of DXMP by three related polymers. Detailed insights have been gained regarding the effects of acetone dispersion on the behaviour and interactions of drug and polymer molecules. DXMP molecules are surface active and show a preference for the retreating organic/aqueous interface of the dispersing drop of acetone. This results in the drug molecules being drawn towards the aggregating polymer chains within the shrinking acetone drop. An agreement with the experimental trend in encapsulation efficiency has been found for the three polymers tested. Our simulations show whilst C18 chains are required to interact favourably with DXMP having too many decreases solubility preventing the polymer from interacting with surrounding DXMP molecules. A balance between hydrophobic and hydrophilic moieties in the polymer seems to be important for optimal drug incorporation.
In the absence of further experimental data to confirm details of our multiscale modelling, resolution transformation has been used to reintroduce atomistic detail to coarse-grain solvent. Fully atomistic simulations support the (relative) accuracy of the larger multiscale simulations.
Our success here and the relative simplicity of the multiscale modelling method has encouraged us to apply the approach to the simulation of new PGA derivatives with other small molecule drugs, and should help facilitate the design of more efficient PGA drug delivery systems in the future.
ACKNOWLEDGEMENT
SUPPORTING INFORMATION
Details of the coarse-graining, and all non-standard force field parameters. This information is available free of charge via the Internet at http://pubs.acs.org/.
REFERENCES
(1) Wang, A. Z.; Langer, R.; Farokhzad, O. C. Annu. Rev. Med.2012, 63, 185–198.
(2) Kallinteri, P.; Garnett, M. Polymeric Nanoparticles for Drug Delivery.
Nanotechnologies for the Life Sciences; Kumar, C. S. S. R., Ed.; Wiley-VCH Verlag GmbH & Co. KGaA: Weinheim, Germany, 2007.
(3) Mattheolabakis, G.; Rigas, B.; Constantinides, P. P. Nanomedicine (Lond).2012,
7, 1577–1590.
(4) Ahmed, M.; Ramadan, W.; Rambhu, D.; Shakeel, F. Pharmazie2008, 63, 806– 811.
(5) Carvalho, F. C.; Barbi, M. S.; Sarmento, V. H. V; Chiavacci, L. A.; Netto, F. M.; Gremião, M. P. D. J. Pharm. Pharmacol.2010, 62, 430–439.
(6) Liu, J.; Xiao, Y.; Allen, C. J. Pharm. Sci.2004, 93, 132–143.
(7) Jeong, B.; Choi, Y. K.; Bae, Y. H.; Zentner, G.; Kim, S. W. J. Control. Release
1999, 62, 109–114.
(8) Vega, E.; Gamisans, F.; García, M. L.; Chauvet, A.; Lacoulonche, F.; Egea, M. A.
J. Pharm. Sci.2008, 97, 5306–5317.
(9) Jelonek, K.; Kasperczyk, J.; Li, S.; Dobrzynski, P.; Jarzabek, B. Int. J. Pharm.
2011.
(10) Puri, S.; Kallinteri, P.; Higgins, S.; Hutcheon, G. A.; Garnett, M. C. J. Control. Release2008, 125, 59–67.
(11) Vauthier, C.; Bouchemal, K. Pharm. Res.2009, 26, 1025–1058.
(12) Galindo-Rodriguez, S.; Allémann, E.; Fessi, H.; Doelker, E. Pharm. Res.2004, 21, 1428–1439.
(13) Srinivas, G.; Discher, D. E.; Klein, M. L. Nat. Mater.2004, 3, 638–644.
(14) Fukunaga, H.; Takimoto, J.; Doi, M. J. Chem. Phys.2002, 116, 8183.
(15) Samanta, S.; Roccatano, D. J. Phys. Chem. B2013, 117, 3250–3257.
(17) Loverde, S. M.; Ortiz, V.; Kamien, R. D.; Klein, M. L.; Discher, D. E. Soft Matter
2010, 6, 1419–1425.
(18) Moeendarbary, E.; Ng, T. Y.; Zangeneh, M. Int. J. Appl. Mech.2010, 02, 161.
(19) Ortiz, V.; Nielsen, S. O.; Discher, D. E.; Klein, M. L.; Lipowsky, R.; Shillcock, J. J. Phys. Chem. B2005, 109, 17708–17714.
(20) Spaeth, J. R.; Kevrekidis, I. G.; Panagiotopoulos, A. Z. J. Chem. Phys.2011, 135, 184903.
(21) Hess, B.; Kutzner, C.; Van Der Spoel, D.; Lindahl, E. J. Chem. Theory Comput.
2008, 4, 435–447.
(22) Marrink, S. J.; Risselada, H. J.; Yefimov, S.; Tieleman, D. P.; de Vries, A. H. J. Phys. Chem. B2007, 111, 7812–7824.
(23) Rzepiela, A. J.; Louhivuori, M.; Peter, C.; Marrink, S. J. Phys. Chem. Chem. Phys.
2011, 13, 10437–10448.
(24) Wassenaar, T. A.; Ingólfsson, H. I.; Priess, M.; Marrink, S. J.; Schäfer, L. V. J. Phys. Chem. B2013, 117, 3516–3530.
(25) Bakowies, D.; Baron, R.; Christen, M.; Hu, P. H.; Geerke, D. P.; Heinz, T. I. M. N.; Kastenholz, M. A.; Gunsteren, W. F. V. A. N. J. Comput. Chem.2005, 7, 1719– 1751.
(26) Malde, A. K.; Zuo, L.; Breeze, M.; Stroet, M.; Poger, D.; Nair, P. C.; Oostenbrink, C.; Mark, A. E. J. Chem. Theory Comput.2011, 7, 111027125018002.
(27) Rühle, V.; Junghans, C.; Lukyanov, A.; Kremer, K.; Andrienko, D. J. Chem. Theory Comput.2009, 5, 3211–3223.
(28) Wassenaar, T. A.; Pluhackova, K.; Böckmann, R. A.; Marrink, S. J.; Tieleman, D. P. J. Chem. Theory Comput.2014, 10, 676–690.
R. Mackenziea, J. Boothb, C. Alexanderc, M. C. Garnettc, C.A. Laughton*a
aDivision of Medicinal Chemistry & Structural Biology, School of Pharmacy, University of Nottingham,
UK
bPharmaceutical Development, AstraZeneca, UK
cDivision of Drug Delivery & Tissue Engineering, School of Pharmacy, University of Nottingham, UK
SUPPORTING INFORMATION
Force Field Parameters
! Figure'1'Mapping'schemes'used'in'the'multiscale'force'field'and'the'bead'types'for'CG'interactions.'A:'PGA,'B:'C18PGA,' C:'DXMP,'D:'Solvent'and'ions,'E:'PGA'termini. O O O O OH O O O O OH O O O O O O O O O O O H O CH3 CH3 OH HO H H CH3 F O O P O O O A B C AX# BX# DX#
AX# CX# CX#
BX#
AX# BX#
DX#
LX# CX# CX#
BX#
GX# HX# IX# JX# KX#
ID# HD# GD# ED# FD# DD# AD# CD# BD# P4# Na# D
Water Acetone Sodium Ion
NA+
E
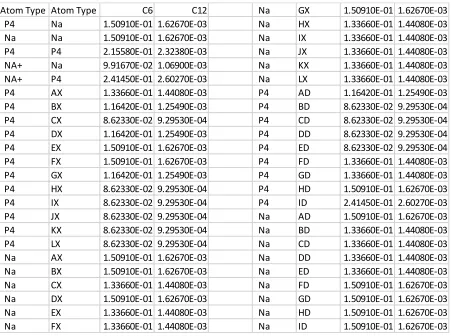
Table 2 C6 and C12 values for the Lennard Jones potential for CG interactions used in the model; includes water, acetone and ion interactions with PGA, C18PGA and DXMP.
Atom types and pair types for atomistic interactions are not changed from their defaults in the GROMOS96 53a6 force field.
%%Na% Na% 1.50910E701 1.62670E703 %%Na% IX% 1.33660E701 1.44080E703
%%P4% P4% 2.15580E701 2.32380E703 %%Na JX% 1.33660E701 1.44080E703
%%NA+% Na% 9.91670E702 1.06900E703 %%Na% KX% 1.33660E701 1.44080E703
%%NA+ P4 2.41450E701 2.60270E703 %%Na% LX% 1.33660E701 1.44080E703
%%P4% AX% 1.33660E701 1.44080E703 %%P4% AD% 1.16420E701 1.25490E703
%%P4% BX% 1.16420E701 1.25490E703 %%P4% BD% 8.62330E702 9.29530E704
%%P4% CX% 8.62330E702 9.29530E704 %%P4% CD% 8.62330E702 9.29530E704
%%P4% DX% 1.16420E701 1.25490E703 %%P4% DD% 8.62330E702 9.29530E704
%%P4% EX% 1.50910E701 1.62670E703 %%P4% ED% 8.62330E702 9.29530E704
%%P4% FX% 1.50910E701 1.62670E703 %%P4% FD% 1.33660E701 1.44080E703
%%P4% GX% 1.16420E701 1.25490E703 %%P4% GD% 1.33660E701 1.44080E703
%%P4% HX% 8.62330E702 9.29530E704 %%P4% HD% 1.50910E701 1.62670E703
%%P4% IX% 8.62330E702 9.29530E704 %%P4% ID% 2.41450E701 2.60270E703
%%P4% JX% 8.62330E702 9.29530E704 %%Na% AD% 1.50910E701 1.62670E703
%%P4% KX% 8.62330E702 9.29530E704 %%Na% BD% 1.33660E701 1.44080E703
%%P4% LX% 8.62330E702 9.29530E704 %%Na% CD% 1.33660E701 1.44080E703
%%Na AX% 1.50910E701 1.62670E703 %%Na% DD% 1.33660E701 1.44080E703
%%Na% BX% 1.50910E701 1.62670E703 %%Na% ED% 1.33660E701 1.44080E703
%%Na% CX% 1.33660E701 1.44080E703 %%Na% FD% 1.50910E701 1.62670E703
%%Na% DX% 1.50910E701 1.62670E703 %%Na% GD% 1.50910E701 1.62670E703
%%Na EX% 1.33660E701 1.44080E703 %%Na% HD% 1.50910E701 1.62670E703
[image:21.595.74.525.70.406.2]