LINEAR AND NONLINEAR OPTICAL PULSE
CHARACTERISATION
Andrew Finch
A Thesis Submitted for the Degree of PhD
at the
University of St Andrews
1989
Full metadata for this item is available in
St Andrews Research Repository
at:
http://research-repository.st-andrews.ac.uk/
Please use this identifier to cite or link to this item:
http://hdl.handle.net/10023/15037
LINEAR AND N ON U N E AR OPTICAL
PULSE CHARACTERISATION
A thesis submitted for the degree of Doctor of Philosophy to the University of St. Andrews
by
Andrew Finch, B.A., M.Sc. March 1989
1 I
■1
ProQuest Number: 10166817
All rights reserved
INFORMATION TO ALL USERS
The quality of this reproduction is dependent upon the quality of the copy submitted.
In the unlikely event that the author did not send a com plete manuscript and there are missing pages, these will be noted. Also, if material had to be removed,
a note will indicate the deletion.
uest
ProQuest 10166817
Published by ProQuest LLO (2017). Copyright of the Dissertation is held by the Author.
All rights reserved.
This work is protected against unauthorized copying under Title 17, United States C ode Microform Edition © ProQuest LLO.
ProQuest LLO.
789 East Eisenhower Parkway P.Q. Box 1346
DECLARATIONS
I hereby certify that the candidate has fulfilled the conditions of the Resolution and Regulations appropriate to the Degree of Ph.D.
W.Sibbett Research Supervisor March 1989
I, Andrew Finch, hereby certify that this thesis has been composed by myself, that it is a J record of my own work, and that it has not been accepted in partial or complete fulfilment
of any other degree of professional qualification. I was admitted to the Faculty of Science of the University of St. Andrews under Ordinance general No 12 on October, 1984 and as a candidate for the degree of Ph.D on October, 1985.
In submitting this thesis to the University of St.Andrews I understand that I am giving permission for it to be made available for use in accordance with the regulations of the University Library for the time being in force, subject to any copyright vested in the work not being affected thereby. I also understand that the title and abstract will be published, and that a copy of the work may be made and supplied to any bona fide library or research worker.
A.Finch March 1989
ABSTRACT
Developmental work on the generation and measurement of ultrashort pulses has been performed. A colliding pulse, passively mode-locked (CPM) ring dye laser has been investigated by spectral analysis and the nonlinear technique of second harmonic generation autocorrelation. Two systems for the intracavity compensation of group velocity dispersion (GVD) have been experimentally compared in the CPM laser. Initially one scheme, utilising Gires-Toumois interferometers, has achieved pulse durations of 64 fs. A second technique employing a four-prism sequence within the cavity gave typical pulse durations of ~40 fs
and focussing adjustments within the jets achieved durations as short as 19 fs for the first -Ç time. A realtime interferometric autocorrelator was constructed and detailed theoretical work
has been performed to model the resultant fringe resolved autocorrelations as a function of pulseshape and frequency chirp. Spectral and autocorrelation analysis of the CPM laser led to the inference that the laser pulse intensity profiles were distinctly asymmetric. The main sources of frequency chirp within the laser cavity were assessed in order to find possible explanations for this type of laser behaviour.
The linear pulse measurement technique employing synchroscan streak cameras was also critically assessed in terms of the available temporal resolutions as a function of phase noise in the RF deflection signal. Two streak tube designs, the Photochron II and the Photochron IV, have been experimentally compared employing the CPM laser as a test pulse source. Optimisation of the synchronisation circuitry has allowed the notable achievement of a temporal resolution of 0.93ps for the Photochron IV streak camera. A computer-interfaced readout system incorporating a charge coupled device (CCD) sensor has been developed which allows the recording of synchroscan streak events with a digitisation accuracy up to 12 bits. Preliminary experimentation was also performed to investigate the feasibility of incorporating a electron sensitive CCD structure within the envelope of the streak camera. It is intended that such a streak camera will be incorporated
"
in a spaceborne laser ranging system and a theoretical assessment of the expected instrument performance has been performed.
The above investigations have direct relevance to other types of ultrashort pulse sources and their application in optical communications, time-resolved spectroscopy and ultrafast electrooptic sampling.
Dedicated to my mother, Will, Jackie and Dave.
I
i
Frontispiece (overleaf): Photograph of the colliding pulse, mode-locked ring dye laser.
’^5 "F
I
a
C.QM.I£MTS
ABSTRACT CONTENTS INTRODUCTION
References
CHAPTER 1: ULTRASHORT PULSE GENERATION T H E
Page No
COLLIDING PULSE MODE-LOCKED DYE LASER
1.0 Introduction 5
1.1 The dye lasing medium 5
1,2 Principles of mode-locking 7
1.3 Active mode-locking 8
1.4 Passive mode-locking 9
1.5 The CPM dye laser - an historical overview 12 1.6 Dispersion compensation in the CPM laser 15
1.7 Summary 20
References 20
SECTION I
EAR PULSE M EASUREMENT - STREAK CAMERAS
2: STREAK CAMERA DESIGN, CONSTRUCTION AND
OPERATION
2,0 Introduction 24
2.1 Image tube design and operation 25
2.2 Streak tubes 30
2,3 Tube designs - A brief historical overview 33 2.4 Computer aided design of streak cameras 36
2.5 Conclusions 45
References 46
■
CHAPTER 3; Dy n a m i c o p e r a t i o n o f t h e Ph o t o c h r o n i i s t r e a k TUBE
3.0 Introduction 49
3.1 Passive synchronisation 50
3.2 Readout system 56
3.3 Photochron HA performance 57
3.4 Effect of phase modulation on streak camera performance 61
3.5 Synchroscan operation at 200 MHz 64
3.6 Conclusions 67
References 67
: 4: Sy n c h r o s c a n o p e r a t i o n o f t h e p h o t o c h r o n I V s t r e a k c a m e r a
4.0 Introduction 69
4.1 Static performance 69
4.2 Dynamic performance 70
4.3 Active synchronisation 72
4.4 Phase noise sources and effects 75
4.5 Noise levels in passive and active synchronisation systems 79
4.6 Conclusions and future work 84
References 85
Ch a p t e r 5. s o l i d-s t a t e s t r e a k c a m e r a r e a d o u t s y s t e m s
5.0 Introduction 86
5.1 Charge coupled devices - an overview 87
5.2 The P8602 area array 94
5.3 12-Bit digitisation system 95
5.4 8-Bit imaging system 101
5.5 System spatial resolution 102
5.6 Device sensitivity 102
5.7 CCD noise 105
5.8 Streak image readout 107
"I
5.9 Conclusions 109
References 109
Ch a p t e r 6: Ph o t o c h r o n ii c s t r e a k c a m e r a w i t h e l e c t r o n SENSITIVE PHOTODIODE/CCD READOUT - PRELIMINARY INVESTIGATIONS
6.0 Introduction 110
6.1 Image tube configuration 111
6.2 Readout format 112
6.3 Design features of the SSCEDA 113
6.4 Tube construction 118
6.5 Tube processing compatibility tests 120
6.6 Present status of space project 130
References 131
SECTION II ’
NONLINEAR PULSE MEASUREMENT - SECOND HARMONIC AU TO CO RRELATIO N
CHAPTER 7: SECOND HARMONIC AUTOCORRELATION TECHNIQUES |
7.0 Introduction 133
7.1 Intensity autocorrelation 133
7.2 Interferometric autocorrelation 136
7.3 Pulseshape modelling 138
7.4 Pulse autocorrelation and spectral characteristics 141
7.5 Conclusions 159
References 159
Ch a p t e r 8: Pu l s e s h a p e c h a r a c t e r i s a t i o n - Co r r e l a t i o n
AND s p e c t r a l MEASUREMENT TECHNIQUES
8.0 Introduction 160
8.1 Design aspects 160
8.2 The SHG crystal 166 I
8.3 Spectral measurements 166
8.4 Cross-correlation techniques 167
References 169
C h a p t e r 9: Pe r f o r m a n c e c h a r a c t e r i s a t i o n o f t h e COLLIDING PULSE MODE-LOCKED RING DYE LASER
9.0 Introduction 171
9.1 Construction of the CPM laser cavity 171
9.2 Laser performance 172
9.3 GVD compensation in the CPM laser 179 9.4 CPM performance with GVD compensating prisms 185
9.5 Evidence for pulse asymmetry 195
9.6 Propagation of laser pulses through glass 200
9.7 Conclusions 202
References 202
Ch a p t e r 10: g e n e r a l c o n c l u s i o n s a n d f u t u r e w o r k 204
References 207
APPENDICES
APPENDIX A: SPACEBORNE LASER RANGING 208
Ap p e n d i x b: e l e c t r o n s e n s i t i v e c c d r e a d o u t a r r a y
FOR A CIRCULAR-SCAN STREAK TUBE 215
ACKNOWLEDGEMENTS PUBLICATIONS
i
3
1
.■I
I
I
-•i
ImEQPU-CIIQN
Over recent years the need for improvement in the measurement and characterisation of ultrashort pulses has become of prime importance. Refinement of mode-locked lasers has led to the direct generation of sub-30fs duration pulses in the visible spectral region and
pulse durations of -200fs in the near-infrared range Additional extracavity | amplification and temporal compression has produced pulse durations as short as 6fs at
630nm M and 9fs at 800-840nm Consequently it is vital that pulse monitoring systems can exhibit the temporal resolutions required to characterise such lasers and to further allow time-resolved analysis of the excitation processes these ultrashort pulse sources may induce.
The object of this thesis is to report on the work carried out during a PhD project into the development and improvement of two separate and distinct techniques of pulse characterisation: (i) a linear technique employing electron-optical streak cameras, and (ii) the nonlinear technique of second harmonic generation (SHG) autocorrelation. The available resolution of each technique differs at present by several orders of magnitude - in the case of the streak camera pulse durations of -Ip s are measurable, whereas SHG autocorrelation can provide temporal characterisations in the femtosecond regime. The systems described here were developed around a colliding-pulse, passively mode-locked (CPM) CW ring dye laser incorporating Rhodamine 6G as the gain and DODCI as the passive medium. Initial results will concern the laser operated without any form of cavity dispersion compensation and later results are presented with a 4-prism dispersion compensation system included. The CPM laser output is monitored in realtime by the SHG correlation technique and provides excellent "quasi-delta function" test pulses for the streak
camera which, as stated above, cannot resolve the tens of femtosecond duration pulses that x» the laser produces. Not that this implies the streak camera is of no use as a diagnostic of the
laser performance. It has proved invaluable in the assessment of the stability of the laser pulse train and indeed the radical improvement of the laser performance both temporally
i
(the notable reduction of pulse durations from <-80 fs to <20 fs) and in terms of phase and amplitude stability was assisted in part by streak camera studies.
The thesis is presented with an initial introductory chapter, two main sections, a final general conclusion and relevant appendices. In the Chapter 1 the CPM laser is introduced
including an historical overview of passive mode-locking techniques. The theories f developed to explain the underlying physical processes leading to ultrashort pulse
generation are also presented. The importance of compensation of the group velocity dispersion (GVD) from cavity optics is discussed and how by incorporation of suitable compensating elements pulse duration can be reduced. Following this the main part of this thesis is divided into two sections.
Section I is devoted to streak cameras, the development of novel electronic methods f for driving them in repetitive or "synchroscan" mode and the design and implementation of * charge coupled device (CCD) streak camera readout systems for laboratory and spaceborne
applications. Including an historical overview of streak camera design, details of the factors | which limit streak tube performance and the computational techniques employed in their
design are dealt with in Chapter 2. Two particular streak tube designs are introduced, | namely the Photochron II and Photochron IV t^l and when tested in synchroscan mode
the experimental observations are presented in Chapters 3 and 4 respectively. Within this
experimentation the importance of laser stability is demonstrated and a theoretical analysis 4 of the effects of phase noise in the drive signal on achievable temporal resolution is
presented. Chapters 5 and 6 are concerned with the development and performance evaluation of CCD readout systems for streak cameras; the latter chapter including the assessment of the performance of an electron-sensitive CCD device incoiporated within the
4
vacuum envelope of a circular scan streak tube (CSST). It is intended that such streak cameras will form an integral component of a spaceborne laser ranging system [lOl and this . technique is outlined in Appendix A. An analysis of the sensitivity requirements of the ■ CCD device is given in a conference reprint which is included in Appendix B. 3
REFERENCES
1 J.A Valdmanis, R.L Fork, and J.P Gordon, Opt. Lett. 10 131 (1985).
2 N.Langford, R.S.Grant, W.Sibbett, and K.Smith, CLEG '88 Tech. Dig. 7, THJ2 326, (1988).
3 P.Kean, X.Zhu, D.W.Crust, R.S.Grant, N.Langford and W.Sibbett, Opt. Lett. 14 39 (1989).
4 R.L.Fork, C.H.Brito-Cruz, P.C.Becker, and C.V.Shank, Opt. Lett. 12 483 (1987). 5 P.C.Becker, H.L.Fragnito, R.L.Fork, F,A.Beisser, and C.V.Shank, Proc. IQEC88,
Post-deadline paper PD-15, 36 (1988).
6 G.H.C.New, Rep. Prog. Phys. 46 877 (1983).
7 O.E.Martinez, R.L.Fork and J.P.Gordon, J.Opt. Soc. Am B 2 753 (1985),
autocorrelation functions as an aid to determining pulseshape and chirp content In Chapter 7 numerical techniques employed to calculate expected autocorrelation functions for pulses of differing intensity profiles and containing various types of frequency chirp are described. The pertinent design aspects of a realtime interferometric correlator are discussed in Chapter 8 where details are included for a system employed in the characterisation of the CPM dye laser. In Chapter 9 the CPM laser itself is examined although some of its properties will have been referred to in preceding chapters. Here the performance characteristics of the CPM laser developed at St Andrews are detailed for two schemes of GVD compensation using Gires-Toumois Interferometers (GTI’s) and a four-prism sequence [14], xhe frequency chirping processes inside the absorber jet are investigated and
the frequency sweep across the laser pulse under various operating conditions is calculated # [15]. Temporal and spectral data are presented which suggests that the pulses emanating | from this particular laser have an asymmetrical intensity profile.
Finally in the concluding Chapter 10 the research project is summarised and future g avenues of development suggested for the CPM laser, the SHG autocorrelator and the
8 P.R.Bird, D J.Bradley and W.Sibbett, Proc. Xlth ICHSP 112 (1974).
9 W.Sibbett, H.Nui, arid M.R. Baggs, Rev. Sci. Instr. 53 758 (1982). | 1® H.Lutz, W.Krause and G.Barthel, Space 2000 Amer. Inst, of Aeronautics and
Astronautics, New York, p.236 (1983).
11 A.Finch, W.Sibbett, W.E.Sleat, C.Claeys, I.Debusschere and W.Krause, Proc. Conf.on Solid State imagers and their applications, SPIE 591 31 (1985).
12 J.C.Diels, J.J.Fontaine, I.CMcMichael and F.Simoni, Appl. Optics 24 1270 (1985). # 15 P.M.W.French, G.F.Chen and W.Sibbett, Opt. Comm. 57 263 (1986).
14 R.L.Fork, O.E.Martinez and J.P.Gordon, Opt. Lett. 9 150 (1984).
15 R.S.Miranda, G.R.Jacobovitz, C.H.Brito Cruz and A.F.Sarpara, Opt. Lett. 11 224 (1986).
CHAPTER 1; ULTRASHORT PULSE GENERATION - THE COLLIDING PULSE MODE-LOCKED DYE LASER
to the lowest Si state. Then either a fast (lasing) transition can occur into the Sq manifold
1.0 INTRODUCTION
The colliding-pulse passively nrode-locked (CPM) CW ring dye laser has proved to be an excellent ultrashort pulse source for the development and refinement of the pulse measurement techniques discussed in the following two sections. The purpose of this chapter is to describe the general operating principles of the CPM laser and its historical development. An outline is given of the principles of mode-locking with particular reference to the case of passive mode-locking and this theory is then expanded to
incorporate the role of intracavity group velocity dispersion (GVD) and self-phase S modulation (SPM).
1.1 Th e d y e l a s i n g m e d i u m
The gain medium usually employed in CPM lasers is an organic dye molecule | dissolved in a suitable solvent (eg. ethylene glycol). Such molecules contain large numbers
of conjugated carbon bonds which produce a set of delocalised 7C-electrons free to move along the molecule's length. Effectively the electrons can be seen to be confined along the molecule chain and a set of energy levels are generated characteristic of the eigenstates of a
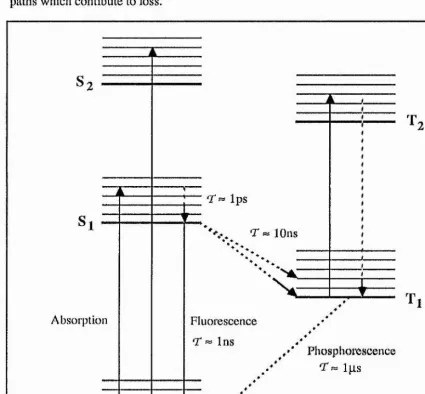
one-dimensional potential well. An electron if excited can reside in an upper level with spin | antiparallel (singlet) or parallel (triplet) to the singlet ground state. The singlet-singlet | transition is short lived (fluorescence lifetime - Ins) and consequently is a useful lasing i
f' transition whereas the slower spin forbidden triplet-singlet phosphorescence transition of | order several ps can be a problematic bottleneck. Superimposed on the fine structure are a
set of vibrational and rotational splittings giving the overall energy diagram represented in 3 figure 1.1 which applies to the Rhodamine 6G dye molecule. From the diagram it can be
seen that the dye molecule is a 4-level lasing system. Pump excitation raises the molecule
into some level in the vibrational manifold which is followed by a fast non-radiative decay kg a
followed by thernialisalion to the ground state or a slower (-10 ns) spin forbidden transition occurs to the triplet level leading to a loss in lasing efficiency. Additionally since the T1-T2 transition overlaps with the fluorescence spectrum there exist other transition
paths wliich contibute to loss.
Absorption
£
T = IpsT ^lO ns£
TFluorescence T ~ Ins
Phosphorescence T « Ips
0
Figure 1.1 Energy level diagram of a typical dye molecule showing radiative (solid lines) and non-radiative (broken lines) transitions.
[image:19.612.90.515.169.563.2]1.2 Pr i n c i p l e s o f m o d e-l o c k i n g
The phase-locking of the longitudinal modes of a laser cavity leads to the confinement of a plioton flux within the cavity into a small spatial region or, alternatively, it may be viewed as the maintenance of the photon energy to within a single short time period fluctuation. To explain how mode-locking is brought about we must first look at the spectral characteristics of the radiation inside a laser cavity (detailed treatments of this are also presented elsewhere U»2>3,4J),
The radiation field inside a laser cavity of length, L and mirror radius, R, with no spectral tuning elements will consist of a series of cavity modes with frequencies defined by:
q + |r(l+m +n) cos-Ul-fe) -eq(l.l) where Ov- c/2L = Tcav"^ the cavity round-trip time.
Ignoring the second term for the moment the above expression represents the allowed frequencies that the cavity can sustain such that a electric field node exists at each mirror surface (le there is an integer number, q of half-wavelengths inside the cavity - although this not exactly true since there is an axial phase delay at the cavity focus). The integers, m and n characterise the higher frequency transverse modes of the cavity for a given axial mode, defined by tiie integer q. For the con focal case, (1-L/R)i^0 and all transverse modes are degenerate with the fundamental I ’EMqo axial modes and for this reason this cavity
configuration is often used for scanning Fabry-Perot interferometers. The following discussion is confined to axial mcxle-locking although treatments exist for the special case of transverse iiKxle-locking I2| they are not relevant in the case of the CPM laser.
1 he instantaneous cavity field, E(t) will be the sum of the axial modes and can be represented in complex form by the Fourier series:
E(t) = ]^E,i exp(iMd) n
= E„ exp(i ( {xVo+ mv) t+0„)} -eq( 1.2) n
Analogous to a mathematical treatment of phase noise (given in §4.4), if there is no fixed phase relationship between the axial modes, equation 1.2 represents the vector sum of a set of uncorrelatated oscillators and the resulting temporal evolution of the electric field will be chaotic. In this particular case the random intensity variations in V(t) arise because of random interference between modes rather than intensity fluctuations of individual modes.
If a definite phase relationship is imposed on the discrete spectral components then the resultant field will vary periodically with time and the laser is said to be mode-locked although this term is usually reserved for the ptuticular case when 0n is a linear function of n ie) 0,1 = 00+ otn. The simplest case of mode-locking is when 0,, is made zero in which case equation 1.2 becomes for N oscillating modes:
(N-l)/2
E(t) = 2 Eu e'(w^+«w)t -eq(1.3) -(N-0/2
Assuming for simplicity that all axial modes have equal amplitudes (E,, = 1), the average laser output becomes IhSP
The mathematical anlaysis is almost identical to the description of the spatial intensity distribution of light diffracted by a grating except here we have a temporal analogue. From the above expression we can see that ilie power Is emitted as a pulse-train of period 2n / ru
= T'cav and the individual pulse widths At are related to the number of oscillating modes by At = Tcav /N. Hence the larger the mode-locked bandwidth the shorter the pulse duration that is produced.
There are a variety of methods available by which mode-locking can be achieved and these can be separated into two distinct types, namely active and passive mtxle-lœking.
1.3 Ac t i v e M o o ic - L o c K iN t;
In this method a periixlic mcxlulation in loss, gain or phase is applied to the radiation in the laser cavity at tiie cavity round-trip frequency or a liarmonic by means of an acousto- optic or electro-optic device. Viewed in the time domain, a pulse propagating inside the cavity passing tlirougli tlie modulator at the peak of its transmission will experience the
maximum gain and so the laser will tend to pulsed operation. Alternatively in the frequency domain the applied modulation can be seen as generating amplitude sidebands on each of the existing longitudinal modes. When the modulating frequency is tuned to the cavity frequency these side-bands overlap with adjacent modes, effectively coupling the various axial oscillators and thereby achieving mode-locking. One might wonder how this can occur in an homogeneously broadened medium but it should be remembered that the typically broad gain bandwidth is relatively flat near line centre and consequently many modes can compete and exist at the onset of the mode-locking process. Typical durations are lO-lOOps limited by the gain bandwidth of the lasing media (and hence the maximum
number of modes that can be coupled) and the quality of the active mode-locking | mechanism and power levels required (thermal effects in the modulating element, etc).
Shorter pulse durations can be achieved from lasers pumped by actively mode-locked lasers when their cavity lengths are matched to that of the source [5.6,7], Typically ten-fold
compression in duration is available by such synchronous-pimping techniques although in % some cases femtosecond pulse have been produced by suitably dispersion-compensated
cavity configurations (cf reference [81 where 29fs has been reported). Employing more
exotic synchronously-pumped configurations, with coupled cavity feedback systems which | inject chirped pulses back into a master colour centre cavity, ultrashort pulse durations of
around lOOfs have recently been generated [91. Such so-called soUton lasers - perhaps more generally coupled-cavity mode-locked (CCM) lasers is a better nomenclature - show excellent stability, comparable to passive mode-locked sources.
1.4 Pa s s i v e m o d e-l o c k i n g
This simple technique in general produces the shortest pulses. The mode-locking mechanism relies on the presence inside the cavity of an absorber that saturates at the power levels attained during lasing action. The absorber can be treated as a two-level system. For low intensities the medium absorbs the incident flux creating an excited state population. Further increase in the flux intensity causes the stimulated emission of the upper population until at a certain intensity the stimulated absorption rate is equal to the
stimulated emission rate and the medium is effectively transparent or bleached. In this situation large intensity fluctuations will experience less loss than lower intensity variations and the absorber acts to filter out a single family of fluctuations or a 'noise burst' from the random summation of the uncorrelated oscillating axial mode ensemble. In effect the absorber operates as an optical shutter which switches at the repetition frequency of the cavity. Because the pulse propagating in the cavity acts to open and close this the absorber switch itself, this mechanism is termed passive mode-locking.
cav Pulse
envelope
E(t)
Gain and absorber recovery times
Unsaturated gain level g^ Lasing
gain: g(t)' - + Absorption:
a(t)
Net gain
Net loss
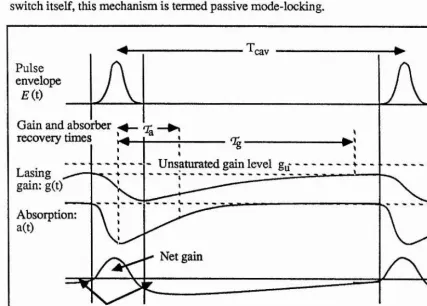
Figure 1.2 Schem atic diagram showing action of gain and absorber saturation
Since in general the spectral bandwidths of passively modelocked pulses are of the order several nanometers and consequently a very large number of axial modes are phase- locked (N« lO'^), the passive mode-locking mechanism can be readily explained in the temporal domain. Earlier theoretical analyses have been made by various authors including New and Haus to explain the pulse forming kinetics of the absorber and gain media in the laser. Figure 1.2 (adapted from reference [l]) shows the net gain presented to the selected noise burst as a function of time; indicated on the diagram is the relative recovery of the absorber and gain medium (a(t) and g(t) respectively). In basic terms the
10
•I
s
Î
I
I
[image:23.616.81.508.239.545.2]2k
%g < L -eq(1.5)
absorber, having preferentially selected a family of intensity fluctuations, will sharpen the leading edge of this noise burst and during its passage through the amplifying medium the
trailing edge of the initial 'pulse’ is also steepened due to gain saturation. The regime where ? this net pulse compression effect can occur is dependent on a critical interplay of relative
small signal gain and absorption cross-section, but passive mode-locking can be achieved for a relatively wide range of absorber recovery times, % (up to nanoseconds) as long as the gain medium can be effectively depleted by the central, peak intensity region of the pulse. This usually requires that the gain recovery time, 0^ is the of same order as Tcav
After a few hundred cavity round-trips the initial noise burst is compressed and shaped into | a discrete optical pulse, the ultimate pulse duration being determined by chirp processes
inside the nonlinear gain and absorber and their interaction with intracavity group velocity dispersion (see §1.6).
Using a simple rate equation approach New iLi2] determined the necessary conditions for pulse compression to occiu*. These mode-locking criteria stipulate that the saturation parameter {s -parameter), the ratio of the adsorber and gain cross-sections, should satisfy
the condition: s = — Z> 1 4 - ^ 0g gu -eq(1.4)
where T is the cavity loss per round-trip and gu the unsaturated absorption coefficient, and secondly the gain recovery time should be longer than that of the absorber, that is:
■ The first condition specifies that the absorber cross-section should significantly exceed the
gain cross-section, in other words the absorber medium should saturate more rapidly than the amplifying medium. These conditions are in general valid for most practical mode- locked lasers where the time variation of the laser pulse is slow compared to the dephasing time, T2 in the saturable absorber - in effect the absorption process can be treated as a
simple homogeneous transition and hence simple rate equations apply. For pulses with duration comparable or shorter than T% («20fs for DODCI t^^l) then more complex analyses are required [14] ^ series of papers by H.A.Haus [todi.4] ^ formulation
-.2
describing CW mode-locking was developed which looked for steady state solutions of a differential equation descibing the temporal evolution of the pulse envelope E(t):
where: 9i represents any linear dispersion in the cavity and 3T denotes a small time delay imposed on the pulse due to time varying effects in gain and absorber. One such formal
self consistent solution to this basic cavity equation is the hyperbolic secant function as t described in Section II:
E(t) = Eo sech -eq(1.7) J
^ g
The solution does not immediately yield unique values of pulsewidth, CZ^ but rather | generates a set of interrelated algebraic equations defining ^p, peak intensity IEqI^ and 9T in
terms of the cavity parameters. Investigation of the various conditions necessary to
generate sech^ pulse intensity profiles from initial noise fluctuations lead to a defined ; regime of laser parameters which can only be met in a limited set of laser arrangements.
Indeed experimental fitting of autocorrelation functions for durations of around 100 fs give reasonable agreement to the above envelope function. However, when mode-locked pulses
have durations of less than ~100 fs higher-order dispersion and self-phase modulation | must be included in equation 1.6 and self-consistent envelope functions will not necessarily % be of sech^ form or even symmetrical. This is discussed further in Chapter 9.
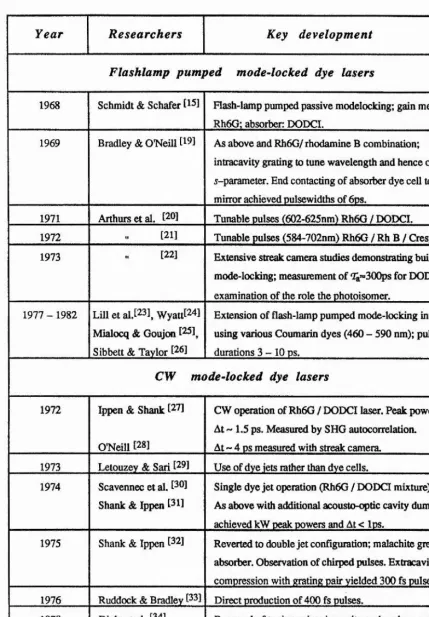
1.5 T h e C P M DYE LASER - AN HISTORICAL OVERVIEW
Table 1.1 Historical summary of passive modelocking in dye lasers
Year Researchers Key developm ent
Flashlamp pumped mode-locked dye lasers
1968 Schmidt & Schafer Flash-lamp pumped passiye modelocking; gain medium; Rh6G: absorber; DODCI.
1969 Bradley & O'Neill F9] As above and Rh6G/rhodamine B combination;
intracavity grating to tune wavelength and hence optimise j-parameter. End contacting of absoiter dye cell to cavity mirror achieved nulsewidths of 6ps.
1971 Arthurs et al. [20] Tunable pulses (602-625nm) Rh6G / DODCI.
1972 [21] Tunable pulses (584-702nm) Rh6G / Rh B / Cresyl violeL
1973 [22] Extensive streak camera studies demonstrating build-up o£
mode-locking; measurement of "Z^=300ps for DODCI and examination of the role the photoisomer.
1977 - 1982 Lill et al.[23]^ Wyatt[24] Mialocq & Goujon [25]^ Sibbett & Taylor [26]
Extension of flash-lamp pumped mode-locking into the blue using various Coumarin dyes (460 - 590 nm); pulse durations 3 - 1 0 ps.
CW mode-locked dye lasers
1972 Ippen & Shank [27]
O'Neill [28]
CW operation of Rh6G / DODCI laser. Peak powers lOOW; At 1.5 ps. Measured by SHG autocorrelation.
At - 4 ps measured with streak camera. 1973 Letouzey & Sari [29] Use of dye jets rather than dye cells. 1974 Scavennec et al. [^®]
Shank & Ippen [3*]
Single dye jet operation (Rh6G / DODCI mixture). As above with additional acousto-optic cavity dumper; achieved kW peak tx>wers and At < lt«.
1975 Shank & Ippen [32] RevCTted to double jet configuration; malachite green absorber. Observation of chirped pulses. Extracavity compression with grating pair yielded 300 fs pulses. 1976 Ruddock & Bradley [33] Direct production of 400 fs pulses.
1978 Diels et al. [34] Removal of tuning prism in cavity and replacement with a multi-layer dielectric reflector gave At ~ 200 fs.
1981 Fork et al. [17] Operation of CPM ring dye laser, first optical pulses <100fs
I
13
[image:26.613.89.519.113.731.2]^ 2
514 nm
Gam dye jet (Rh6G) Argon Ion
pump laser
Absorber dye jet
(DODCI) CPM laser
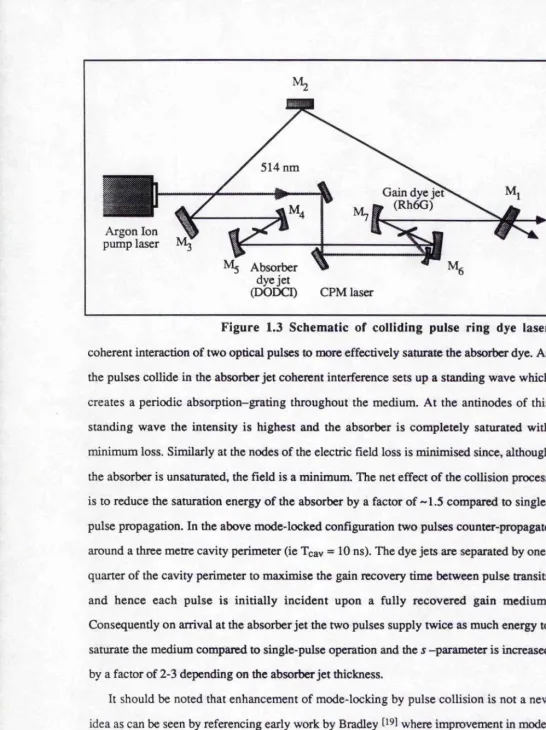
Figure 1.3 Schematic of colliding pulse ring dye laser coherent interaction of two optical pulses to more effectively saturate the absorber dye. As the pulses collide in the absorber jet coherent interference sets up a standing wave which creates a periodic absorption-grating throughout the medium. At the antinodes of this standing wave the intensity is highest and the absorber is completely saturated with minimum loss. Similarly at the nodes of the electric field loss is minimised since, although the absorber is unsaturated, the field is a minimum. The net effect of the collision process is to reduce the saturation energy of the absorber by a factor of ~ 1.5 compared to single pulse propagation. In the above mode-locked configuration two pulses counter-propagate around a three metre cavity perimeter (ie Tcav = 10 ns). The dye jets are separated by one-quarter of the cavity perimeter to maximise the gain recovery time between pulse transits and hence each pulse is initially incident upon a fully recovered gain medium. Consequently on arrival at the absorber jet the two pulses supply twice as much energy to saturate the medium compared to single-pulse operation and the s -parameter is increased by a factor of 2-3 depending on the absorber jet thickness.
It should be noted that enhancement of mode-locking by pulse collision is not a new idea as can be seen by referencing early work by Bradley where improvement in mode-locking performance was observed by the positioning of absorber dye cells close to or in contact with the end mirror of linear flashlamp pumped cavities. The important difference
[image:27.613.4.551.20.751.2]in the CPM case is that two different pulses collide with each other. Detailed analyses made by Stix et al have suggested that the resultant absorption grating acts to synchronise the two pulses and mode-locking is further enhanced by energy transfer processes.
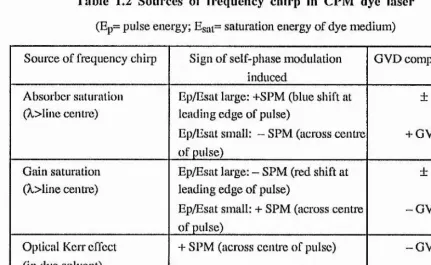
Table 1.2 Sources of frequency chirp in CPM dye laser
(Ep= pulse energy; E<3ai= saturation energy of dye medium)
Source of frequency chirp Sign of self-phase modulation induced
GVD compensation
Absorber saturation
(^>line centre) Ep/Esat huge: +SPM (blue shift at leading edge of pulse) Ep/Esat small: - SPM (across centre of pulse)
±
+ GVD
Gain saturation (A,>line centre)
Ep/Esat huge: - SPM (red shift at leading edge of pulse)
Ep/Esat small: + SPM (across centre of pulse)
±
-GVD
Optical Kerr effect (in dye solvent)
+ SPM (across centre of pulse) -GVD
1.6 DISFKRSION COMPENSATION IN THE CPM LASER
By using the colliding pulse technique it was possible to readily generate pulses around lOOfs. Because of the large spectral bandwidths associated with ultrashort pulses it was soon realised, however, that in order to optimise CPM laser performance it was vital to have some control of intracavity group velocity dispersion, 0" Moreover, since peak intensities in the absorber would typically reach tens of gigawatts/cm^ nonlinear sclf-phase- modulation effects due to the optical Kerr effect in the dye solvent and absorber saturation must be taken into consideration in Table 1.2 the sources of frequency chirp in the CPM dye laser arc summarised together the sign of the resulting SPM. 'I’hc mathematical formalism representing these sources of frequency chirp is dealt with in Section II. Obviously if the pulses have any degree of wavelength variation across their temporal profile then interaction with intracavity GVD will drastically effect the pulseshape, pulse duration and laser stability. Silvestri et al performed a detailed investigation of the
[image:28.612.81.512.178.442.2]contributing factors to the dispersion in the laser cavity and showed that the mirror GVD (typical values ~ ±300fs^) was the dominant source. Various optical systems have been proposed which can act to control and compensate the cavity GVD; these include Gires- Toumois interferometers [3839]^ angle tuning of mirrors and a sequence of Brewster angled prisms The relative merits of each will be discussed in turn.
Low spacer High Reflecting
Stack
Figure 1.4 Schematic of a typical Gires-tournois structure.
1.6.1 G iR ES-TouR N O is I n t e r f e r o m e t e r s
Figure 1.4 shows a shematical representation of a Gires-Toumois interferometer (GTI) structure. This cavity element consists of a highly reflecting surface (dielectric stack or metallic coating) and a spacer layer with usually a secondary protective cover layer on top thus generating a "half-silvered" étalon. The phase changes at each surface and their wavelength dependence allow the GTI to introduce varying degrees of GVD as a function of spacer layer thickness and incident angle. It is often assumed that the dispersive contribution, 0" of this structure can be calculated using basic formulae in which case P8];
d^0 2T2^(l-r^)r sin o/T]
0" = -eq(l.g)
do/2 (1 +r^ - 2r cos luT2)^
where the system is treated as a single layer of reflectivity, r in contact with a single fully reflecting layer with a spacer layer of physical thickness di (yielding a pathlength difference T2=2d2ncos0/c). It is more realistic, however, to extend the treatment to accommodate the top cover layer to yield the complex reflection coefficient
r i + T2 e - î T i + 1-3 e - i ( T i - f T2) + n r 2 r 3
1 + nrz e-iTi + r,:; e'KTi+T^) + r^rs e-iTj Representing this as r = r exp( i0) the phase argument can be extracted to give:
0 = T1-Ç
with:
and
tan^ ri + rr2 sinTi + r] sin(Ti+T2 cosTi + r3 cos(Ti+T2) + r%r2) + r%r2r3 sinT2r3 COST2 2
_ rir2 sinTi + n n sin(Ti+T2) +T2T3 sinT2 ,,
“ 1 + rir2COST I + rirg cos(Ti+T2) + r2rs COST2
Double differentiation of 0 with respect to angular frequency gives the dispersion of the system. Unfortunately, for the structure shown in figure 1.4 the dispersion has a strong wavelength dependence and it can change quite dramatically across the bandwidth of an ultrashort pulse Figure 1.5 shows this variation for the typical wavelengths encountered in the DODCI / Rh6G passively mode-locked laser. Moreover, the above calculation takes no acount of the dispersive contribution from the high reflectivity multi layer stack, if present.
624 628 636 640 644 832
Incident Angle (degrees)
140
-1 4 0
<2 0
o 10"%^ >
(3 2o"Z:
2 S V .^
12S «34 «E Wavelength (nm)
Figure 1.5 Variation in GVD contribution by a GTI component as a function of angle and wavelength.
17
I
I
I
The basic requirements for control of GVD by an intracavity optical component are; (i) low insertion loss, (ii) the ability to vary its linear dispersion contribution from negative to
, i:
positive values, and (iii) equal dispersion contribution across the spectral bandwidth of the "I % pulse. Thin film interferometers that have previously been reported [39/t5] have had a #
Î
structure similar to that shown in figure 1.4 where a spacer layer is deposited on top of a *■' high reflectivity stack. Examination of the GVD contribution of the GTI across a 20 nm ^
'4
bandwidth shows that the structure is far from ideal as a means for controlling linear
*
J dispersion because large amounts of cubic and higher-order terms appear between the
turning points of the GVD curve. It can only provide linear dispersion within a rather
restricted angular regime and for this reason use of GTTs for GVD compensation is fairly 3 limited. Experimental studies of GTTs will be discussed in Chapter 9.
1.6.2 ANGLE TUNING OF MIRRORS
Once the dispersive contribution of cavity mirrors was recognised it is possible by careful mirror design and angle tuning to effect dispersion control and thus optimise laser
performance. Practical difficulties arise as cavity realignment is required each time the | dispersion is changed and this can be tedious in day-to-day operation. Nevertheless
Yamashita et al [40] have demonstrated 45 fs pulses with a CPM laser employing no other cavity components apart from their specially designed mirrors. Similarly French has achieved 50 fs using the cavity depicted in figure 1.3 and angle tuning the apex mirrors. This technique makes use of the property that a mirror designed for reflectivity over a certain bandwidth and at a particular angle will introduce negative GVD if operated at
angles larger than its specification and positive GVD for smaller angles. The calculation of 4 the mirror dispersive contribution requires complex matrix analysis of the multilayer | structure and although the lasing system is simple it is far from flexible.
1.6.3 DISPERSION COMPENSATION USING PRISM PAIRS
The use of prisms for dispersion control inside the mode-locked laser was first reported ; > as early as 1983 by Diels and Dietel [46] who employed a single prism and collimating
mirror in their cavity configuration. They argued that such a system allowed control of the
: |
-V
positive dispersion in the cavity. Soon after coworkers Fork and Gordon demonstrated that the cavity system had additional negative GVD due to angular refraction [47] The proposition that angular refraction at a glass interface gave negative GVD was recognised also by Silvestri et al [48] but use of prism pairs was first proposed and demonstrated by Fork et al in 1984 [4i,42]^ Their configuration is shown in figure 1.6 where each prism is
Figure 1.6 Four prism sequence used to introduce negative GVD
operated at minimum deviation and apex angles are set so that incident angles are at Brewster’s angle to minimise loss. The obvious advantage of this system is that the incident and transmitted beams are colinear and thus it is ideal for introducing negative GVD into existing laser systems. The dispersion contribution of the prism system ignoring any additional material path length is given by [41];
sin P -2 (g .)2 c o sp } Hîqd.ll)
Providing that d^n/dX^ is not excessively large compared with (dn/dX)^ and since p is of the same order as the angular deviation of the incident ray bundle (therefore sinp « cosp), the prism arrangement will give negative dispersion. This negative GVD is offset in practice by the positive GVD contribution of the glass material through which the beam must traverse and consequently the system can provide positive or negative GVD depending on the material path length through the prisms. Taking the lower transit path to lie at twice the beam diameter (in this case C sinp » 2mm) below the prism apex and incorporating typical values at 630 nm for quartz the various derivatives yield the dispersive relation:
19
-4
■I
■t II
I
43
1
0 " = 457.8-3.31 C fs^ -eq(1.12) where fis measured in mm. The above equation implies that setting a prism separation of 250 mm will give a negative GVD sufficient to compensate for 6.6 mm of glass. The inherently low insertion loss and the dispersive tunability of this prism sequence -
dispersion being controlled by the simple translation of a single prism without effecting | cavity alignment - makes this configuration ideal for inclusion in both ring and linear laser
cavities. Also, the higher order dispersion contributions are relatively small and thus the dispersive contribution is mainly linear across large bandwidths.
1.7 Summary
The pertinent theory and historical background of the CPM dye laser has been presented. For control of cavity GVD the prism sequence has shown to be far superior to Gires-Toumois interferometers and mirror angle tuning techniques. Indeed using such a system Valdmanis and Fork have achieved 27 fs duration in a six mirror CPM cavity [42],
This purpose of this chapter was intended to be an introduction to the CPM laser which | was utilised as a ultrashort pulse source in the development of streak camera and SHG
autocorrelation pulse measurement techniques which are discussed in the following sections. In Chapter 9 I will return to the above discussion within the context of the parameterisation and optimisation of the experimental CPM laser.
REFERENCES
1 G.H.C.New, Rep. Prog. Phys. 46 877 (1983).
2 P.W.Smith, M.A.Duguay and E.P.Ippen, Prog. Quant. Electron. 3 107 (1974). 3 A.Yariv in Optical Electronics : publ. Holt, Rinehart and Winston - New York (1985).
4 A.E.Siegman in Lasers : publ. University Science Book - CaHfbmia (1986). | 5 B.H.Soffer and J.W.Linn, J.Appl. Phys. 39 5859 (1968).
6 W.H.Glen, M.J.Breiza and A.J.Demaria, Appl. Phys. Lett. 12 54 (1968).
7 M.C.Adams, D.J.Bradley, W.Sibbett and J.R.Taylor, Phil. Trans. R. Soc. Lond. A298 217 (1980).
20
8 M.Nakazawa, H.Kubota and K.Kurokawa in Ultrafast Phenomena VI : Springer series â in Chem. Phys 48 24 (1988).
9 P.N.Kean, X.Zhu, D.W.Crust, R.S.Grant, N.Langford and W.Sibbett, Opt. Lett. 14 | 39 (1989).
10 RA.Haus, J.Appl. Phys. 46 3049 (1975).
11 H.A.Haus, IEEE J. Quant. Electron. QE-11 736 (1976). 12 G.H.C.New, IEEE J. Quant. Electron. QE-10 115 (1974).
18 R.S.Miranda, G.R.Jacobovitz, C.H.Brito Cruz and A.F.Sarpara, Opt. Lett. 11 224 (1986).
14 W.Rudolph and B.Wilhelmi, Appl. Phys. B 35 37 (1984). 15 W.Schmidt and F.P.Schafer, Phys. Lett. 26A 558 (1974).
16 O.G.Peterson, S.A.Tuccio and B.B.Snavely, Appl. Phys. Lett. 17 245 (1970). 12 R.L.Fork, BI.Greene and C.V.Shank, Appl. Phys. Lett. 38 671 (1981). 18 P.M.W.French, Phd thesis - Imperial College, London (1986).
19 D.J.Bradley, A.J.F.Durrant, F.O'Neill and B.Sutherland, Phys. Lett. 30A 535 (1969).
20 E.G.Arthurs, D.J.Bradley and A.G.Roddie, Appl. Phys. Lett. 19 480 (1971). 21 E.G.Arthurs, D.J.Bradley and A.G.Roddie, Appl. Phys. Lett. 20 125 (1972). 22 E.G.Arthurs, D.J.Bradley and A.G.Roddie, Appl. Phys. Lett. 22 88 (1973). 28 E.Lill, S.Scheider and F.Dorr, Opt. Comm. 20 223 (1977).
24 R.Wyatt, Opt. Comm. 38 64 (1980).
25 J.C.Mialocq and P.Goujou, Opt. Comm. 24 255 (1978). 26 W.Sibbett and J.R.Taylor, Opt. Comm. 43 50 (1982).
22 E.P.Ippen, C.V.Shank and A.Dienes, Appl. Phys. Lett. 21 348 (1972). 28 F.O'Neill, Opt. Comm. 6 360 (1972).
29 J.P.Letouzey and S.O.Sari, Appl. Phys. Lett. 23 311 (1973).
80 A.Scavennec and N.S.Nahman, IEEE J.Quant. Electron, QE-10 95 (1974). 81 C.V.Shank and E.P.Ippen, Appl. Phys. Lett. 24 373 (1974).
21 :
"j
82 C.V.Shank and E.P.Ippen, Appl. Phys. Lett. 26 62 (1975). 83 I.S.Ruddock and D.J.Bradley, Appl. Phys. Lett. 29 296 (1976). 84 J.C.Diels, E.Von Stryland and G.Benedict, Opt. Comm. 25 93 (1978). 85 M.S.Stix and E.P.Ippen, IEEE J.Quantum Electron. QE-19 520 (1983). 86 O.E.Martinez, R.L.Fork and J.P.Gordon, Opt. Lett. 9 156 (1984). 82 S.de Silvestri, P.Laporta and O.Svelto, QE-20 533 (1984).
88 P.M.W.French, G.F.Chen and W.Sibbett, Opt. Comm. 57 263 (1986). 89 J.Kuhl and J.Heppner, Appl. Phys. Lett. 47 453 (1985).
40 M.Yamashita, S.Kaga, K,Torizuka and T.Sato in Ultrafast Phenomena VI : Springer I series in Chem. Phys. 48 37 (1988).
41 R.L.Fork, O.E.Martincz and J.P.Gordon, Opt. Lett. 9 150 (1984). 42 A.Valdmanis and R.L.Fork, IEEE J.Quant. Electron. QE-22 112 (1986).
48 O.S.Heavens in Optical properties of solid thin films : Butterworths Scientific Publ. -London (1955).
44 A.Finch, E.Williams and W.Sibbett, Tech, Dig. XVI Int. Quant. Electron. Conf. (IQEC88) paper MP16 92 (1988).
45 D.Kuhlke, T.Bonkhofer and D.Von Der Linde, Opt. Comm. 59 208 (1986). 46 W.Dietel, J.J.Fontaine and J.C.Diels, Opt. Lett. 8 4 (1983).
42 J.P.Gordon and R.L.Fork, Opt. Lett. 9 153 (1984). 48 S. de. Silvestri (Private communication).
SECTION I
LINEAR PULSE MEASUREMENT
STREAK CAMERAS
-23
%
CHAPTER 2: STREAK CAMERA DESIGN. CO NSTRUCTIO N AND
Q PER ATIQ.N
2 .0 In t r o d u c t i o n
With the ready availability of subpicosecond, indeed femtosecond light pulses, there is a vital need for the development of linear monitoring instruments to accommodate the ultrashort optical pulse regime if such laser sources are to be fuUy understood and exploited. Photodiode technology employing HI-V and II-VI semiconductors has now extended linear electronic diagnostics into the sub-10 picosecond region [il - the measured results of the latter reference were in fact generated on the CPM laser discussed in this thesis. However, since there is as yet no commercially available oscilloscope with
sufficient sampling speed or bandwidth to display the output from such devices, they are f not useable directly as linear monitors of ultrashort events; relying more on the rather
circuitous methods of Fourier harmonic analysis Ifi, electro-optical sampling [2] or cross- correlation techniques P»4],
Ultrahigh speed cameras, on the other hand, based on the principles of electron optical
image tubes, have consistently been at the forefront of linear optical pulse measurement | applications. Recent years have seen the limiting temporal resolution, % of these cameras
improve by over an order of magnitude to the present state of the art of < 300 fs They
have been shown to offer high sensitivity and can provide temporal and spectral | information over time windows of hundreds of picoseconds - as a consequence these
instruments are the mainstay of the developing field of ultrqfast chronoscopy
In the following chapters the important design criteria of these streak tubes are described in respect of their modes of operation and the limitations on their performance. The final chapters of this section are devoted to the development of solid-state readout systems for these cameras (both an external format and an internal system incorporated within the tube envelope) and is referenced to a specific spacebome laser ranging application.
2.1 Im a g e t u b e d e s i g n a n d o p e r a t i o n 2.1.1 Co n s t r u c t i o n
There is a wide variety of picosecond image tube designs currently available but all operate on the same basic principle. Figure 2.1 illustrates the two modes of operation of these instruments namely that of streak mode and framing mode. Figure 2.1a demonstrates the operation of a streak camera which records ultrashort events in time and one spatial direction (along the length of the input slit), while figure 2.1b demonstrates the application of a framing camera M which can record one or more snapshots of very short duration events (~100ps) with two spatial dimensions.
I
Slit Photocathode Phosphor
"Optical events"
Deflector plates
Lens Electrostatic lens
:
Photocathode
Figure 2.1a: Schematic of a Streak Camera
Phosphor
Fusion Deflector
plates
Electrostatic lens Compensatingplates
Figure 2.1b: Schematic of a Framing Camera
Both types of tube consist of a photocathode (with a spectral response tailored to the operating wavelengths of the mode-locked lasers or ultrashort events that are to be
analysed), a electrostatic leasing section, a deflection region in which deflector plates of differing design and number are enclosed, a drift region and finally an image recording section which sometimes includes a proximity focused microchannel plate (MCP) intensifier in front of a phosphor if high detection sensitivity is required. The outer tube envelope is constructed from glass or ceramic with Nilo flanges sectioning the different tube regions. High vacuum is imperative for avoiding internal discharge, so-called muMpactor discharge during dynamic operation and maintenance of photocathode life.
$
2.1.2 Dy n a m i c o p e r a t i o n o f i m a g e t u b e s
The mechanism whereby a streak camera works is basically quite straightforward
(complicated theoretical analyses are, however, necessary to describe the details of the .! streaking process). Light incident at an input slit is focused onto the photocathode causing
the liberation of photoelectrons which are accelerated down the tube. The electrostatic lens
arrangement modulates the electron momenta such that all electron trajectories see an equal 4 time of flight (an analogy with Fermat's Principle which will be discussed later) and are
imaged under static operation at the phosphor screen where the image information is converted back to optical data. The electron-optical image tube is designed to have good leasing characteristics in static mode with high spatial resolution and minimal distortion of image information.
In streak mode as the electrons pass through the deflector plates a voltage ramp is ^ applied which deflects or streaks the electrons along a direction perpendicular to the input
slit length. If we imagine a short optical event, ie) an optical pulse incident on the camera,
then this will generate at the photocathode a distribution of electrons whose number density < along the axis of the tube is linearly proportional to the intensity distribution across the
optical pulse. On streaking at the deflection plates the electron distribution is mapped out spatially on the phosphor, in other words one spatial axis of the image tube has been converted into a temporal axis. The light emanating from the phosphor will be linearly
proportional to the incident electron number density and consequently recording the I intensity of light across the phosphor as a function of distance thus provides a linear record j
§
27
;■ i_i_____■ i - ' - S L i - s ' . • _ C Vi';- 'I;*- tlJ.' w.ai- ».
I
of the input light pulse intensity distribution. Spatial information along the length of the slitis maintained thereby allowing the measurement of one dimensional events (eg. the spectral fluorescence decay from a dye molecule after excitation from an ultrashort light pulse t^l).
For framing cameras a second set (or sets) of deflector plates is present in the deflection
region to which the same voltage ramp is applied but of the opposite polarity to that | generated on the the first pair of plates. This acts to compensate for the streaking effect
from the primary deflectors and effectively freeze the image presented at the photocathode.
This provides two-dimensional information with a frame time determined by ramp speeds g and aperture sizes in front of the secondary compensating plates. The design and operation <
;.î of framing cameras is offering wide interest in the monitoring of events such as the
examination of deuterium-tritium target spheres during laser induced fusion but a full ; I treatment of this area of research is beyond the scope of this section which is devoted
purely to the use of streak cameras.
2.1.3 SINGLE-SHOT OPERATION
As mentioned above the streak image is produced by a ramp voltage applied to the deflection plates. When a single ramp voltage is applied the tube is said to be operating in single-shot mode whereby single events are temporally isolated on the phosphor. Employing intensifier stages either internally or externally allows discrimination of light
pulses of energies in the picqjoule regime. Such operation ensures that the tube offers its | optimum temporal resolution as current densities inside the tube are limited (see §2.2). The
voltage ramps that are required to be applied are of several kilovolts switched in a few nanoseconds thereby generating near light speed writing speeds at the phosphor. For picosecond or better temporal resolutions the time window at the phophor screen can be less than 2(X)ps and consequently any jitter between deflection ramp and streaked event will cause the streaked image position to vary from shot-to-shot. Avoidance of jitter precludes many ramp generating sources, avalanche transistor chains (jitter - lOOps) or optical switching of GaAs Auston switches holding off D.C. kilovolt potentials (jitter as low
us ±2|)s l‘^l) being tlic most suitable. Tlie latter voltage ramp source has the disadvantage that it requires high energy optical pulses of lO-KX) |iJ for effective low jitter switching.
2 .1 .4 Sy n c hRo s c A N o p e r a t i o n
Although single-shot streak operation has many applications in the field of pulsed mode-locked lasers diagnostics and associated picosecond pulsed experiments, with the advent of CW mode-locked laser sources and their application to time-dornain spectroscopy, this mode of streaking is not the most appropriate. Thus to exploit the repetitive nature of the pulse trains obtained from CW mode-locked sources an alternative streak mode was developed which was termed synchroscan streak operation. In this mode the single fast voltage ramp is replaced by a repetitive linear deflection waveform. Usually in practice this drive waveform is a high frequency (eg 200 MHz) sinusoid where advantage is taken of the fact that the central sixth of one period of the sinusoid is linear to within 5% (see figure 2.2).
E E zo E <0 g id
S
DC I -0Î JO 2010 -0 -10
--20
-3 0 ■
-40
-STREAK VELOCITY = 6 . 5 X 10® c m / s
âCRËËN DIAMETER i% _L 5% 500 -500 0
TIME (ps)
Figure 2.2 Linearity curve of a 200 MHz sinusoid The f requency of the waveform is chosen to be identical or an exact harmonic of that of the repetitive laser initiated photoluminescent event being monitored (see figure 2.3). By tills means a large number of streak images arc overwritten on the phosphor screen providing effective signal gain.
%
Linear Region
Sinusoidal Deflection Voltage
Synchronous Excitation Pulses
Resulting Photoluminescent Signal Time
Figure 2.3 Synchroscan operation
Synchroscan operation has several immediate advantages including: (i) compatibility with repetitive pulse sources such as all CW mode-locked lasers, (ii) inherent signal gain and thus no requirement, in most cases, for image intensification, (iii) signal averaging and as a consequence large signal-to-noise, high sensitivity and dynamic range, (iv) low photocurrent values and therefore optimal camera resolution, and (v) effective realtime monitoring of repetitive events which are conveniently readout by one- or two-dimensional optical multichannel analysers which can be either photoelectronic or photoconductive based.
The prerequisite of low jitter between the sinusoidal deflection signal and the optical events being monitored is further compounded by the need for low jitter in the pulse train itself. However with recently enhanced low phase noise CW pulse sources operating at various wavelengths picosecond resolution is now readily attainable. Several methods have been developed for synchroscan deflection voltage generation, two of which are discussed and experimentally compared in Chapters 3 and 4.
2.2 St r e a k Tu b e s
2.2.1 Pe r f o r m a n c e c r i t e r i a a n d d e f i n i t i o n s
The criteria used to describe the performance of streak cameras are based upon a number of specific parameters. The property most often measured is the temporal impulse response^ % ie) the temporal resolution (FWHM) obtained at the phosphor of the streak tube when an infinitely short optical pulse is incident. Physically this represents the minimum duration of temporal event (FWHM) that could be resolved at the phosphor. One basic tube property that the temporal resolution depends upon is the static resolution of the camera (often quoted in line pairs per millimetre -Ip/mm) which effectively defines the minimium spatial (and therefore temporal) extent of the streak, As that can be displayed on the phosphor. Conversely the dynamic spatial resolution is a measure of the detail that can be resolved perpendicular to the streak direction ie) the amount of resolvable spectral information, say, that can be displayed during streak operation. Parameters which define the degradation of imaging or temporal performance include spatial distortion which defines the variation in magnification (image to object height ratio) as a function of position in the image and temporal distortion which describes the variation of the mean time of flight of the electron pulse from the photocathode to the phosphor as a function of object position. This latter property manifests itself most clearly with a so-called dynamic slit curvature in the streaked image (see figure 2.4).
Streak direction <
---. i : i ‘
! " - h M
Figure 2.4 Example of dynamic slit curvature
An important performance criterion for a streak tube defining its usefulness is its dynamic range which describes the useful input intensity range before deterioration in temporal resolution becomes too large. There are several definitions, a reasonable one being the ratio of the peak pulse intensity for which the measured temporal width is 20% greater than the actual width of the incident pulse to background or the noise intensity level
of the recording medium. One origin of this limitation to temporal performance is the space 4 charge effect 0^1 whereby the close proximity of electrons as they travel in the streak tube
yield appreciable Coulomb repulsive interactions which tend to spatially broaden the charge
packet and thus temporally broaden the streaked image. A second cause has been ascribed i
to the degradation of spatial resolution due to microlensing effects occurring at the photocathode During intense irradiation the large localised photocurrent drawn from
the photocathode leads to a surface potential peturbation and a defocussing effect of the | tube elctrostatic lens and subsequent loss in temporal resolution. This effect can be offset
by the provision of adequate intensification, thereby keeping photocurrents low, and the
manufacture of low resistivity (10 O/square) photocathodes so that any voltage :| perturbations are minimised.
2.2.2 Fu n d a m e n t a l l i m i t a t i o n s
For operation in the visible spectrum with pulses containing central optical carriers of ~10 3 THz the absolute fundamental limit on % is around 10 fs and is dictated by the ultimate photocathode response time. Although streak camera designs presently exist with calculated resolutions of less than 100 fs measured performances are significantly poorer than this ultimate figure. There are several valid physical and practical reasons why this is so but the main factor governing achievable resolution is the nature of photoelectron emission from a photocathode. A minimum energy, the work function, ^ of the photocathode material, is required to liberate electrons from the photocathode into the external vacuum. Consequently for incident light with photon energy, hr^ < <j) no photoelectrons can be emitted leading to a long-wavelength cutoff, Ac given by: Ac = hc/(j). For hv >(j) the emitted electrons are not monoenergetic due to the electron-hole generation
31 i
mechanism and scattering processes in the lattice This distribution of initial energies between zero and ht/- <|) naturally gives a distribution of times of flight for the electrons from photocathode to phosphor independent to the incident optical pulse, this is generally referred to as the transit-time dispersion. It is this photoelectron energy distribution (typically ~ 600 meV for multi-alkali photocathodes) which in practice will define the fundamental limiting temporal resolution of all streak tubes.
This problem can be reduced by increasing the electric field close to the photocathode to I a high value (>20kV cm~l) thereby accelerating the photoelectrons to high energies over a
very short period and making insignificant their initial energies For a cathode field Epc the transit time spread, At^ of an image tube is commonly expressed as
Atd = ^q(2.1)
where m and e are the electronic mass and charge respectively and Au is the half width of
the initial electron velocity distribution. This expression although valid for tubes exhibiting | resolutions of several picoseconds is not an adequate description for 01- < Ips In
practical systems a large value of Epc is achieved by the insertion of a fine mesh in close proximity (-1-2 mm) to the cathode and which is held at a high positive voltage with respect to it The maximum value of this electric field near the photocathode is usually limited by the maximum voltage the cathode or mesh surfaces can hold off before field emission occurs and is dependent on surface quality. The improvement in temporal performance is offset slightly by the obvious loss in signal electrons (-50%) and the reduction in image quality due to microlensing by the mesh apertures.
A second factor which ultimately limits the achievable temporal resolution is the finite 4 time taken for the electrons to leave the photocathode. This delay will depend on the initial % electron energy, the cathode thickness, composition and structure. There is no firm
evidence for the extent of a distribution in emission times and opinions differ as to the ; importance and degree of this effect, but an analysis by Bulygin t22] by modelling a typical
S1 type silver-ceasium-oxygen cathode put a limiting figure for % at -50 fs due to emission time distribution. Experimental evidence [20,31] showing the dependency of on