Introduction
There is a paucity of information on inpatient paediatric units in Sub Saharan Africa and there tends only to be literature from larger countries such as South Africa. The aim of this paper is to give an overview of the re- ferral patterns, main diagnoses, management, and influ- ences on outcomes during a six month period in the paediatric referral centre in Lesotho.
Setting
There is one referral centre for paediatrics in Lesotho based in Queen Elizabeth II hospital in Maseru. This is a 42 bed unit and includes a five bed high dependency area. There are also 8 isolation cubicles. There is one consultant paediatrician plus one paediatrician rotating from Baylor College of Medicine and either four or five medical officers and interns. There are five permanent nursing staff and the remainder of the nursing staff ro- tate through the ward.
Aims and objectives
To look at the referral patterns, diagnoses, management provided, and factors influencing outcomes in the pae- diatric referral centre in Lesotho.
Methods
Data on each admission is routinely collected on dis- charge or death. This includes HIV status of the mother and the child, nutritional status on admission, length of stay, management given and final diagnosis at discharge or death.
Results
[image:1.612.340.566.369.511.2]Between January and June 2008 there was data col- lected on 849 admissions. Most referrals came from paediatric outpatients or casualty, see Table 1. 58% are male and 42% female. The median age of admission is 14 months and the mean age is 28 months.
Table 1 Source of referrals to paediatric ward in QEII
Referral patterns, diagnoses, management and outcome in a paediatric
ward in Lesotho
2¶+DUH%$2ODGR\LQER$3KLUL*
(1) Department of Paediatrics, QEII Hospital, Maseru, Lesotho
(2) Department of Paediatrics, University Hospital of Wales, Cardiff
0 5 10 15 20 25
>med ian
media n
media
n/-1 -1SD
-1SD
/-2SD -2SD -2SD
/-3SD -3SD -3SD
/-4SD -4SD <-4SD
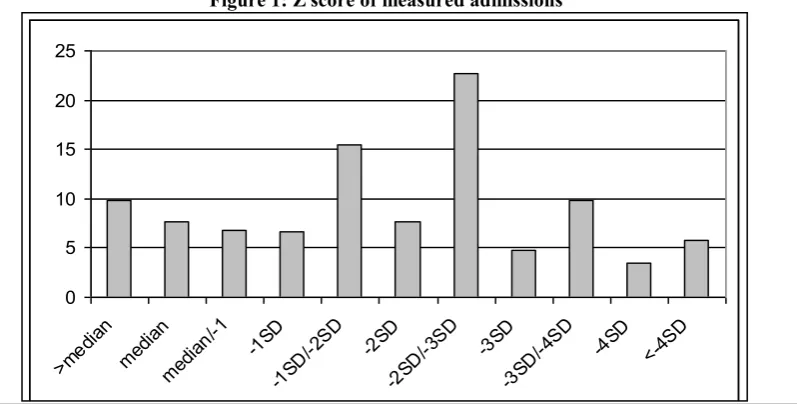
Figure 1: Z score of measured admissions
Referred from Percentage of total
POPD 29.6%
Casualty 20.6%
Baylor 12.7%
Outside Hospital 6.6% Paediatric HIV clinic 1.1%
Other/not stated 29.4%
[image:1.612.112.511.540.742.2]Malnutrition
Measurements were available for 514 children but 39% of children did not have their weight for length calcu- lated. 15% of those children who did have their weight and length measured and Z score calculated were less than or equal to the median. The remaining 85% had some degree of malnutrition. 19% of those children who had their weight for height measured were very severely malnourished with a weight for height <-3SD below median. (See Figure 1.)
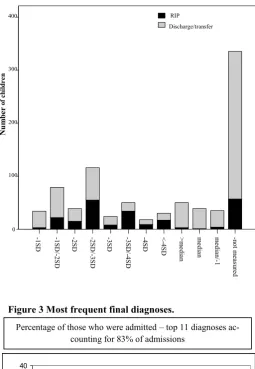
The outcome was poorer for children with moderate and severe malnutrition see Figure 2.
Final diagnosis
The most common final diagnoses during this winter period was gastroenteritis, followed by pneumonia and malnutrition, where malnutrition was the reason for ad- mission, as opposed to a secondary finding after admis- sion. (See Figure 3)
HIV status
Of the 416 mothers whose HIV status was definitely
WHVWHGDQGUHFRUGHGLQWKHFKLOG¶VKRVSLWDOQRWHVRU
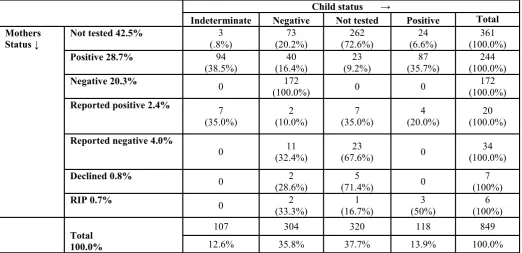
58.6% of the total tested were HIV positive, 172 or 41.4% of the total tested were negative. 42.5% of the mothers were not tested during the admission, see Table
,QFDVHVWKHPRWKHU¶VVWDWXVZDVQRWWHVWHGDQGWKH
reported status was accepted.
[image:2.612.41.297.231.601.2]The status of the children of the mothers in these differ- ent groups is summarised in Table 3. 107 children were designated to be indeterminate at discharge/death. This group of children are exposed children, aged less than 18 months, whose result of their DNA PCR is pending.
Table 4 summarises the outcome of the children accord- ing to their HIV status.
Treatment in the ward
170 children or 20% of all admissions received oxygen during their admission. 48 children or 4.1% of all ad- missions received a blood transfusion. 13 children or 1.5% of all admissions had their blood glucose re- corded. Only 3 children or 0.4% of children had blood cultured. 82 or 9.6 % of all admissions required a lum- bar puncture.
16 children or 1.9% received a bolus of dextrose. 184 or 21.6% of admissions received a fluid bolus and 236 or 27.8% received maintenance intravenous fluids. Only 59 or 6.9% of admissions did not receive antibiotics. 25.6% received a third generation cephalosporin with a further 10% starting on a narrower spectrum regime but moved onto a third generation cephalosporin due to 0 5 10 15 20 25 30 35 40 Haem ophi lia Pres umed PC P Meni ngitis
No d iagn
osis PTB Over
dose Epile
psy
Febr ile c
onvu lsion
Maln utrit ion Pneu mon ia GE/d ehyd ratio n
Figure 3 Most frequent final diagnoses.
Percentage of those who were admitted ± top 11 diagnoses ac- counting for 83% of admissions
Figure 2: Outcome of children according to degree of
0
100
200
300
400
-1S D -2S D -3S D -4S D
RIP
Discharge/transfer
[image:2.612.42.297.543.741.2]clinical failure. 32% received treatment for malnutri- tion although only 11% were admitted because of malnutrition. During this 6 month period, 65 children started TB treatment while inpatients, 22 children were already on TB treatment on admission and 6 children had previously been treated for TB, this ac- counted 10.8% of all admissions.
Children requiring oxygen were much more likely to have a poor outcome, see Figure 4
Length of stay
Information on the length of stay was available on 824 admissions. The minimum stay was less than one day and the maximum stay 46 days. The average duration of admission was 7 days;; the median duration was 5 days.
Childs status Outcome
Death Discharge
Positive 118 (13.9%) 36 (30.5%) 82 (69.5%)
Negative 304 (35.8%) 43 (14.1%) 261 (85.9%)
Indeterminate 107 (12.6%) 30 (28%) 77 (72%)
Not tested 320 (37.9%) 119 (37.2%) 201 (62.8%)
[image:3.612.45.289.83.253.2]Total admissions 849 (100%) 228 (26.9%) 621 (73.1%)
Table 4 Child final status and outcome
&KLOGVWDWXVĺ
Indeterminate Negative Not tested Positive Total
Mothers
Status Ļ Not tested 42.5% (.8%) 3 (20.2%) 73 (72.6%) 262 (6.6%) 24 (100.0%) 361
Positive 28.7% 94
(38.5%) (16.4%) 40 (9.2%) 23 (35.7%) 87 (100.0%) 244
Negative 20.3% 0 172
(100.0%) 0 0 (100.0%) 172
Reported positive 2.4% 7 (35.0%)
2 (10.0%)
7 (35.0%)
4 (20.0%)
20 (100.0%)
Reported negative 4.0%
0 (32.4%) 11 (67.6%) 23 0 (100.0%) 34
Declined 0.8% 0 2
(28.6%) (71.4%) 5 0 (100%) 7
RIP 0.7% 0 2
(33.3%) (16.7%) 1 (50%) 3 (100%) 6
Total
100.0%
107 304 320 118 849
12.6% 35.8% 37.7% 13.9% 100.0%
Table 3 Mothers status and status of their children. Mothers status Numbers Percentage of total
Not tested 361 42.5%
Positive 244 28.7%
Negative 172 20.3%
Reported positive 20 2.4%
Reported negative 34 4.0%
Declined 7 0.8%
RIP 6 0.7%
Total 849 100.0%
[image:3.612.45.568.310.563.2]The average length of stay if the outcome was death was 4.33 days, the average length of stay if the outcome was discharge was 7.65 days, see Figure 5. This differ- ence is significant (p <0.05). 75%, of children whose length of stay was less than one day were not tested for HIV and 68% of those whose stay was <1day passed away often as they presented critically ill.
70% of the mothers of children whose length of stay was less than one day were not tested for HIV. The longer the child remained in hospital, the more likely that both the mothers and the child was tested, see Fig- ure 6.
DISCUSSION
Referral pattern
The majority of patients are referred from departments within the hospital. The next large group is from Baylor. A relatively small proportion, given that this is a referral centre and there are no paediatricians in the public system outside Maseru, come from outside hos-
pitals. Reasons for this may be that when families real- ise their child is unwell they relocate to Maseru and use the local address. Other reasons may include the net- work of Baylor paediatricians visiting district hospitals around the country. Other possibilities include financial implications of travel between hospitals or a perception that coming to the referral hospital will not benefit the child. Frequently when children are referred it is very late in the natural history of their condition, making successful intervention less likely.
Malnutrition
During this six month period almost 40% of children did not have their length measures, thus making a weight for height calculation and the detection of mal- nutrition difficult. Length is generally done on admis- sion and reasons for this are multifactorial but may in- clude blurred lines of responsibility.
not requiring oxygen requiring oxygen
Oxygen
0 100 200 300 400 500 600 700
Number of patients
RIP
RIP
[image:4.612.47.568.398.746.2]Discharge/transfer
Figure 4 Outcome of children requiring oxygen
0 2 4 6 8 10 12 14 16 18 20 22 24 26 28 30 34 46
Length of stay
0 10 20 30 40 50 60 70
Number of patients
Outcome
RIP
Discharge/transfer Figure 5 Length of stay before discharge or death
RIP
Discharge/transfer
RIP
Final Diagnosis
During these six months which included a summer where the incidence of gastroenteritis was extremely high it is no surprise that gastroenteritis is the most fre- quent reason for admission. 288 children were admitted with gastroenteritis, most of these in January and Febru- ary. Children with severe dehydration, particularly if malnourished, which 85% of this group were, require intensive nursing care. This includes the monitoring of intravenous fluids and vital signs and responding to these. Poor nurse to patient ratios, little ongoing profes- sional development, low morale plus no designated ar- eas of responsibility and minimal monitoring combine to make the outlook for this group of patients poor. This is exacerbated by the absence of non invasive monitoring such as saturation monitors for the sickest children and lack of infusion pumps making nursing care more onerous. This set of circumstances is com- pounded by a high turnover of junior doctors, many un- familiar with paediatric management protocols.
HIV status
361 or 42.5% of the mothers were not tested during the admission, and 72.6% of their children were not tested. Of those mothers who were tested almost 60% are HIV positive. The overall HIV prevalence in the country is 23% (1), indicating that children who are unwell, are more likely to be children of seropositive mothers. Only 16.4% of the offspring of the positive mothers were definitely negative, 38.5% indeterminate and 35.7% were definitely positive.
The mortality among children of mothers who are HIV negative is much lower than that of seropositive moth- ers, 18% compared to 33.6% of children of positive mothers. Of the 361 women who were not tested, 27.7% of their children died. High mortality among children of untested mother and child pairs may have been because their children were very sick and died before testing. The mortality among negative children is higher if mother is HIV positive (25%) than among negative children whose mother is HIV negative (14%). This is a well recognised trend (2;;3).
During the six months reported here mothers and chil- dren attended a paediatric HIV clinic, on site but off the ward for their test. Frequently several trips would be required before testing was carried out. That 23 children of known positive mothers were not tested is a reflec- tion of this difficulty. This is compounded by non Seso- tho speaking junior staff, working without interpreters.
The cumulative mortality among HIV infected infants has been reported as 35.2% at 12 months and 52.6% at 24 months. We therefore expect a high mortality among infants with a median age of 14 months who are HIV infected and who have been admitted to hospital.
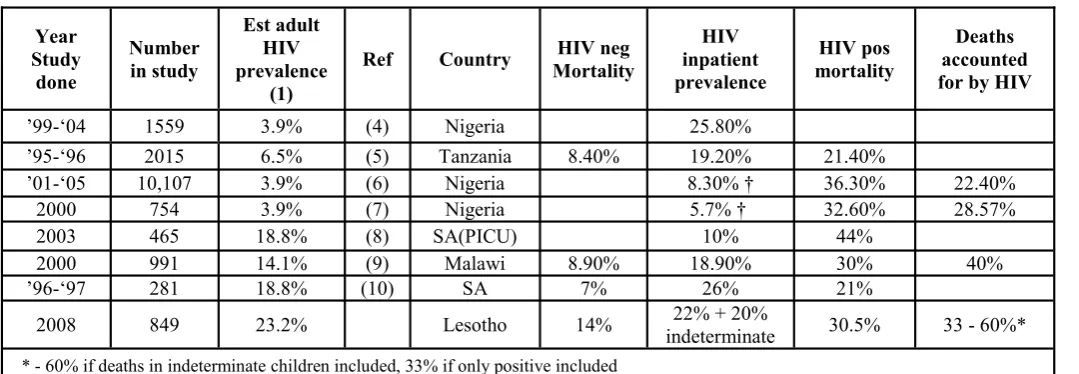
Among HIV positive and indeterminate children the inpatient mortality was 30.5% and 28% respectively. This may indicate that many of the indeterminate chil- dren admitted to hospital will eventually be determined to be HIV positive. The mortality among children who were not tested is very high at 37.2%. This is probably due to the child dying before testing and being too sick prior to their death to go for testing which would have meant being off oxygen. Our mortality among HIV positive children is similar to other units which have published their outcomes, see Table 5, and as expected lower than that found in paediatric intensive care units.
0 2 4 6 8 10 12 14 16 18 20 22 24 26 28 30 34 46
Length of stay 0
20 40 60 80 100
[image:5.612.319.567.50.309.2]Number of admissions
Figure 6 Mothers HIV test status and length of stay
Red = positive
Black = not tested
Treatment in the ward
20% of all admissions required oxygen at some stage of their admission. This is a reflection of the many admis- sions of HIV positive infants with PJP pneumonia. This can cause problems in terms of supply. Concentrators have been donated and electricity is consistent but poor maintenance results in these frequently malfunctioning. A weak procurement system means there are often no single-use tubing available and tubing is recycled but not sterilised with all the implications for nosocomial infection. The advantage of oxygen concentrators is that they can largely be monitored by mothers. However concentrators can only supply 1-5 litres of oxygen per minute which is further reduced when divided between several patients. When severely hypoxic patients require high concentration oxygen, several difficulties are posed. An oxygen tank must be changed when empty. A regulator to release and control the oxygen delivered is required. Tubing, either single use or sterilised after use is required;; all of these factors are challenging.
Only 1.5% of patients had their blood glucose tested despite 1/3 of patients been treated for malnutrition and the WHO guidelines for the management of malnutri- tion suggest checking blood glucose. Less than 2% of patients received a glucose infusion which is probably not a reflection of the number of children who had low sugars but rather a reflection of there being no glucono- meter. Subsequent to this data being available, an in- ventory system was set up and the gluconometer and blood glucose recordings are freely available on the ward.
Only three children out of 849 children admitted had a blood culture drawn. This is despite the fact that 93% of patients were treated for an infection. The automated blood culture machine was not functioning during this time and blood culture bottles were unavailable. The impact of this is that there is no information on which organisms are causing illness or which antibiotics the causative organisms are sensitive to. The natural in- stinct, when faced with a critically ill, immunocompro- mised child is to use the broadest spectrum available and thus resistance is promoted. The chances of resis-
tant organisms causing nosocomial infection is com- pounded by lack of infection control measures such as sterilizing cots and equipment between patients. Clean- ing is carried out by nursing assistants or ward atten- dants but this is not routine due to lack of sterilizing agents.
Almost one third of all admissions required a bolus of fluid and/or maintenance fluids. IV cannulas and fluids are freely available for all patients. This is unlike many African countries, where parents of severely dehydrated children have to go and buy the equipment before their child can be resuscitated. However the monitoring of intravenous fluids is challenging which results in medi- cal staff opting for the oral or nasogastric route which the mother can monitor.
10% of admissions were either started on TB treatment or were already on TB treatment on admission. Very young children do not transmit TB as they do not ex- pectorate but rather swallow sputum;; however older children or adult carers, if infected and coughing can transmit to other patients and healthcare workers. Due to this concern an isolation policy has been introduced.
Length of stay
Missing the opportunity to test mothers and children who died early in their admission is a reflection of the fact that we did not have an in house counsellor. As this group is the sickest it is crucial to test them and their mothers. The longer the child remained in hospital the more likely that the child and mother was tested. We now test all children on admission.
Benchmarking with other units
1. Our mortality among HIV positive patients is simi- lar or better than other units. Our mortality among HIV negative patients is higher than published data from other units.
2. There are several possible reasons for this. These are
ferred to intensive care as happens in South Af- rica.
This data includes well and malnourished chil- dren, and outcome for malnourished children is known to be poorer than for well nourished chil- dren and 85% of our admissions have some de- gree of malnutrition.
Due to the high prevalence of HIV in Lesotho, many of our negative children are HIV exposed. It is well reported that children of positive moth- ers are known to have a higher mortality even if the child is negative (2;;3).
Limitations in terms of nursing, high turnover of junior staff and a weak procurement system. Units with high mortality rates do not report their outcomes.
In conclusion
The vast majority of our admissions have some degree of malnutrition and improving the nutritional status of children is a priority, if the aim is to reduce child mor- tality. HIV status also has a huge impact on inpatient
paediatric mortality, much higher than other countries. This is a reflection of the high prevalence in Lesotho. The opportunity of testing children and their mothers when they are admitted to hospital in a country with a high prevalence should not be missed. The reasons for testing include improving the outlook for the mother which will improve the outlook for the family who de- pend on her as well as to reduce the transmission to fu- ture children. There is an increased risk of death in children whose mother dies from HIV (13), thus taking the opportunity to check the mothers CD4 count and encouraging them to access treatment should reduce child mortality. Testing should also be done early in the admission, ideally on admission so that mothers of chil- dren who die shortly after admission also receive coun- selling and testing. Funding has been secured for a full time counsellor to be based on the ward in order to offer all mothers and children HIV testing and to check all
SRVLWLYH PRWKHUV¶ &' FRXQW LI WKH\ KDYH QRW KDG WKLV
recently checked or if not already enrolled on a treat- ment programme. The testing of other children and partners is also promoted.
Year
Study done
Number in study
Est adult
HIV prevalence
(1)
Ref Country MortalityHIV neg inpatientHIV
prevalence
HIV pos mortality
Deaths accounted for by HIV
¶-µ 1559 3.9% (4) Nigeria 25.80%
¶-µ 2015 6.5% (5) Tanzania 8.40% 19.20% 21.40%
¶-µ 10,107 3.9% (6) Nigeria 36.30% 22.40%
2000 754 3.9% (7) Nigeria 32.60% 28.57%
2003 465 18.8% (8) SA(PICU) 10% 44%
2000 991 14.1% (9) Malawi 8.90% 18.90% 30% 40%
¶-µ 281 18.8% (10) SA 7% 26% 21%
2008 849 23.2% Lesotho 14% indeterminate 22% + 20% 30.5% 33 - 60%* * - 60% if deaths in indeterminate children included, 33% if only positive included
[image:7.612.43.583.464.651.2]- Children only screened if met WHO criteria for HIV PICU ± results from a paediatric intensive care unit
Reference List
(1) UNICEF. Statistics and monitoring. UNICEF 2008Available from: URL: http://www.unicef.org/ statistics
(2) Crampin AC, Floyd S, Glynn JR, Madise N, Nyondo A, Khondowe MM, et al. The long-term impact of HIV and orphanhood on the mortality and physical well-being of children in rural Malawi. AIDS 2003 Feb 14;;17(3):389-97.
(3) Zaba B, Whitworth J, Marston M, Nakiyingi J, Ru- berantwari A, Urassa M, et al. HIV and mortality of mothers and children: evidence from cohort studies in Uganda, Tanzania, and Malawi. Epidemiology 2005 May;;16(3):275-80.
(4) Alikor DE, Erhabor NO. Trend of HIV- seropositivity among children in a tertiary health institu- tion in the Niger Delta Region of Nigeria. Afr J Health Sci 2006 Jan;;13(1-2):80-5.
(5) Kawo G, Karlsson K, Lyamuya E, Kalokola F, Fa- taki M, Kazimoto T, et al. Prevalence of HIV type 1 infection, associated clinical features and mortality
among hospitalized children in Dar es Salaam, Tanza- nia. Scand J Infect Dis 2000;;32(4):357-63.
(6) Onankpa B, Airede L, Paul I, Dorcas I. Pattern of pediatric HIV/AIDS: a five-year experience in a tertiary hospital. J Natl Med Assoc 2008 Jul;;100(7):821-5.
(7) Oniyangi O, Awani B, Iregbu KC. The pattern of paediatric HIV/AIDS as seen at the National Hospital Abuja Nigeria. Niger J Clin Pract 2006 Dec;;9(2):153-8.
(8) Rabie H, de BA, van den BS, Cotton MF, Kling S, Goussard P. Children with human immunodeficiency virus infection admitted to a paediatric intensive care unit in South Africa. J Trop Pediatr 2007 Aug;;53(4):270 -3.
(9) Rogerson SR, Gladstone M, Callaghan M, Erhart L, Rogerson SJ, Borgstein E, et al. HIV infection among paediatric in-patients in Blantyre, Malawi. Trans R Soc Trop Med Hyg 2004 Sep;;98(9):544-52.
(10) Yeung S, Wilkinson D, Escott S, Gilks CF. Paedi- atric HIV infection in a rural South African district hos- pital. J Trop Pediatr 2000 Apr;;46(2):107-10.