Expression of the polycomb group gene Bmi1 does
not affect the prognosis of pediatric acute
lymphoblastic leukemia
Teruyuki Kajiume*, Nobutsune Ishikawa, Norioki Ohno, Yasuhiko Sera, Syuhei Karakawa, Masao Kobayashi
Department of Pediatrics, Graduate School of Biomedical Sciences, Hiroshima University, Hiroshima, Japan;
*Corresponding Author: [email protected]
Received 23 December 2011; revised 20 January 2012; accepted 29 February 2012
ABSTRACT
The Polycomb group protein Bmi1 is a con- stituent of the Polycomb repressive complex 1, and it is an important molecule for the regulation of the self-renewal of hematopoietic stem cells. In the field of clinical hematology, there are reports that the level of Bmi1 expression in blast cells is related to the prognosis of acute myeloid leukemia, chronic myeloid leukemia, and myelo- dysplastic syndrome. We investigated whether the level of Bmi1 expression in leukemic cells is related to the prognosis and the characteristics of childhood acute lymphoblastic leukemia. In all the leukemic blast cells, Bmi1 gene expre- ssion was lower value than that in normal B cells. There were no correlations between the level of Bmi1 gene expression in leukemic blast cells and other parameters, including prognosis. Here, we report that the level of Bmi1 expression in blast cells is not related to the prognosis of pediatric acute lymphoblastic leukemia.
Keywords:Acute Lymphoblastic Leukemia; Leukemic Stem Cell; Bmi1; Polycomb
1. INTRODUCTION
Mammalian Polycomb group (PcG) protein complexes can be classified into 2 distinct types, Polycomb repress- sive complex 1 (PRC1) and PRC2. The PcG protein
Bmi1 is a constituent of PRC1 [1-5]. Bmi1 is an impor-
tant molecule for the self-renewal of hematopoietic stem cells (HSCs). The expression of Bmi1 is generally high in
HSCs but decreases after these cells differentiate [6,7]. Some reports in the field of clinical hematology have shown that the expression level of Bmi1 in blast cells of
acute myeloid leukemia (AML), chronic myeloid leuke- mia (CML), and myelodysplastic syndrome (MDS) can
be related to the prognosis of the disease [8-10]. Accord- ing to these reports, leukemia cells that have a high Bmi1
expression are correlated with poor prognosis. Cancer stem cells in AML were identified for the first time in 1997. In that study, CD38–/CD34+ cells together with leukemic cells were injected into non-obese diabetic mice with severe combined immunodeficiency disease, and the injected mice developed AML [11]. Subsequently, stem cells of breast cancer, brain tumor, prostate cancer, colon cancer, and pancreatic cancer were successively reported [12-16]. Although there are reports on the stem cells of acute lymphoblastic leukemia, these are fewer than those on other cancers [17,18]. A high expression of
Bmi1, which has been reported for many cancer stem
cells, might be the reason for some cancers becoming
chemoresistant [19,20]. We investigated whether Bmi1
expression is related to the prognosis and cell properties of pediatric acute lymphoblastic leukemia.
2. MATERIALS AND METHODS
2.1. PatientsBecause childhood leukemia is usually precursor B leukemia, we limited our investigation to pediatric pre- cursor B acute lymphoblastic leukemia. According to the Declaration of Helsinki, informed consent and permis- sion were obtained from all patients. Leukemic blast cells were collected from patients who had been diag- nosed with pediatric precursor B acute lymphoblastic leukemia at Hiroshima university hospital from January 2002 to September 2006. These leukemic blast cells were used for real-time polymerase chain reaction (RT-PCR). Cells were obtained from only those patients in whom the percentage of leukemic cells was higher than 90%, and only CD19+ cells were chosen.
2.2. Flow Cytometric Cell Sorting
ferent antibodies to sort each hematopoietic lineage. CD34+/CD38–, CD34+/CD38–/CD10–, CD34+/CD38+/ CD10+, CD3+, and CD19+ cells were treated as HSCs, common myeloid progenitors, common lymphoid pro- genitors, T cells, and B cells, respectively. Dead cells that positively stained with propidium iodide were excluded. The cells were sorted using a FACS Aria system (BD Biosciences, Bedford, MA). Sorted cells with a purity of at least 95% were used for further experimentation.
2.3. Real Time RT-PCR
The TaqMan RT-PCR was used for quantitative gene analysis (TaqMan PCR; Applied Biosystems, Foster City, CA). The sequences of the specific primers were as fol-
lows: Bmi1, sense primer: 5’-AAA TGC ATC GAA CAA
CGA GAA TC-3’ and antisense primer: 5’-AAT GAA
GTA CCC TCC ACA AAG CA-3’; GAPDH, sense primer:
5’-GAA GGT GAA GGT CGG AGT-3’ and antisense primer: 5’-CTT TAG GGT AGT GGT AGA AG-3’. The sequences of the 5’-FAM3’-TAMRA labeled probes were
as follows: Bmi1, 5’-CAG GTG GGG ATT TAG CTC
AG-3’ and GAPDH, 5’-CCG ACT CTT GCC CTT CGA
AC-3’. The relative quantification (ΔΔCT method) was
used for quantitative analysis.
2.4. Statistical Analysis
The correlation coefficient was analyzed with Pearson
product-moment correlation coefficient. Welch’s t test was used for analyzed between 2 groups.
3. RESULTS
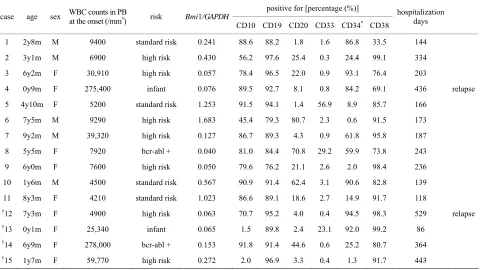
Firstly, we purified the cell populations of each dif- ferentiation stage, including the HSCs from the bone marrow of healthy volunteers and analyzed the expres- sion of the Bmi1 gene. The expression of the Bmi1 gene
is high in HSCs, and decreases when the cells enter the differentiation stage, as shown Figure 1(a). This result is
in agreement with a previous report [21]. The inhibition of T-cell differentiation has been reported in Bmi1-defi-
cient mice [22]. Therefore, it is thought that Bmi1 is es-
sential for T-cell maturation. The expression of the Bmi1
gene was high in T cells in moderation. The expression
of the Bmi1 gene did not increase when B cells under-
went differentiation. These results are summarized in the schema (Figure 1(b)). The expression of Bmi1 in HSCs
is 1.0. The expression of the Bmi1 gene was lower than
HSCs at all hematopoietic stages. In other words, the expression of the Bmi1 gene decreased during the differ-
entiation of the hematopoietic cells. In addition, it seems that undifferentiated cells have a high level of Bmi1 ex-
[image:2.595.60.542.453.723.2]pression.
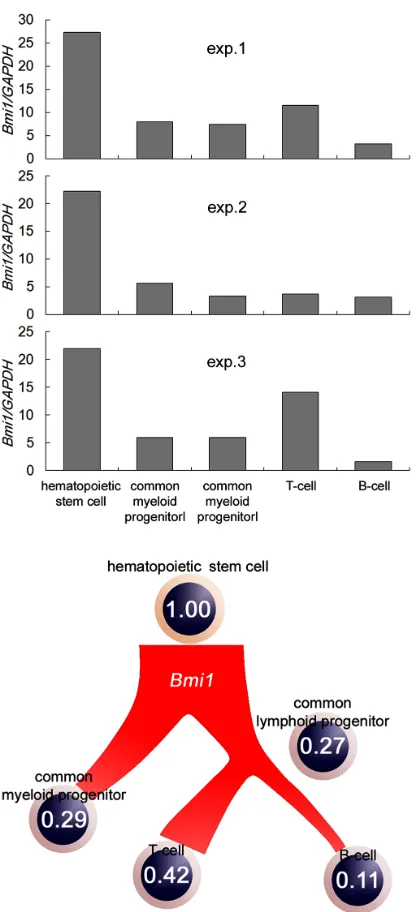
Table 1 summarizes the basic data of all participants
such as the peripheral blood white blood cell count, cell properties, and age. Unfortunately, 4 patients (Nos. 12 - 14)
Table 1. Summary of the patients’ profiles, cell profiles, and the level of Bmi1 expression.
positive for [percentage (%)] case age sex WBC counts in PB at the onset (/mm3) risk Bmi1/GAPDH
CD10 CD19 CD20 CD33 CD34* CD38
hospitalization days
1 2y8m M 9400 standard risk 0.241 88.6 88.2 1.8 1.6 86.8 33.5 144
2 3y1m M 6900 high risk 0.430 56.2 97.6 25.4 0.3 24.4 99.1 334
3 6y2m F 30,910 high risk 0.057 78.4 96.5 22.0 0.9 93.1 76.4 203
4 0y9m F 275,400 infant 0.076 89.5 92.7 8.1 0.8 84.2 69.1 436 relapse
5 4y10m F 5200 standard risk 1.253 91.5 94.1 1.4 56.9 8.9 85.7 166
6 7y5m M 9290 high risk 1.683 45.4 79.3 80.7 2.3 0.6 91.5 173
7 9y2m M 39,320 high risk 0.127 86.7 89.3 4.3 0.9 61.8 95.8 187
8 5y5m F 7920 bcr-abl + 0.040 81.0 84.4 70.8 29.2 59.9 73.8 243
9 6y0m F 7600 high risk 0.050 79.6 76.2 21.1 2.6 2.0 98.4 236
10 1y6m M 4500 standard risk 0.567 90.9 91.4 62.4 3.1 90.6 82.8 139
11 8y3m F 4210 standard risk 1.023 86.6 89.1 18.6 2.7 14.9 91.7 118
†12 7y3m F 4900 high risk 0.063 70.7 95.2 4.0 0.4 94.5 98.3 529 relapse
†13 0y1m F 25,340 infant 0.065 1.5 89.8 2.4 23.1 92.0 99.2 86
†14 6y9m F 278,000 bcr-abl + 0.153 91.8 91.4 44.6 0.6 25.2 80.7 364
†15 1y7m F 59,770 high risk 0.272 2.0 96.9 3.3 0.4 1.3 91.7 443
†
Figure 1. Quantitative analysis of Bmi1 gene expression of each hematopoietic cell type. (a) CD34+/CD38–, CD34+/ CD38+/CD10–, CD34+/CD38+/CD10 +, CD3+, and CD19+ cells were treated as HSCs, common mye- loid progenitors, common lymphoid progenitors, T cells,
and B cells, respectively. The expression of Bmi1
in-creased in immature cells; (b) Bmi1 gene expression in
each lineage are shown in the schema. The expression of
the Bmi1 gene decreased during the differentiation of
hematopoietic cells.
died in spite of treatment. Figure 2(a) compares Bmi1
gene expression in the blast cells and B cells (CD19+
cells) from the bone marrow of healthy donors. Bmi1
gene expression in all blast cells was low compared to normal B cells. There was no correlation between the prognosis of the patients and the level of Bmi1 gene ex-
Figure 2. Comparison of the level of Bmi1 expression in normal B cells and precursor B cells of acute lymphoblas- tic leukemia. (a) The level of Bmi1 expression is signifi- cantly decreased in all leukemic cells as compared to
normal B cells. The level of Bmi1 expression was not
significantly different between recurrent cases and death cases. Error bars indicate standard deviation; (b) There
was a correlation between Bmi1 gene expression and the
[image:3.595.320.529.80.624.2]pression. The expression of the Bmi1 gene was analyzed
using cells from the bone marrow at the time of recur- rence in 2 cases (of 4 relapse cases). In one of these 2 cases, Bmi1 expression in the blast cells increased from
the first onset but did not change in the second case. However, both patients had low expression levels com- pared to normal B cells. There was a negative correlation between Bmi1 gene expression and the cell surface mark-
er CD34 (Figure 2(b)). It is known that human HSCs
harbor the CD34 antigen. Therefore, we expected that CD34+ cells are undifferentiated cells and express Bmi1.
However, this result was contrary to our expectation.
4. DISCUSSION
We investigated whether the level of Bmi1 gene ex-
pression in pediatric precursor B leukemic cells is related to the clinical course, cell profile, and prognosis. There are reports on a relationship between the prognosis of
hematopoietic malignancies and Bmi1 gene expression.
Especially in AML, CML, and MDS, when the expres- sion of the Bmi1 gene increased in leukemic blasts, the
prognosis was bad [8-10]. Yet, the reason for this is not
known. However, the Bmi1 protein regulates the
p16INK4a protein, which is one of the CDK (cyl- cin-dependent kinase) inhibitors [23]. In addition, the proliferation of leukemic cells may increase due to Bmi1
expression. Bmi1 is an essential molecule for the self-
renewal of HSCs. It has been reported that the selfre-
newal of HSCs reduces remarkably in Bmi1-deficient
mice [7]. Immature cells such as HSCs have a high ex- pression of Bmi1, and Bmi1 expression decreases in
de-veloped cells during differentiation [21,24]. It has been reported that the expression of the Bmi1 gene is high in
side population cells such as cancer stem cells in heap- tocellular carcinoma [25]. It can be expected that the ex- pression of the Bmi1 gene increases in cancer stem cells
according to these previous studies. Usually, cancer stem cells are chemoresistant. In addition, it was shown that cancer stem cells are involved in cancer recurrence [26-28]. A high expression of Bmi1, which has been re-
ported for many cancer stem cells, might be the reason for some cancers becoming chemoresistant [19,20]. Therefore, there is the possibility that the cancer cells are not exterminated, and the prognosis of the patient wors- ens. In acute lymphoblastic leukemia, it was reported that CD90+/CD110+ cells in acute lymphoblastic T-cell leu- kemia, and CD9-overexpressing cells in acute lym- phoblastic B-cell leukemia, are cancer stem cells [17,18]. Although these data were collected from in vitro experi- ments, the existence of cancer stem cells in primary pre- cursor B acute lymphoblastic leukemia cells and pediat- ric acute lymphoblastic leukemia cells is not clarified yet. In our data, there was the significance of the negative
correlation between CD34 and Bmi1 expression of blast
cells. Generally, it is known that human CD34 positive cells are immature cells. When there are many immature cells, poor prognosis was expected. There were a few reports that CD34 is a prognostic factor in adults with acute myelocytic leukemia [29,30]. However, there were no reports showing the relation between CD34 and prognosis of acute lymphoblastic leukemia. Both CD34
and the expression of Bmi1 were not correlated with
prognosis in our data. Bmi1 expression in pediatric acute
lymphoblastic leukemia cells is lower than that in normal
B cells. We do not know why the Bmi1 expression in
pediatric acute lymphoblastic leukemia cells is lower than Bmi1 expression in B-cells. Although it is our specu-
lation, pediatric acute lymphoblastic leukemia cells are no longer in immature. Moreover, cancer stem cells in pediatric acute acute lymphoblastic leukemia may be nonexistent.
5. CONCLUSION
We investigated whether the level of Bmi1 expression
in leukemic cells is related to the prognosis and the characteristics of childhood acute lymphoblastic leuke- mia. From this result, it will be a very small number even if immature cells like cancer stem cells exist. In addition, there is no correlation between Bmi1 expression and the
prognosis of pediatric acute lymphoblastic leukemia. Cancer stem cells may not exist in pediatric acute lym- phoblastic leukemia. However, the number of people participating in the experiment is not enough in this study. We consider the samples from more patients with leuke- mia will be necessary to lead certain conclusion.
6. ACKNOWLEDGEMENTS
We are indebted to the pediatric hematologists (Drs. Takashi Sato, M.D., Shinichiro Nishimura, M.D., Hiroshi Kawaguchi, M.D., Kazu- hiro Nakamura, M.D., and Mizuka Miki, M.D.) and nurses for provid- ing excellent patient care.
We thank the Analysis Center of Life Science, Hiroshima University, for allowing us to use their facilities.
REFERENCES
[1] Alkema, M.J., Bronk, M., Verhoeven, E., Otte, A., van’t
Veer, L.J., Berns. A. and van Lohuizen. M. (1997) Identi-
fication of Bmi1-interacting proteins as constituents of a
multimeric mammalian polycomb complex. Genes & De-
velopment, 11, 226-240. doi:10.1101/gad.11.2.226
[2] Gunster, M.J., Satijn, D.P., Hamer, K.M., den Blaauwen,
J.L., de Bruijn, D., Alkema, M.J., van Lohuizen, M., van Driel, R. and Otte, A.P. (1997) Identification and charac- terization of interactions between the vertebrate polycomb-
group protein Bmi1 and human homologs of polyhomeo-
[3] Hashimoto, N., Brock, H.W., Nomura, M., Kyba, M., Hodgson, J., Fujita, Y., Takihara, Y., Shimada, K. and Hi-
gashinakagawa, T. (1998) RAE28, Bmi1, and M33 are
members of heterogeneous multimeric mammalian poly-
comb group complexes. Biochemical and Biophysical Re-
search Communications, 245, 356-365.
doi:10.1006/bbrc.1998.8438
[4] Shao, Z., Raible, F., Mollaaghababa, R., Guyon, J.R., Wu,
C.T., Bender, W. and Kingston, R.E. (1999) Stabilization of chromatin structure by PRC1, a polycomb complex.
Cell, 98, 37-46. doi:10.1016/S0092-8674(00)80604-2
[5] Francis, N.J., Saurin, A.J., Shao, Z. and Kingston, R.E.
(2001) Reconstitution of a functional core polycomb re- pressive complex. Molecular Cell, 8, 545-556.
doi:10.1016/S1097-2765(01)00316-1
[6] Park, I.K., Qian, D., Kiel, M., Becker, M.W., Pihalja, M.,
Weissman, I.L., Morrison, S.J. and Clarke, M.F. (2003)
Bmi-1 is required for maintenance of adult self-renewing
haematopoietic stem cells. Nature, 423, 302-305.
[7] Lessard, J. and Sauvageau, G. (2003) Bmi-1 determines
the proliferative capacity of normal and leukaemic stem cells. Nature, 423, 255-260.
[8] Chowdhury, M., Mihara, K., Yasunaga, S., Ohtaki, M.,
Takihara, Y. and Kimura, A. (2007) Expression of poly-
comb-group (PcG) protein Bmi-1 predicts prognosis in
patients with acute myeloid leukemia. Leukemia, 21, 1116-
1122. doi:10.1038/sj.leu.2404623
[9] Mohty, M., Yong, A.S., Szydlo, R.M., Apperley, J.F. and
Melo, J.V. (2007) The polycomb group Bmi1 gene is a
molecular marker for predicting prognosis of chronic myeloid leukemia. Blood, 110, 380-383.
doi:10.1182/blood-2006-12-065599
[10] Mihara, K., Chowdhury, M., Nakaju, N., Hidani, S., Ihara,
A., Hyodo, H., Yasunaga, S., Takihara, Y. and Kimura, A.
(2006) Bmi-1 is useful as a novel molecular marker for
predicting progression of myelodysplastic syndrome and patient prognosis. Blood, 107, 305-308.
doi:10.1182/blood-2005-06-2393
[11] Bonnet, D. and Dick, J.E. (1997) Human acute myeloid
leukemia is organized as a hierarchy that originates from
a primitive hematopoietic cell. Nature Medicine, 3, 730-
737. doi:10.1038/nm0797-730
[12] Al-Hajj, M., Wicha, M.S., Benito-Hernandez, A., Morri-
son, S.J. and Clarke, M.F. (2003) Prospective identifica- tion of tumorigenic breast cancer cells. Proceedings of the National Academy of Sciences of the United States of Amer-
ica, 100, 3983-3988. doi: 10.1073/pnas.0530291100
[13] Singh, S.K., Clarke, I.D., Terasaki, M., Bonn, V.E., Haw-
kins, C., Squire, J. and Dirks, P.B. (2003) Identification of a cancer stem cell in human brain tumors. Cancer Research,
63, 5821-5828.
[14] Xin, L., Lawson, D.A. and Witte, O.N. (2005) The Sca-1
cell surface marker enriches for a prostate-regenerating cell subpopulation that can initiate prostate tumorigenesis. Proceedings of the National Academy of Sciences of the United States of America, 102, 6942-6947.
doi:10.1073/pnas.0502320102
[15] Ricci-Vitiani, L., Lombardi, D.G., Pilozzi, E., Biffoni, M., Todaro, M., Peschle, C. and De Maria, R. (2007) Identi-
fication and expansion of human colon-cancer-initiating cells. Nature, 445, 111-115.
[16] Li, C., Heidt, D.G., Dalerba, P., Burant, C.F., Zhang, L.,
Adsay, V., Wicha, M., Clarke, M.F. and Simeone, D.M. (2007) Identification of pancreatic cancer stem cells. Can- cer Research, 67, 1030-1037.
doi: 10.1158/0008-5472.CAN-06-2030
[17] Yamazaki, H., Nishida, H., Iwata, S., Dang, N.H. and Mo-
rimoto, C. (2009) CD90 and CD110 correlate with cancer stem cell potentials in human T-acute lymphoblastic leu-
kemia cells. Biochemical and Biophysical Research Com-
munications, 383, 172-177.
doi:10.1016/j.bbrc.2009.03.127
[18] Nishida, H., Yamazaki, H., Yamada, T., Iwata, S., Dang,
N.H., Inukai, T., Sugita, K., Ikeda, Y. and Morimoto, C. (2009) CD9 correlates with cancer stem cell potentials in
human B-acute lymphoblastic leukemia cells. Biochemi-
cal and Biophysical Research Communications, 382, 57-
62. doi:10.1016/j.bbrc.2009.02.123
[19] Zhang, S., Balch, C., Chan, M.W., Lai, H.C., Matei, D.,
Schilder, J.M., Yan, P.S., Huang, T.H. and Nephew, K.P. (2008) Identification and characterization of ovarian
can-cer-initiating cells from primary human tumors. Cancer
Research, 68, 4311-4320.
doi:10.1158/0008-5472.CAN-08-0364
[20] Wang, E., Bhattacharyya, S., Szabolcs, A., Rodriguez-
Aguayo, C., Jennings, N.B., Lopez-Berestein, G., Muk-herjee, P., Sood, A.K. and Bhattacharya, R. (2011) En-
hancing chemotherapy response with Bmi-1 silencing in
ovarian cancer. PLoS One, 6, p. e17918.
doi:10.1371/journal.pone.0017918
[21] Lessard, J., Baban, S. and Sauvageau, G. (1998) Stage-
specific expression of polycomb group genes in human bone marrow cells. Blood, 91, 1216-1224.
[22] Miyazaki, M., Miyazaki, K., Itoi, M., Katoh, Y., Guo, Y.,
Kanno, R., Katoh-Fukui, Y., Honda, H., Amagai, T., van Lohuizen, M., Kawamoto, H. and Kanno, M. (2008) Thy- mocyte proliferation induced by pre-T cell receptor sig-
naling is maintained through polycomb gene product Bmi-
1-mediated Cdkn2a repression. Immunity, 28, 231-245.
doi:10.1016/j.immuni.2007.12.013
[23] Jacobs, J.J., Kieboom, K., Marino, S., DePinho, R.A. and
van Lohuizen, M. (1999) The oncogene and polycomb- group gene bmi-1 regulates cell proliferation and sense- cence through the ink4a locus. Nature, 397, 164-168.
[24] Hosen, N., Yamane, T., Muijtjens, M., Pham, K., Clarke,
M.F. and Weissman, I.L. (2007) Bmi-1-green fluorescent
protein-knock-in mice reveal the dynamic regulation of bmi-1 expression in normal and leukemic hematopoietic cells. Stem Cells, 25, 1635-1644.
doi:10.1634/stemcells.2006-0229
[25] Chiba, T., Miyagi, S., Saraya, A., Aoki, R., Seki, A., Mo-
rita, Y., Yonemitsu, Y., Yokosuka, O., Taniguchi, H., Na- kauchi, H. and Iwama, A. (2008) The polycomb gene
product Bmi1 contributes to the maintenance of tumor-
initiating side population cells in hepatocellular carci-
noma. Cancer Research, 68, 7742-7749.
doi:10.1158/0008-5472.CAN-07-5882
I.R., Lu, L., Irvin, D., Black, K.L. and Yu, J.S. (2006) Analysis of gene expression and chemoresistance of
CD133+ cancer stem cells in glioblastoma. Molecular
Cancer, 5, 67-78. doi:10.1186/1476-4598-5-67
[27] Gutova, M., Najbauer, J., Gevorgyan, A., Metz, M.Z.,
Weng, Y., Shih, C.C. and Aboody, K.S. (2007) Identifica- tion of uPAR-positive chemoresistant cells in small cell lung cancer. PLoS ONE, 2, e243.
doi:10.1371/journal.pone.0000243
[28] Shafee, N., Smith, C.R., Wei, S., Kim, Y., Mills, G.B.,
Hortobagyi, G.N., Stanbridge, E.J. and Lee, E.Y. (2008) Cancer stem cells contribute to cisplatin resistance in
Brca1/p53-mediated mouse mammary tumors. Cancer
Research, 68, 3243-3250.
doi:10.1158/0008-5472.CAN-07-5480
[29] Geller, R.B., Zahurak, M., Hurwitz, C.A., Burke, P.J.,
Karp, J.E., Piantadosi, S. and Civin, C.I. (1990) Prognos-tic importance of immunophenotyping in adults with acute myelocytic leukaemia: The significance of the stem-
cell glycoprotein CD34 (My10). British Journal of Hae-
matology, 76, 340-347.
doi:10.1111/j.1365-2141.1990.tb06365.x
[30] Myint, H. and Lucie, N.P. (1992) The prognostic signifi-