Copyright1999 by the Genetics Society of America
Multiple-Trait Quantitative Trait Loci Analysis Using a Large Mouse Sibship
Anne U. Jackson,* Alison Forne´s,* Andrzej Galecki,
‡,§Richard A. Miller
†,‡,§and David T. Burke*
,§*Department of Human Genetics,†Department of Pathology,‡Ann Arbor Department of Veteran’s Affairs Medical Center, Ann Arbor, Michigan 48109 and§Institute of Gerontology, University of Michigan, Ann Arbor, Michigan 48109
Manuscript received July 28, 1997 Accepted for publication October 27, 1998
ABSTRACT
Quantitative trait loci influencing several phenotypes were assessed using a genetically heterogeneous mouse population. The 145 individuals were produced by a cross between (BALB/cJ3 C57BL/6J)F1
females and (C3H/HeJ3DBA/2J)F1males. The population is genetically equivalent to full siblings derived
from heterozygous parents, with known linkage phase. Each individual in the population represents a unique combination of alleles from the inbred grandparents. Quantitative phenotypes for eight T cell measures were obtained at 8 and 18 mo of age. Single-marker locus, repeated measures analysis of variance identified nine marker-phenotype associations with an experimentwise significance level of P,0.05. Six of the eight quantitative phenotypes could be associated with at least one locus having experiment-wide significance. Composite interval, repeated measures analysis of variance identified 13 chromosomal regions with comparisonwise (nominal) significance associations of P , 0.001. The heterozygous-parent cross provides a reproducible, general method for identification of loci associated with quantitative trait pheno-types or repeated phenotypic measures.
A
NALYSIS of the genetic regulation of quantitative nately regulate age-related changes in many cell and tissue types. Mutant-hunting approaches, which can lead phenotypes under complex multilocus control hastypically employed a system in which progenitor animals, to the discovery of new loci with developmental or mor-phological effects, are generally not feasible for analysis often from inbred stocks that differ in the trait in
ques-tion, are used to produce a segregating F2or backcross of phenotypes that require years to develop.
We have attempted to circumvent some of these diffi-generation. Associations between marker loci and the
levels of the trait are then used to count and to map the culties by a strategy in which each mouse in an aging population is tested for several age-sensitive traits. To effector loci. This strategy, though productive in some
increase the level of potential allelic variability, we have situations, will fail to identify loci of potential interest
generated our test population by a heterozygous-parent that are not polymorphic between the two chosen
pro-breeding method, so that each animal can be consid-genitors or that require a specific context of interacting
ered a full sibling derived from parents with known genes (LanderandSchork1994;Frankel1995).
linkage phase. This approach provides a reproducible The genetic analysis of mammalian aging poses
par-heterogeneous population in which a range of late-life ticular challenges. The traits of interest, such as the
illnesses develop and influence longevity (Milleret al. incidence of late life diseases, the pace of age-related
1994;Chrispet al. 1996). The breeding system is amena-changes in a variety of organ systems, and life span,
ble to rapid, automated, DNA marker-based genetic cannot be measured inexpensively even in short-lived
analysis using simple sequence length polymorphism species (such as mice), because the tests must be
pre-(SSLP) markers already known to discriminate among ceded by months or years of costly husbandry. In
addi-the grandparental strains. Within addi-the population, we tion, differences among the inbred strains in mean life
have tested each mouse at two ages for the proportions span or in age-sensitive traits may well represent
differ-of eight T cell measures, including five that have been ential susceptibility to specific early-life diseases, rather
shown to vary with age in previous cross-sectional and than more general alterations in the aging process.
Al-longitudinal studies (Miller1996, 1997). The analyti-though many single gene mutations are known to
cal approach, based on repeated measures analysis of shorten mean life span in mice or in humans, each of
variance procedures and composite interval mapping these typically operates by interference with one or a
(Zeng1994;Xu1996), can identify loci that influence small number of physiological systems and may thus
the age-independent levels of T cell subsets as well as provide little insight into mechanisms that might
coordi-loci whose influence on the trait varies with animal age. Although the heterozygous-parent cross method does not create a formal homozygous class of the sort obtained
Corresponding author: David T. Burke, Department of Human
Genet-in F2crosses and backcrosses, interactions between ma-ics, University of Michigan Medical School, 1150 West Medical Center
Dr., Ann Arbor, MI 48109-0618. E-mail: [email protected] ternal and paternal alleles can, in practice, reveal the
786 A. U. Jackson et al.
from the most centromeric to the most telomeric marker locus effects of recessive alleles. The candidate quantitative
in the Whitehead/MIT database. Chromosomal localization trait loci (QTL) should help to guide further
confirma-and order of markers were calculated using both an Excel tory analysis using a larger population of mice and a macro and the MapMaker program package (Whitehead Insti-higher-density genetic map and provide points of depar- tute, MIT).
An ALFexpress automated sequence analyzer (Pharmacia, ture for genetic analysis of aging, age-associated
pheno-Piscataway, NJ) was used for genotyping several markers near typic changes, and T cell subset regulation.
the conclusion of the study. Amplification reactions were per-formed as above, except that one primer was fluorescently tagged with the dye Cy-5. Amplification reactions were mixed MATERIALS AND METHODS with formamide (50% final concentration) and internal DNA size standards, heat denatured, and loaded onto 0.3-mm-thick,
Mouse handling: (BALB/cJ 3 C57BL/6J)F1 females and
6murea, 6% polyacrylamide gels (LongRanger; FMC, Rock-(C3H/HeJ3DBA/2J)F1males were purchased from the
Jack-land, ME). Migration information was captured using the son Laboratories and mated to produce the study population.
ALFexpress AM v3.02 software. Alleles were scored indepen-The animals for this study were derived from 12 birth cages,
dently by two people using Fragment Manager software (v1.20; each containing a single male and two females. Offspring were
Pharmacia) and the resulting data were exported to Excel weaned at 4 wk and housed segregated by sex in standard mouse
spreadsheets for record keeping and analysis. cages, each initially containing four or five mice. In most cases,
Statistical methods for marker-phenotype analysis:For the all members of a litter entered the population at weaning.
initial analysis, a single-marker model was used, with no inclu-Throughout the study, all mice were housed in a single suite
sion of information from flanking markers or markers in other of specific-pathogen-free (SPF) rooms under identical
envi-intervals. This is a simple linear regression method for associat-ronmental conditions (12:12 hr light:dark cycle, 238) and
ing markers with QTL (Solleret al. 1976;HaleyandKnott given ad libitum access to water and laboratory mouse chow;
1992; KnottandHaley 1992). Because repeated measuquarterly tests of sentinel mice showed that the facility
re-ments were taken on each animal and are correlated, a mixed mained SPF throughout the period of the study.
linear model was used to identify associations between the Immunophenotyping assays have been described in detail
single markers and longitudinal traits. The Mixed procedure previously (Milleret al. 1994, 1996).
in SAS (version 6.11; SAS Institute) was used to perform
mixed-Genotyping assays:Polymorphic marker loci were selected for
model analyses. This parametric procedure uses a ridge-stabi-PCR-based genotyping using data provided by the Mouse SSLP
lized Newton-Raphson algorithm to optimize a maximum-like-Database, Whitehead/MIT Center for Genome Research
(Cam-lihood function. To account for the correlated repeated time bridge, MA; http://www.genome.wi.mit.edu/cgi-bin/mouse/) or
data an unstructured residual covariance matrix was specified the Mouse Genome Database 3.1, Mouse Genome Informatics,
in addition to the fixed effects. The linear model for single the Jackson Laboratory (Bar Harbor, ME; http://www.
timepoint analysis (8 mo or 18 mo) specified informatics.jax.org/). Primer pairs were either purchased
from Research Genetics or synthesized locally (University of y
k5 m 1C1S1 ami 1 apj 1 dij1εk for i, j51, 2,
Michigan Molecular Biology Core Facility). Genomic DNA
was isolated from each adult animal by removal of ≈1 cm where ykis the phenotype for the kth individual,mis the overall
of tail and preparation using a standard phenol-extraction mean, C is the birth cage effect, S is the effect of gender and method (Sambrooket al. 1989). Final DNA preparations were is used only for traits influenced by gender,am
i anda
p
j are the
tested for concentration, ability to sustain PCR amplification additive effects of the maternal alleles Mm
i and the paternal
under standard conditions, and electrophoretic size distribu- alleles Mpi, respectively, of marker M, dijis the
maternal-by-tion. paternal allelic interaction (dominance effect), andεkis the
Amplification of genomic DNA was performed using 20 ng error term with N(0,s2
ε). C is a random effect; all other speci-mouse DNA in 10 mmTris-HCl pH 8.3, 50 mmKCl, 1.5 mm fied effects are fixed. For loci that are not fully informative, MgCl2, 200mmeach dNTP, 100 nmeach primer, and 0.2 units the second additive effect and the dominance effect are
de-Taq DNA polymerase. After a 3-min denaturation at 948, 35 leted from the model. Dummy variables were created for the cycles of denaturation at 948 (30 sec), annealing at 558(30 maternal and paternal indicators.
sec), and extension at 728(30 sec) were performed, followed For the repeated measures analysis model (combined 8-by a final extension at 728 (5 min). Reactions were held in and 18-mo values), additional terms for timepoint (T ) and, 96-well, thin-wall polycarbonate plates (Costar, Cambridge, where a sex effect is observed, gender-by-timepoint (ST ) inter-MA), and temperature controlled using a 96-well UNO ther- actions are included:
mocycler (Biometra, Tampa, FL). Amplification products
yk5 m 1C1S1T1ST1 ami 1 apj 1 dij1εk
were mixed with formamide to 50%, heat denatured, and
electrophoresed on 0.5-mm-thick, 7murea, 6% polyacrylamide for i, j51, 2. gels. After electrophoresis, bands were visualized by silver
stain-ing (Silver Sequence; Promega, Madison, WI). Briefly, gels Critical values for experimentwise significance were assessed using permutation testing (Churchilland Doerge 1994). were fixed in 10% acetic acid, rinsed in water, and stained in
5.9 mmAgNO3, 0.056% formaldehyde. After a water rinse, gels For permutation testing, 1000 shuffled data analyses were
per-formed using the same regression models and experimental were developed at 48in 0.28mNa2CO3, 0.056% formaldehyde.
Development was terminated with 10% acetic acid, and gels data. The program recorded the highest test statistic obtained in each analysis, and these were ordered at the end of the were rinsed in water and dried onto cellophane. Gels were
scored independently by two people, each of whom entered procedure. The 90, 95, and 99th percentile values were re-ported as the experimentwise significance level at a 50.1, scores by hand into an Excel spreadsheet (Microsoft). Scoring
conflicts were automatically flagged for rescoring. Rescoring 0.05, and 0.01, respectively.
Composite interval analysis was performed using Proc Mixed was performed independently by both original scorers.
Verifi-cation of independent segregation was performed on the final adapted to the heterozygous parent cross-breeding structure. The model was derived from the “four-way cross” QTL analysis genotype scores using x2-analysis of expected and observed
787 Multiple-Trait QTL Analysis
established F2composite interval mapping method of Zeng UM-HET3 population were genotyped and were assayed
(1994). The linear model and conditional probability frequen- for T cell subset phenotypes at 8 and 18 mo of age. The cies are described in detail inXu(1996, Table 1 and Equation
animals were maintained for their natural life span, or 7) and have been implemented with no significant
modifica-killed when judged by an experienced technician to be tions when both flanking markers were fully informative. To
account for the correlated repeated time data an unstructured moribund. At necropsy, the animals exhibited a range covariance matrix was specified in addition to the fixed effects. of pathologies and presumptive causes of death, as ex-Again, the birth cage of each individual was included as a pected for a genetically heterogeneous population random effect. When at least one flanking marker was missing
(Chrispet al. 1996). maternal (or paternal) information, the corresponding
pater-Longitudinal phenotype analysis:Animals were tested nal (or maternal) and dominance probabilities were not
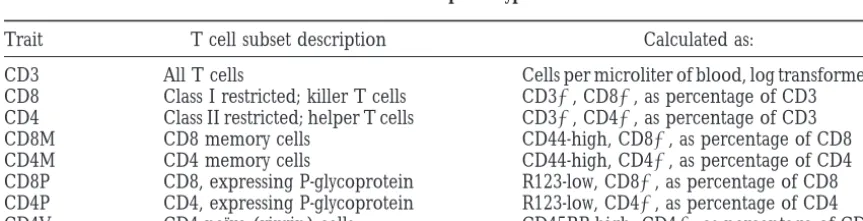
calcu-lated, and these terms were deleted from the model. for eight T cell phenotypes (Table 1) at 8 and 18 mo Post hoc comparison of means was performed using the least of age, using flow cytometry on a sample of tail venous significant difference or planned comparisons option in
Statis-blood (Milleret al. 1996). Eighteen male and 8 female tica (release 5.0b; StatSoft, Tulsa, OK). In all analyses, with
animals entered into the study at 8 mo did not survive the exception of a logarithmic transformation of CD3 cell
levels, primary trait data were not transformed. to the 18-mo timepoint and consequently provide no longitudinal information. Overall, a small number (,5%) of the immunotyping assays were deemed unreliable
RESULTS on technical grounds; these were not included in the
analysis. The CD4V T cell subset assays at the 8-mo A defined heterogeneous mouse population:The
ge-timepoint were successful on less than half of the ani-netically heterogeneous mouse population, designated
mals and were not included in any analysis. UM-HET3, was derived from the progenitor inbred
A previous study of T cell subsets in UM-HET3 mice strains BALB/cJ (C), C57BL/6J (B6), C3H/HeJ (C3),
(Miller 1997) has shown that these mice, like most and DBA/2J (D2). Female CB6F1mice were bred with
inbred and F1hybrid mice, exhibit an increase with age C3D2F1males to generate a population of animals. For
in proportions of CD8M, CD4M, CD8P, and CD4P cells, an autosomal locus with detectable polymorphisms
and a decline in CD4V cells. CD4 cells also decrease among the progenitor genomes, four possible
geno-with age in the peripheral blood of UM-HET3 mice, as types are obtained: C/C3, C/D2, B6/C3, and B6/D2.
well as in some, but not all, studies of inbred and F1 Alleles from the four progenitor chromosomes are
ex-hybrid mice. Many of these T cell subsets exhibit corre-pected to be represented equally, and this was
con-lated variation. Individual UM-HET3 mice with rela-firmed by visual observation of the phenotypes
associ-tively high levels of CD4M cells, for example, also tend ated with coat color loci brown and agouti (not shown).
to have high levels of CD8M cells and low levels of CD4V The starting population for this analysis contained
cells (Miller1997). It is not known whether these cor-174 animals (88 male, 86 female) born between 9/14/93
relations have any genetic basis. Gender was found to and 2/16/94, and housed in same-sex cages. Six cages
have a significant effect on the CD3, CD4, CD4P, and containing male mice (22 animals) were eliminated
CD8P phenotypes. from the study because some of the animals had
sus-Genotype analysis:Dietrichet al. (1994) have exam-tained injuries from fighting. Four males and two
fe-ined the four inbred progenitor strains atz6000 SSLP males were excluded from analysis because they died
loci, and maintain the associated allele size information before the first phenotyping analysis (,8 mo), and one
in a common database (Whitehead/MIT Center for Ge-male was killed in error during the study. The final
ana-nome Research). In this study, 83 SSLP marker loci lyzed population consisted of 145 animals (84 females
were used for genome-wide genotyping of the full UM-and 61 males) that were kept in a single room under
controlled SPF conditions. All animals entered into the HET3 population. Sixty-eight of the marker loci are
TABLE 1 T cell subset phenotypes
Trait T cell subset description Calculated as:
CD3 All T cells Cells per microliter of blood, log transformed
CD8 Class I restricted; killer T cells CD31, CD81, as percentage of CD3 CD4 Class II restricted; helper T cells CD31, CD41, as percentage of CD3
CD8M CD8 memory cells CD44-high, CD81, as percentage of CD8
CD4M CD4 memory cells CD44-high, CD41, as percentage of CD4
788 A. U. Jackson et al.
informative for all four progenitor alleles, 13 are infor-mative for maternal or paternal segregating alleles only, and 2 are X-linked (Table 2). At the time of statistical analysis, unambiguous genotype data were lacking for z6% of the animal-locus data points.
Marker map order within the UM-HET3 population was in agreement with the Mouse Genome Database (The Jackson Laboratory), with two exceptions. First, the marker D8Mit112 did not map to chromosome 8. On typing with the Jackson Laboratory Interspecific Backcross panel (Roweet al. 1994), it was placed on chro-mosome 9 at≈17 cM. Second, the markers D12Mit63 and D12Mit34 show linkage to each other but not to the other markers on chromosome 12. Interspecific back-cross mapping using the Jackson Laboratory backback-cross panel placed D12Mit34 on chromosome 12 at≈19 cM and D12Mit105 at ≈7 cM. As a consequence, the UM-HET3 map order inconsistencies on chromosome 12 remain unresolved. Segregation analysis of the UM-HET3 population indicated a single significant (P , 0.01) departure from expected random segregation. The locus D11Mit2 is favored for the C3 paternal allele byz2:1 in male UM-HET3 animals only.
At the current genotyping density,z95% of the au-tosomal genome lies within 30 cM of a marker. Six autosomes have only two four-way informative loci; also, the X chromosome is significantly underrepresented relative to its genetic length.
Associations between marker loci and traits:The goal of the genetic analysis was to identify QTL associated with either the level of a particular trait, or with the degree that the trait changed over time. The phenotype and genotype data were characterized by two statistical methods.
The initial analysis sought associations between alleles at individual marker loci and each specific T cell sub-set using a general, parametric statistical model (Proc Mixed; SAS version 6.11) to perform repeated measures analysis of variance. The Proc Mixed analytical model examined each of the eight phenotypes as a dependent variable, and set four independent variables: maternal-derived genotype, paternal-maternal-derived genotype, age at phe-notype measurement, and, for traits CD3, CD8, CD4P, and CD8P, sex of the individual. This approach can reveal the dependence of the T cell subset on interac-tions among the independent variables, such as an age-dependent effect of a locus on phenotype, or an interac-tion between maternal and paternal alleles. The Proc Mixed analysis generates a locus-specific F-statistic for each of four hypotheses: (1) overall segregation of a QTL using all genotypes, (2) segregation of a QTL using maternal-derived genotypes, (3) segregation of a QTL using paternal-derived genotypes, and (4) segregation of a QTL using maternal-by-paternal allelic interaction. In each hypothesis, the model included adjustment for birth cage effects and, where applicable, gender. A
per-TA BL E 2 SSLP genetic marker loci Marker cM Marker cM Marker cM Marker cM Marker cM Marker cM D1Mit167 2 D3Mit42 42 D6Mit102 32 D10Mit40 21 D12Mit34 (m) 23 D16Mit36 (m) 25 D1Mit22 33 D3Mit86 55 D6Mit149 40 D10Mit15 25 D12Mit167 47 D16Mit5 33 D1Nds2 59 D4Mit171 11 D6Mit198 (m) 57 D10Mit14 70 D12Mit19 57 D17Mit46 3 D1Mit206 94 D4Mit55 23 D7Mit76 3 D11Mit2 4 D13Mit64 15 D17Mit47 19 D1Mit221 105 D4Mit84 31 D7Mit25 13 D11Mit83 13 D13Mit26 25 D17Mit221 50 D1Mit17 110 D4Mit155 48 D7Mit91 27 D11Mit20 20 D13Mit76 43 D18Mit60 10 D2Mit37 (m) 45 D4Mit170 70 D8Mit51 42 D11Mit156 32 D14Mit129 22 D18Mit55 16 D2Mit58 51 D5Mit48 0 D8Mit42 73 D11Mit29 37 D14Mit70 (m) 53 D18Mit51 25 D2Mit285 72 D5Mit79 18 D8Mit112 a 17 D11Mit8 (m) 43 D14Mit35 53 D19Mit41 12 D2Mit265 (m) 92 D5Mit205 33 D9Mit104 34 D11Mit168 75 D15Mit100 19 D19Mit19 (m) 26 D3Mit62 3 D5Mit25 46 D9Mit110 44 D12Mit38 (m) 1 D15Mit63 28 D19Mit10 35 D3Mit25 22 D5Mit95 58 D9Mit12 54 D12Mit105 (m) 6 D15Mit42 (p) 60 DXMit119 (m) 24 D3Mit22 25 D6Mit268 8 D9Mit151 70 D12Mit46 13 D16Mit182 3 DXMit173 (m) 40 D3Mit73 30 D6Mit186 21 D10Mit80 2 D12Mit63 (m) 16 D16Mit103 (m) 22 All loci are informative for the four possible genotypes, except where noted: (m) Only alleles from the maternal parent can be distinguished; (p) only alleles from the paternal parent can be distinguished. aThe marker D8Mit112 has been shown to map to chromosome 9, at 17 cM from the centromere (see text).
shuf-789 Multiple-Trait QTL Analysis
fling of the phenotype data to obtain experimentwise types. As an example, single-marker statistical analysis identified an association between locus D12Mit105 and empirical threshold significance values, as suggested by
ChurchillandDoerge(1994). The associated P values CD8M levels (P50.01; Table 3). While the analysis identi-fied an effect of the maternal-derived allele, it does not are given in Table 3. Single-locus Proc Mixed analysis
identified nine loci associated with T cell subsets with specify which maternal allele is associated with high levels of CD8M cells. Figure 1 shows the UM-HET3 population experimentwise P,0.05.
The second analysis also used a repeated measures distribution for CD8M segregated by maternal-derived allele (B6 vs. C). At 8 mo of age those mice with the analysis of variance method, but included the influence
of flanking markers and QTL effects in other chromo- B6 allele at D12Mit105 have higher mean values of CD8M than those with the C allele (post hoc t-test, P5 somal intervals (i.e., composite interval mapping). The
“four-way cross” parameters defined byXu(1996) were 0.00005). The B6 allele is also associated with higher levels of CD8M cells at 18 mo (post hoc t-test, P50.0031). incorporated into the statistical model. In the four-way
cross design, the overall phenotype distribution is a mix- It is thus likely that D12Mit105 is linked to a gene (or genes) that varies between the B6 and C progenitors ture of four component distributions. Each component
distribution is defined by one of the four possible geno- and affects CD8M levels in an age-independent fashion in a population of genetically heterogeneous siblings. typic pairs at a given QTL. The regression model ofXu
(1996) approximates the mixture of these distributions, The repeated measures analysis is able to identify loci where the effect of the allele on a trait varies with age. where the portion of the variance not explained by
marker uncertainty is combined into the residual error. The association between D12Mit105 and CD8 levels identified in the composite interval analysis presents a The hypotheses tested under this repeated measures
model were the same as for the single locus method: clear example. Figure 2 illustrates the post hoc analysis of the 8- and 18-mo phenotype distributions, segregated (1) overall segregation of a QTL using all genotypes, (2)
segregation of a QTL using maternal-derived genotypes, by maternal-derived allele (B6 vs. C). The B6 allele is associated with higher levels of CD8 T cells, but only (3) segregation of a QTL using paternal-derived
geno-types, and (4) segregation of a QTL using maternal-by- later in life (post hoc t-test, P50.00029). The QTL linked to D12Mit105 is a novel locus that interacts in a life-paternal allelic interaction. Again, the mixed model can
reveal the dependence of the T cell subset on interac- course-specific manner with the CD8 T cell levels. Finally, some interactions between maternal and pa-tions among the independent variables, such as an
age-dependent effect of a chromosomal interval on pheno- ternal alleles may be the result of “recessive” effects, where only one of the four possible allelic pairs is associ-type or an interaction between maternal and paternal
chromosomal intervals. The Proc Mixed F-statistic for ated with a phenotype. The locus D17Mit221 provides an example. Table 3 shows an association between D17Mit221 each hypothesis was generated across each of 64
chro-mosomal intervals. Intervals were calculated at a density and CD4M levels with an experimentwise P50.02, but only with maternal-by-paternal allelic interaction. Post reflecting the distance between flanking markers as
fol-lows: markers,5 cM apart, 1-cM intervals; 5 to 20 cM, hoc analysis indicated that only one allelic pairing of the maternal- and paternal-derived genotypes has a pheno-2-cM intervals; 21 to 30 cM, 3-cM intervals; 31 to 40 cM,
4-cM intervals; and$40 cM, 5-cM intervals. Results of typic effect (Figure 3), with C/C3 heterozygotes having a consistently higher mean value for CD4M levels, with the composite interval analysis are reported in Table 4.
The composite interval mapping method—performed post hoc P-values between 0.007 and 0.00003. within a repeated measures, mixed model framework
using eight phenotypes assessed separately—is
computa-DISCUSSION tionally demanding (estimated at.400 hr for
permuta-tion analysis). Consequently, a 1000-repetipermuta-tion permuta- The intent of this project has been (1) to develop a generalized system for experimental QTL analysis in tion test to determine experimentwise critical values
was not performed; rather, all comparisonwise P values heterozygous-parent cross mice, (2) to show how the system can be used to examine several traits
simultane-,0.001 are reported.
The composite interval method confirmed three can- ously within a single population of animals, and (3) to identify novel loci that affect T lymphocyte subsets in an didate QTL associations observed in the single-marker
analysis: CD4 with chromosomes 9 and 15, and CD8P age-associated manner. Unlike conventional F2 or back-cross analysis systems, the heterozygous-parent method with chromosome 9. In addition, new associations were
identified that indicate candidate loci within intervals. uses inbred progenitor strains that are not chosen for variation of a specific phenotype. Rather, the strains were For example, the candidate QTL for CD8M levels on
chromosome 11 is detected 4 cM from D11Mit2 and 5 selected, from among the well-characterized inbred lines, to provide significant genetic heterogeneity. The cM from D11Mit83.
Post hocanalysis of candidate marker-phenotype asso- progenitor strains have been examined for genetic
rela-tionships by historical analysis and protein polymor-ciations: Post hoc tests were used to gain a more detailed
790
A.
U.
Jackson
et
al.
TABLE 3
Single-marker analysis: associations with experimentwise significance ofP,0.05
Experimentwise P valuesa Estimated effect, % (standard error)b
Time Allelic Maternal3 Variance explained Post hoc Trait Marker Location (cM) P value effect (mo) effect Maternal Paternal paternal (%)c commentsd
CD3 None CD8 None
CD4 D9Mit104 CH9, 33 0.01 8 Paternal 4.99 (1.70) 6.79 (1.71) 6.27 (2.30) 13.5 C3.D2 D15Mit63 CH15, 28 0.01 18 Maternal 10.75 (2.97) 3.24 (2.11) 8.81 (3.68) 12.7 B6.C
CD8M D12Mit105 CH12, 6 0.01 Maternal 9.59 (1.80) NA NA B6.C
D12Mit46 CH12, 13 0.03 Maternal 11.67 (2.75) 9.18 (2.66) 13.43 (3.82) B6.C
CD4M D12Mit34 CH12, 23 0.03 Maternal 6.28 (1.73) NA NA C.B6
D17Mit221 CH17, 52 0.02 8 Maternal3 2.84 (3.18) 2.80 (8.18) 16.73 (4.52) 21.3 C/C3.all
paternal others
CD8P D8Mit112 CH9, 17e 0.04 Maternal3 8.51 (3.00) 7.73 (2.93) 14.52 (4.10) Complex paternal
CD4P D9Mit110 CH9, 44 0.02 18 Paternal 6.00 (2.94) 10.53 (2.82) 12.40 (4.19) 11.2 D2.C3 CD4V D4Mit155 CH4, 48 0.01 18 Paternal 8.26 (4.03) 15.12 (4.15) 14.02 (5.94) 12.6 D2.C3
aThe experimentwise P values take into account the effect of examining markers across the entire genome using a permutation test. All values are for repeated time measures (i.e., include the effect of both 8- and 18-mo data) unless indicated. “Maternal” and “paternal” indicate an effect of the maternally or paternally inherited alleles at the locus only, while “maternal3paternal” indicates an interaction between alleles.
bThe magnitude of the estimated effect of the QTL is shown as percentage, with standard errors listed in parentheses. “Maternal” and “paternal” indicate the effect of the maternally or paternally inherited alleles at the locus, while “maternal3paternal” gives the interaction of both alleles. NA, not applicable; loci with genotyping assays that are informative for only one allele.
cThe proportion of phenotypic variance explained by a QTL is the difference of the R2for the regression models with and without the effect of the tested QTL. The
percentage of variance explained for single time measures cannot be generalized to repeated measures; therefore, the proportion of variance explained is given for single time measurements only.
dPost hoc analysis identified the specific allele(s) associated with the QTL effect. The parental alleles influencing the relative T cell subset levels are indicated. Interactions that are both allele- and time-specific are given as “complex.”
791
Multiple-Trait
QTL
Analysis
TABLE 4
Composite interval mapping: associations with comparisonwise significanceP,0.001
Comparisonwise P valuesa Estimated effect, % (standard error)b
Time Allelic Maternal3 Variance explained Trait Interval Max. locus (cM)c P value effect (mo) effect Maternal Paternal paternal (%)d
CD3 None
CD8 D12Mit105-D12Mit46 CH12, 6 0.0004 18 Maternal 8.8 (2.3) NA NA 26.9
CD4 D1Mit221-D1Mit17 CH1, 105 0.0008 8 Paternal 4.1 (3.0) 8.1 (2.3) 8.3 (3.3) 10.5 D7Mit76-D7Mit25 CH7, 11 0.0008 8 Maternal 8.7 (2.5) 5.1 (2.6) 9.3 (3.4) 10.9 D8Mit112-D9Mit104 CH9, 31e 0.0005 8 Paternal 10.1 (3.0) 10.9 (3.0) 11.8 (3.6) 16.1 D15Mit100-D15Mit63 CH15, 27 0.0004 18 Maternal 11.1 (3.0) 1.6 (2.4) 8.5 (3.8) 12.8 CD8M D1Mit206-D1Mit221 CH1, 98 0.0005 Overall 6.8 (4.4) 15.9 (4.8) 3.1 (5.8)
D5Mit79-D5Mit205 CH5, 18 0.0005 Maternal3 3.6 (3.8) 6.9 (3.6) 16.1 (4.5) paternal
D5Mit205-D5Mit25 CH5, 41 0.0003 8 Maternal3 9.0 (5.4) 4.4 (5.6) 25.5 (6.7) 19.8 paternal
D11Mit2-D11Mit83 CH11, 8 0.0003 18 Maternal3 20.7 (7.6) 19.1 (7.9) 42.1 (11.0) 22.6 Paternal
D17Mit46-D17Mit47 CH17, 17 0.00003 Overall 1.9 (3.4) 11.5 (3.2) 10.9 (4.8) D17Mit47-D17Mit221 CH17, 23 0.0002 Overall 10.9 (5.6) 13.5 (4.4) 8.4 (6.2) CD4M D11Mit2-D11Mit83 CH11, 4 0.0002 Paternal 10.3 (4.8) 15.3 (4.8) 14.4 (6.8) CD8P D8Mit112-D9Mit104 CH9, 17e 0.0002 Maternal3 9.0 (3.8) 10.9 (3.9) 18.3 (4.8)
paternal
D9Mit104-D9Mit110 CH9, 34 0.0005 8 Maternal 27.5 (7.6) 23.9 (7.7) 18.9 (8.3) 15.9
D12Mit46-D12Mit63 CH12, 16 0.0009 18 Maternal 32.1 (9.01) NA NA 24.2
CD4P D4Mit155-D4Mit170 CH4, 69 0.0005 8 Maternal3 6.9 (2.8) 6.7 (3.0) 15.2 (4.2) 18.9 paternal
CD4V None
aThe comparisonwise P values do not take into account the effect of examining markers across the entire genome. All values are for repeated time measures (i.e., include the effect of both 8- and 18-mo data) unless indicated. “Maternal” and “paternal” indicate an effect of the maternally or paternally inherited alleles at the locus only, while “maternal3paternal” indicates an interaction between alleles, and “overall” includes all interaction at the locus. Only the most signficant result for each QTL is described. bThe magnitude of the estimated effect of the QTL is shown as percentage, with standard errors listed in parentheses. “Maternal” and “paternal” indicate the effect of the maternally or paternally inherited alleles at the locus, while “maternal3paternal” gives the interaction of both alleles. NA, not applicable; loci with genotyping assays that are informative for only one allele.
cThe highest significance P value is given in centimorgans from the mouse chromosome centromere.
dThe proportion of phenotypic variance explained by a QTL is the difference of the R2for the regression models with and without the effect of the tested QTL. The
percentage of variance explained for single time measures cannot be generalized to repeated measures; therefore, the proportion of variance explained is given for single time measurements only.
792 A. U. Jackson et al.
Figure1.—Association between locus D12Mit-105 and CD8M levels. The effect of the maternal-derived allele (B6 vs. C) is shown for the 8-mo and 18-mo timepoints. The histogram gives the distribution of animals in each phenotype range. In each panel, the P value is a post hoc comparison of the two genotypic groups. At both assay time-points a significant difference is seen in the group means (B6 allele.C allele).
variation at standard SSLP loci (Atchley and Fitch study represent candidates for factors influencing CD8M cells (CH1, CH5, CH11, CH12, CH17), CD4M 1991;Dietrichet al. 1992).
T cell subset populations provide an attractive com- cells (CH11, CH12, CH17), and CD4V cells (CH4), as well as CD4P (CH4, CH9) and CD8P cells (CH9, CH12). plex system for analysis, since some subset populations
undergo reproducible change across the life span The initial survey did not identify loci that were associ-ated with levels, or rates of change, of groups of age-(Miller1996). The levels of multiple subtypes can be
assayed from a single, small blood sample with little sensitive T cell subsets. Thus even though high CD4M, high CD8M, and low CD4V levels tend to be associated impact on the animal. Identification of novel genetic
loci affecting T cell subsets—and their regulation over with one another in UM-HET3 mice (Miller1997) and in a different stock of heterozygous-parent-derived mice the life course—may be useful for understanding the
components of age-dependent change in immune func- (Milleret al. 1994), we did not note any loci that had strong effects on two or more of these three subsets. Com-tion. Studies of age-associated changes in T cell subsets
in both humans and mice strongly suggest that aging posite interval mapping did identify regions of chromo-somes 11 and 17 that may affect CD4M and CD8M; how-leads to an increase in the proportion of memory T
cells and a reciprocal decrease in the proportion of ever, the allelic influence was not consistent across the phenotypes. A larger population of HET animals should virgin T cells; the proportion of cells expressing
P-glyco-protein also increases in both the CD4 and CD8 popula- provide increased statistical power to detect QTL that may coordinately influence groups of traits. The data tions (Milleret al. 1994). The QTL identified in this
793 Multiple-Trait QTL Analysis
At the initial, exploratory stage of analysis we have used an arbitrary significance level of P,0.001 to identify candidate regions for future analysis.
Additional phenotypes may be obtained in longitudi-nal heterozygous-parent sibships, including measures of serum components, morphology, behavior, or response to chemical treatments. Several issues relate to using the system, however. First, the progenitor strains must harbor genetic variants at relevant loci. Preliminary phe-notypic analysis of inbred or F1 animals may not be useful in this regard, because the sibship progeny will not reestablish either the F1heterozygote or inbred ho-mozygote allelic relationships at any locus. Second, be-Figure 3.—Association between locus D17Mit221 and
cause each animal has a unique combination of the CD4M levels. Memory CD4 T cell level phenotype distributions
progenitor alleles across its genome, the candidate loci are given as "box-and-whisker" plots for each of the four
geno-typic groups in the population (box, standard error of mean; must have significant phenotypic effects even within a whisker, 1 SD). Post hoc comparison of C/C3 heterozygotes genetically heterogeneous population. Third, because with the other three genotype groups shows a significant differ- no formal homozygote class exists in the progeny, only ence in mean values, in each case.
“dominant” effects may be observed unless two progeni-tor strains contribute similar recessive alleles, presum-ably reflecting shared ancestry (see Figure 3 for an ex-do suggest that a locus close to D12Mit34 may influence
CD4M levels in an age-dependent manner. High levels ample). Last, in the current CB6F13C3D2F1breeding scheme, only four of the six possible allelic pairings are of CD4M cells are associated with relatively short life
span in UM-HET3 mice (Milleret al. 1997), and it will obtained. An orthogonal cross such as CD2F13B6C3F1 might be used to ensure complete sampling of the pro-be of interest to see if loci that influence CD4M levels
also affect life span and disease risk in these mice. genitor variation.
In this initial study, two methods of statistical analysis Even in a relatively modest population of 145
UM-HET3 animals, candidate QTL of biological interest were used to identify chromosomal regions with an ef-fect on quantitative values for immune cell populations. have been identified. In the analysis using single locus,
repeated measures analysis of variance, six of the eight Neither analysis is ideal, however. The single-marker analysis using Proc Mixed is straightforward and takes immune cell phenotypes are associated with at least one
marker locus at experimentwise significance P, 0.05. advantage of permutation tests to assess experimentwide significance. The method is a general parametric model Caution is needed in the interpretation of these QTL,
however. First, the associations may not be independent, and can accept data that exhibit unequal size classes and unequal variance among classes. The method also because genetic and nongenetic factors could lead to
correlations among the traits. For example, a QTL asso- does not eliminate individuals with incomplete data. This is particularly important in longitudinal analysis, ciated with CD8M maps to mouse chromosome 17 in
the region of H-2, the major histocompatibility region where some individuals have phenotype information at only one of the two assay timepoints. The method does (≈20 cM). Next, the large number of marker-phenotype
comparisons presents a challenge for assessing statistical not take advantage of flanking marker information and does not account for possible multiple-linked QTL. significance. This has been addressed using a
permuta-tion test for the single locus repeated measures model Composite interval mapping methods (Zeng1994), on the other hand, combine interval mapping (Lander (Table 3). However, the repeated measures composite
interval mapping model (Table 4) generated only nomi- andBotstein 1989) with multiple regression analysis to use all the available mapping data and obtain a more nal significance levels without adjustment for multiple
comparisons. The determination of experimentwise sig- precise localization of the QTL. The composite interval method provides a test statistic on a marker interval that nificance levels by permutation analysis is
computation-ally impractical at this time. The simplest treatment is designed to be unaffected by QTL located outside the defined interval. However, because the composite would reduce the incidence of false-positive associations
by setting an experimentwisea 50.05 using the Bonfer- interval method uses more genotypic data it can result in lower power to detect QTL, especially in studies with roni correction for multiple comparisons. In the
com-posite interval model, eight traits, three time-dependent small sample size (Zeng1994).
The strengths and weaknesses of the two analysis mod-values, and 64 interval locations were examined, giving
0.05/(836433)53.33102550.000033. However, els can provide an explanation for the differences seen between Tables 3 and 4. For example, composite inter-because the assumption of independence of measures
794 A. U. Jackson et al.
some 5 QTL was observed in single-point analysis. The power of the heterozygous-parent cross approach for discovering new genetic influences thus can be in-QTL location is roughly midway across the interval
D5Mit205-D5Mit25, 8 cM from D5Mit205 and 5 cM from creased dramatically by parallel assessment of multiple traits of interest.
D5Mit25. Locations at a distance from typed markers
are weakly characterized by single-point analysis, as ex- The authors acknowledge the professional staff of the University pected (LanderandBotstein1989). Conversely, some of Michigan Unit for Laboratory Animal Medicine; technical assis-tance from Erin Belloli, Julie Kim, Luann Linsalata, Jennifer McGrath,
candidate QTL observed in single-point analysis do not
and Lisa Mullins; and advice from numerous National Institute on
reach comparable significance levels using composite
Aging, Longevity Assurance Gene Consortium members and Dr. S.
interval mapping methods. The CD4M single-point
analy-Xu at the University of California, Riverside. The research was
per-sis candidate QTL on chromosomes 12 and 17 (Table 3) formed with funding from the National Institutes of Health (NIH), were each observed during composite interval analysis, National Institute on Aging, grants R01-AG11687 and R01-AG08808. A.U.J. is supported by an NIH predoctoral training grant in genomic
but at much lower significance (not shown). In these
sciences T32-HG00040; D.T.B. was funded in part by a Searle Scholar
cases, incorporation of the flanking data information
Fellowship from the Chicago Community Trust.
increased the quantity of data used in the test and, presumably, decreased the overall confidence.
Ultimately, the statistical ambiguities associated with
LITERATURE CITED any initial QTL result require experimental
confirma-tion. Because the UM-HET3 population is generated Atchley, W. R.,andW. M. Fitch,1991 Gene trees and the origin of inbred strains of mice. Science 254: 554–558.
from commercially available, highly fecund F1 stocks,
Chrisp, C. E., P. Turke, A. Luciano, S. Swalwell, J. Petersonet
producing additional full-sibling mice is simple and in- al., 1996 Lifespan and pathology in genetically heterogeneous
(four-way cross) mice: a new model for aging research. Vet.
Pa-expensive. If phenotypic distributions are replicated in
thol. 33: 735–743.
additional populations, the data may be merged. The
Churchill, G. A.,andR. W. Doerge,1994 Empirical threshold
availability of a high-density mouse SSLP marker map— values for quantitative trait mapping. Genetics 138: 963–971.
Covelli, V., D. Mouton, V. Di Majo, Y. Bouthillier, C. Bangrazi
with known polymorphisms among the four progenitor
et al., 1989 Inheritance of immune responsiveness, life span,
strains—should allow rapid genetic refinement of
candi-and disease incidence in interline crosses of mice selected for
date QTL. Together, the increased power should pro- high or low multispecific antibody production. J. Immunol. 142:
1224–1234.
vide a rational process for improving QTL significance
Dietrich, W. F., H. Katz, S. E. Lincoln, H.-S. Shin, J. Friedman
and accurate genetic localization. Phenotype
informa-et al. 1992 A genetic map of the mouse suitable for typing
tion from a second replicate CB6F13C3D2F1population intraspecific crosses. Genetics 131: 423–447.
Dietrich, W. F., J. C. Miller, R. G. Steen, M. Merchant, D. Damron
(128 animals) shows T cell population distributions
con-et al., 1994 A genetic map of the mouse with 4006 simple
se-sistent with the UM-HET3 population and preliminary
quence length polymorphisms. Nat. Genet. 7: 220–245.
confirmation of D12Mit105 association with CD8M cell Frankel, W. N., 1995 Taking stock of complex trait genetics in
mice. Trends Genet. 11: 471–477.
levels (not shown).
Gelman, R., A. Watson, R. BronsonandE. Yunis,1988 Murine
The heterozygous-parent cross system is particularly
chromosomal regions correlated with longevity. Genetics 118:
suitable for analysis of the genetic basis of aging and 693–704.
Haley, C. S.,andS. A. Knott,1992 A simple regression method
age-associated traits. It is not yet clear to what extent
for mapping quantitative trait loci in line crosses using flanking
the various aspects of the aged phenotype, including
markers. Heredity 69: 315–324.
changes in many physiological systems and biochemical Jiang, C.,andZ.-B. Zeng,1995 Multiple trait analysis of genetic
mapping for quantitative trait loci. Genetics 140: 1111–1127.
variables, are coordinately regulated. It is probable that
Johnson, T. E.,1987 Aging can be genetically dissected into
compo-many of the individual traits that distinguish young from
nent processes using long-lived lines of Caenorhabditis elegans.
aged individuals may be under separate genetic control, Proc. Natl. Acad. Sci. USA 84: 3777–3781.
Knott, S. A.,andC. S. Haley,1992 Aspects of maximum likelihood
but it also seems possible that some loci may influence
methods for mapping quantitative trait loci in line crosses. Genet.
the extent or rate of change in several age-sensitive
Res. 60: 139–151.
systems. Multiple phenotypes have been used to exam- Korol, A. B., Y. I. RoninandV. M. Kirzhner,1995 Interval mapping
of quantitative trait loci employing correlated trait complexes.
ine common influencing QTL in standard F2 or
back-Genetics 140: 1137–1147.
cross strategies (JiangandZeng1995;Korolet al. 1995).
Lander, E. S.,andD. Botstein,1989 Mapping mendelian factors
Selective breeding studies in Drosophila (Rose 1991) underlying quantitative traits using RFLP linkage maps. Genetics
121:185–199.
and mice (Covelliet al. 1989), and analyses of
recombi-Lander, E. S.,andN. J. Schork,1994 Genetic dissection of complex
nant inbred nematodes (Johnson 1987) and mice
traits. Science 265: 2037–2048.
(Gelmanet al. 1988) have all shown that life span can Miller, R. A.,1996 Aging and the immune response, pp. 355–392
in Handbook of the Biology of Aging, edited byE. L. Schneiderand
be regulated by genetic variants within these species.
J. W. Rowe.Academic Press, San Diego.
The ways in which the timing of late-life events might be
Miller, R. A.,1997 Age-related changes in T cell surface markers:
regulated synchronously or asynchronously by genetic a longitudinal analysis in genetically heterogeneous mice. Mech.
Ageing Dev. 96: 181–196.
factors deserve greater consideration. Although
genome-Miller, R. A., P. Turke, C. Chrisp, J. Ruger, A. Lucianoet al., 1994
wide scans and assessment of late-life phenotypes are
Age-sensitive T cell phenotypes covary in genetically
heteroge-inherently costly for large populations, the marginal neous mice and predict early death from lymphoma. J. Gerontol.
49:B255–B262.
795 Multiple-Trait QTL Analysis
Miller, R. A., F. Bookstein, J. H. van der Meulen, S. Engle, J. Kim ing: A Laboratory Manual, Ed. 2. Cold Spring Harbor Laboratory et al., 1996 Candidate biomarkers of aging: age-sensitive indices Press, Cold Spring Harbor, NY.
of immune and muscle function co-vary in genetically heteroge- Soller, M. T., T. Brody andA. Genizi,1976 On the power of neous mice. J. Gerontol. Biol. Sci. 52A: B29–B47. experimental design for the detection of linkage between marker
Miller, R. A., C. ChrispandA. Galecki,1997 CD4 memory T cell loci and quantitative loci in crosses between inbred lines. Theor. levels predict lifespan in genetically heterogeneous mice. FASEB Appl. Genet. 47: 35–39.
J. 11: 775–783. Xu, S.,1996 Mapping quantitative trait loci using four-way crosses.
Rose, M. R.,1991 Evolutionary Biology of Aging. Oxford University Genet. Res. 68: 175–181.
Press, New York. Zeng, Z.-B.,1994 Precision mapping of quantitative trait loci.
Genet-Rowe, L. B., J. H. Nadeau, R. Turner, W. N. Frankel, V. A. Letts ics 136: 1457–1468.
et al., 1994 Maps from two interspecific backcross DNA panels
available as a community resource. Mamm. Genome 5: 253–274. Communicating editor:T. F. C. Mackay