Copyright2000 by the Genetics Society of America
Cladistic Structure Within the Human
Lipoprotein Lipase
Gene and Its
Implications for Phenotypic Association Studies
Alan R. Templeton,* Kenneth M. Weiss,
†,‡Deborah A. Nickerson,
§Eric Boerwinkle**
and Charles F. Sing
††*Department of Biology, Washington University, St. Louis, Missouri 63130-4899,†Institute of Molecular Evolutionary Genetics, Department of Biology, and‡Department of Anthropology, Pennsylvania State University, University Park, Pennsylvania 16802, §Department of Molecular Biotechnology, University of Washington, Seattle, Washington 98195-7730, **Human Genetics Center,
University of Texas Health Science Center, Houston, Texas 77225-0334 and††Department of Human Genetics, University of Michigan Medical School, Ann Arbor, Michigan 48109-0618
Manuscript received January 10, 2000 Accepted for publication June 29, 2000
ABSTRACT
Haplotype variation in 9.7 kb of genomic DNA sequence from the humanlipoprotein lipase(LPL) gene was scored in three populations: African-Americans from Jackson, Mississippi (24 individuals), Finns from North Karelia, Finland (24), and non-Hispanic whites from Rochester, Minnesota (23). Earlier analyses had indicated that recombination was common but concentrated into a hotspot and that recurrent mutations at multiple sites may have occurred. We show that much evolutionary structure exists in the haplotype variation on either side of the recombinational hotspot. By peeling off significant recombination events from a tree estimated under the null hypothesis of no recombination, we also reveal some cladistic structure not disrupted by recombination during the time to coalescence of this variation. Additional cladistic structure is estimated to have emerged after recombination. Many apparent multiple mutational events at sites still remain after removing the effects of the detected recombination/gene conversion events. These apparent multiple events are found primarily at sites identified as highly mutable by previous studies, strengthening the conclusion that they are true multiple events. This analysis portrays the complex-ity of the interplay among many recombinational and mutational events that would be needed to explain the patterns of haplotype diversity in this gene. The cladistic structure in this region is used to identify four to six single-nucleotide polymorphisms (SNPs) that would provide disequilibrium coverage over much of this region. These sites may be useful in identifying phenotypic associations with variable sites in this gene. Evolutionary considerations also imply that the SNPs in the 3⬘region should have general utility in most human populations, but the 5⬘SNPs may be more population specific. Choosing SNPs at random would generally not provide adequate disequilibrium coverage of the sequenced region.
C
ORONARY artery disease (CAD) is the major cause general population and variation in candidate loci such asLPL.There are many ways of analyzing such associa-of death in many countries, and several genetictions (Templeton et al. 1987; Templeton and Sing
and nongenetic risk factors have been identified (Sing
1993;Templeton 1996;Longet al. 1998; Lymanand andSkolnick 1979; Rao et al.1984; Sing et al. 1995;
Mackay 1998). One method is the nested cladistic
Boerwinkleet al.1996). Among the genetic factors is
method in which the evolutionary history of the haplo-the humanLipoprotein Lipase (LPL) locus. For this
rea-type variation is estimated and used as a statistical design son,Nickersonet al.(1998) sequenced and described
to test for phenotypic associations (Templeton et al.
allelic variation in a 9.7-kb region within this locus in
1987; Templeton and Sing 1993; Templeton 1996). 71 individuals from three populations that differ greatly
Such an approach requires that a substantial fraction in incidence of CAD.Clarket al.(1998) described the
of variation in the gene is cladistically structured and haplotype structure of that variation, and Templeton
that these evolutionary relationships among the
ob-et al.(2000) examined the roles of recombination and
served haplotypes can be estimated. The nested design mutation as sources of haplotype variation. The ultimate
is tolerant of some error or ambiguity in the estimated purpose of these studies is to investigate associations
evolutionary structure (TempletonandSing1993). between phenotypic variation in CAD and in
intermedi-Templetonet al.(2000) showed that recombination ate phenotypes (such as serum cholesterol levels) in the
is common within this 9.7-kb region of LPL and that nearly half of the variable sites in this segment ofLPL
occur at a small number of sites with highly mutable
Corresponding author:Alan R. Templeton, Department of Biology,
motifs. Both of these features can complicate the
estima-Campus Box 1137, Washington University, St. Louis, MO 63130-4899.
E-mail: [email protected] tion of cladistic structure, with recombination being
the more worrisome. However, a cladistic approach to tionary history, amount of recombination, and patterns of mutation can be used to identify a small number of phenotype association studies does not require a
com-plete absence of recombination. Indeed, this approach single nucleotide polymorphisms (SNPs) that could be used in phenotypic association studies through linkage can yield better biological insights when some
recombi-nation is present because in those cases inferences about disequilibrium. the physical location of causative variation are possible,
whereas in the complete absence of recombination it
MATERIALS AND METHODS
is possible to localize markers of association only in the
temporal/historical framework of the haplotype tree Population samples:We use the data ofNickerson et al. (Templeton et al. 1987; Templeton and Sing 1993; (1998) andClarket al.(1998) on three human samples: (1)
Markhamet al.1996;Templeton1996;Keavneyet al. a Jackson, Mississippi, sample (n ⫽ 24) that is part of an ongoing National Heart, Lung, and Blood Institute study of
1998). However, these previous successful applications
hypertension in African-Americans; (2) a sample from the
of the cladistic approach occurred in DNA regions in
FINRISK study from North Karelia (n⫽24), an area in eastern
which recombination was present but rare. In contrast,
Finland that has had the world’s highest known CAD risk and
our analyses of the 9.7-kb region of theLPLgene indi- that has been studied for many years (Tunstall-Pedoeet al. cate that recombination is not only present, but is com- 1994); and (3) a sample from the Rochester Family Heart Study (n⫽23), a study of cardiovascular disease risk in the
mon at particular regions within this gene (Clarket al.
Rochester, Minnesota, area.
1998;Templetonet al.2000). Fortunately, the
recombi-DNA sequencing:DNA sequencing was performed on
dip-nation events are concentrated into a 1.9-kb region
loid genotypes as described inNickersonet al.(1998),
fol-within this 9.7-kb segment (Templeton et al. 2000). lowed by extensive confirmatory resequencing and data Therefore, subregions in which recombination is absent validation procedures (Clark et al. 1998; Nickerson et al. 1998). TheLPLreference sequence is available in GenBank
or rare can be identified, and the evolutionary structure
(http://www.ncbi.nlm.nih.gov/Web/Genbank, accession no.
of each subregion can be estimated separately (
Tem-AF050163).
pletonandSing1993). Templetonet al.(2000) also Haplotype determination:Haplotypes were determined by found that three motifs previously discovered to be asso- a mixture of allele-specific PCR (AS-PCR) and the haplotype ciated with high mutability display rates of variation one subtraction algorithm ofClark(1990), followed by extensive confirmatory analyses (Clarket al.1998) that indicate a high
to two orders of magnitude higher than sites not known
degree of confidence. Nevertheless, many haplotypes were
to be highly mutable. This high frequency of variation
not observed directly, so not all haplotypes are known with
at a small number of sites raises the possibility that these
certainty. The analyses in this article are therefore conditional
sites have experienced more than one mutational event. on the haplotype inferences made in Clark et al. (1998). The first goal of this article is to show that there is Nickersonet al.(1998) revealed a total of 88 variable sites in the 9.7-kb region. Length variation at a tetranucleotide
indeed considerable cladistic structure in the 5⬘and 3⬘
repeat was excluded from haplotype determination as this
portions of this 9.7-kb segment that flank the region
variation does not fall under the same evolutionary models
of high recombination identified byTempleton et al.
as the other variable sites (Clark et al. 1998).Clark et al.
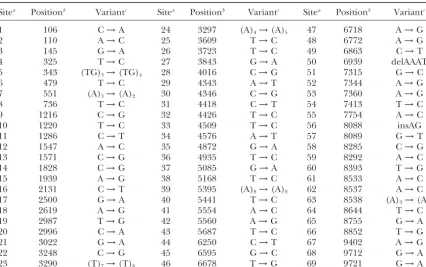
(2000). A second goal of this article is to reconstruct (1998) determined the linkage phase of 69 of the remaining the evolutionary history of the entire sequenced region 87 variable sites for which the rarer variant was found in at least three chromosomes. These 69 variable sites (Table 1)
by removing the inferred statistically significant
recom-determined a total of 88 distinct haplotypes (Clark et al.
bination and gene conversion events from the
evolution-1998).
ary “tree” estimated inTempletonet al.(2000) under Inference of cladistic structure when recombination is pres-the null hypopres-thesis of no recombination or gene conver- ent:Figure 1 presents the overall flowchart for inferring cladis-sion. In this manner, we intend to separate that portion tic structure used in this article. Figure 1 also illustrates our inference procedure with a fictional data set that makes the
of the cladistic structure of this candidate gene region
steps easier to follow than with the much more complicated
that has never been disrupted by recombination from
LPLdata set. Step 1 in Figure 1 starts with known haplotypes,
that portion of the cladistic structure that arose due
just as we start with theLPLhaplotypes given inClarket al.
to mutational accumulation after recombination. The (1998).
estimated nonrecombinant and postrecombinant cla- The second step is to estimate the statistical parsimony (SP) tree for the entire DNA region under the null hypothesis of
distic structure will be validated against the evolutionary
no recombination or gene conversion. Statistical parsimony
structure estimated in the 5⬘and 3⬘flanking subregions
was specifically designed for estimating intraspecific haplotype
that display little evidence for recombination.
trees (Templetonet al.1992). Standard maximum parsimony
A third goal of this article is to use the subregional, minimizes the total number of mutational steps in the tree, nonrecombinant, and postrecombinant trees to exam- but under a neutral model of intraspecific evolution, it is unlikely (in a quantifiable fashion) for haplotypes that are
ine the possible role of multiple mutational events at
separated by only one or very few nucleotide differences to
highly mutable sites as a source of homoplasy. The
have experienced multiple mutational hits at the few sites by
fourth goal of this article is to show how the results of
which they differ. Haplotypes that differ at many nucleotides
such an evolutionary/recombinational analysis can be are more likely to have experienced multiple mutational hits. applied to the problem of genetic/phenotypic associa- Hence, statistical parsimony gives precedence to connections
between haplotypes that differ by one or a few nucleotides
evolu-TABLE 1
Sequence variants used to define haplotypes in theLPLlocus
Sitea Positionb Variantc Sitea Positionb Variantc Sitea Positionb Variantc
1 106 C→A 24 3297 (A)4→(A)5 47 6718 A→G
2 110 A→C 25 3609 T→C 48 6772 A→G
3 145 G→A 26 3723 T→C 49 6863 C→T
4 325 T→C 27 3843 G→A 50 6939 delAAAT
5 343 (TG)3→(TG)4 28 4016 C→G 51 7315 G→C
6 479 T→C 29 4343 A→T 52 7344 A→G
7 551 (A)3→(A)2 30 4346 C→G 53 7360 A→G
8 736 T→C 31 4418 C→T 54 7413 T→C
9 1216 C→G 32 4426 T→C 55 7754 A→C
10 1220 T→C 33 4509 T→C 56 8088 insAG
11 1286 C→T 34 4576 A→T 57 8089 G→T
12 1547 A→C 35 4872 G→A 58 8285 C→G
13 1571 C→G 36 4935 T→C 59 8292 A→C
14 1828 C→G 37 5085 G→A 60 8393 T→G
15 1939 A→G 38 5168 T→C 61 8533 A→C
16 2131 C→T 39 5395 (A)8→(A)9 62 8537 A→C
17 2500 G→A 40 5441 T→C 63 8538 (A)3→(A)2
18 2619 A→G 41 5554 A→C 64 8644 T→C
19 2987 T→G 42 5560 A→G 65 8755 G→A
20 2996 C→A 43 5687 T→C 66 8852 T→G
21 3022 G→A 44 6250 C→T 67 9402 A→G
22 3248 C→G 45 6595 G→C 68 9712 G→A
23 3290 (T)7→(T)8 46 6678 T→G 69 9721 G→A
FromNickersonet al.(1998).
aA site number is assigned to each variable character used to define haplotypes in order from 5⬘to 3⬘. bPosition in the baseline sequence (GenBank accession no. AF050163).
cSubstitution and insertion/deletion variants are reported as the state in the baseline sequence→alternative state.
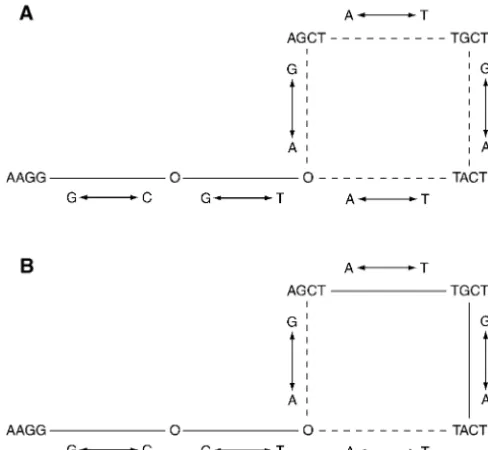
and preferentially allocates multiple hits to long branches. The experienced little internal recombination, we estimate sepa-rate haplotype trees in the 5⬘subregion (variable sites 1–18) difference between these two methods is illustrated in Figure 2.
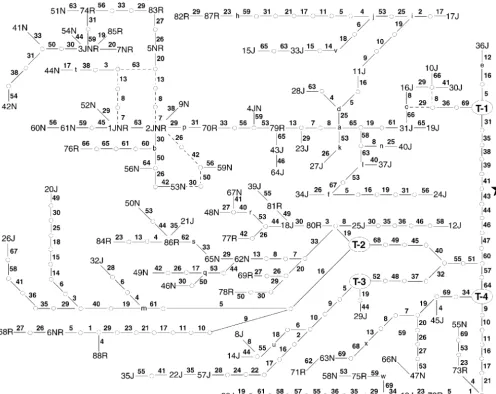
Step 2 has also been completed for the entire 9.7-kbLPLregion and in the 3⬘subregion (36–69), thereby excluding the recom-binational hotspot (19–35) from the analysis. When using only (Templetonet al.2000) and is shown in Figure 3.
Step 3 in Figure 1 is the estimation and testing of recombina- a subset of the sites, many of the original haplotypes collapse into a common state. Tables 2 and 3 present these collapsed tion and gene conversion events with the haplotypes given in
step 1 through the use of the algorithm given inCrandall haplotype categories for the 5⬘and 3⬘ regions, respectively. Although the 5⬘and 3⬘regions have very little internal recom-andTempleton(1999) with additions given inTempleton
et al.(2000). This phase of the inference sequence has also bination, there is some (Templetonet al.2000). The haplo-types that are the products of recombination or the descen-been completed with theLPLhaplotypes (Templeton et al.
2000). A total of 29 recombination events statistically signifi- dants of the initial recombinant within each subregion are excluded when the cladistic structure of that subregion is cant at the 5% level and 1 significant gene conversion event
were detected. The details of the inferred recombination estimated, as recommended byTempletonet al.(1987). Two recombination events (numbers 12 and 21, available at the events are available at the MDECODE website (http://
www.mdecode.umich.edu/). Twenty-four of the 29 significant MDECODE website) are contained within the 5⬘ subregion, leading to the exclusion of the haplotypes found in the re-recombination events were clustered between variable sites 19
(2987 in the map ofNickersonet al.1998) and 35 (4872 in sulting recombinant categories 5⬘-9 and 5⬘-10 in Table 2. In addition, the inferred gene conversion event took place within theLPLmap). Therefore, sites 1–18 in Table 1 are used to
define the 5⬘flanking region to the recombinational hotspot, the 5⬘region, leading to the exclusion of its product, haplotype 20J. The 3⬘region had three inferred internal recombination and sites 36–69 are used to define the 3⬘flanking region.
In step 4 we remove the impact of recombination upon events (recombination events 5, 13, and 29 at the MDECODE website), thereby leading to the exclusion of haplotypes 76R, the cladistic structure. Two different approaches are used,
indicated by 4a and 4b in Figure 1. We proceed to step 4a in 15J, 63N, and 71R.
Steps 4b and 5b (Figure 1) show an alternative and novel our inference procedure only if the recombination
encoun-tered in step 3 is either rare and/or concentrated into hot- method for removing the effects of recombination and esti-mating cladistic structure in a DNA region that has experi-spots, as is true for LPL. Step 4a is to subdivide the DNA
region into smaller segments that show little or no internal enced recombination. Step 4b removes all the recombination events inferred in step 3 from the SP tree estimated for the recombination. This is then followed by step 5a: estimating
separate SP trees for each subregion. Since step 3 indicated entire region obtained in step 2. By removal, we mean that the recombinant haplotype itself is removed from the SP tree, that the 5⬘ subregion ofLPLdefined by variable sites 1–18
Figure1.—An inference flowsheet il-lustrated by a fictional data set. Step 1 is to obtain the haplotype data, and in the fictional data set 11 haplotypes (labeled A–K) are present. Step 2 is to estimate the SP tree of the haplotypes found in step 1 under the assumption of no recombination or gene conver-sion. In the tree for the fictional data, each line represents a single nucleo-tide substitution, and a 0 indicates an inferred intermediate haplotype that is necessary to interconnect haplo-types found in step 1 but that is not present in the actual sample. In step 3, the Crandall and Templeton
(1999) algorithm (C&T) is applied to the SP tree to identify statistically significant recombination events. For the fictional data set, a single recom-bination event is detected, with hap-lotype F being the recombinant and haplotypes E and K being candidates for the parental types. In step 4a, the gene region is split into subsegments with little or no internal recombina-tion. For the fictional data set, the sequences are split into the three nu-cleotides 5⬘of the single inferred re-combination position and the four nucleotides 3⬘to the recombination site. In step 5a, separate SP trees are then estimated for each subregion. The haplotypes in the fictional data set that are identical for the 5⬘ and 3⬘subregions are indicated in paren-theses below their respective 5⬘ and 3⬘sequence states. In step 4b, the de-tected recombination events are re-moved from the SP tree obtained in step 2. For the fictional data set, this step requires discarding the three mutational events interconnecting haplotypes E and F in the step 2 SP tree, as the C&T algorithm used in step 3 indicates that these three ho-moplasious “mutations” are not mutational events at all but rather are due to the recombination event. This step also requires the removal of the recombinant haplotypes from the SP tree (in this case haplotype F) and any other parts of the step 2 SP tree that are descended from the recombinant (in this case, haplotype G and the mutational transition interconnecting haplotypes F and G). This results in a subset of the step 2 SP tree that is called the peeled tree. The cladistic structure arising after recombination is also retained: in the fictional data set this consists of only haplotype F, the mutational transition connecting it to haplotype G, and haplotype G. In step 5b, the peeled tree and the postrecombinational tree(s) are collapsed into haplotype categories that reflect each subregion defined in step 4a. Boxes indicate haplotypes that are identical in the subregion under consideration. In step 6, the topologies of the trees obtained in step 5a are tested for consistency with the cladistic structures found in the 5⬘and 3⬘ends of the peeled and postrecombinant trees obtained in step 5b.
under theCrandallandTempleton(1999) algorithm are additional cladistic structure could have arisen in haplotype lineages derived from the recombinant haplotype. This postre-removed and discarded because they do not represent actual
mutational events, and all haplotypes and branches that are combinational cladistic structure is estimated in step 4b as those subsets of the SP tree estimated in step 2 that consist derived from the original recombinant haplotype by
subse-quent mutational events are removed. We refer to that portion of branches and haplotypes derived from each of the original recombinants by subsequent mutational events.
of the SP tree from step 2 that remains after this removal as
the “peeled tree,” reflecting the fact that the effects of all To see if these two methods of estimating cladistic structure in a recombining DNA region yield compatible results, we inferred recombination events have been peeled off the tree.
The peeled tree should ideally reflect the component of next collapse the cladistic networks estimated in step 4b by first considering only the 5⬘sites (1–18) and then the 3⬘sites haplotype diversity that has not been affected by
moplasy:Templetonet al.(2000) showed that nearly half of the polymorphic sites in LPL have mutagenic motifs. This high polymorphism frequency raises the possibility that such sites are also likely to experience multiple mutational events, leading to true homoplasies in the haplotype tree. Because the recombination rate is high in theLPLregion, most homo-plasies have been inferred to be caused by recombination and not mutation, and this obscures the role of mutation as a contributor to homoplasy. However, steps 4a and 4b are de-signed to eliminate the homoplasies due to inferred recombi-nation events. Hence, we examine every mutational event in the trees estimated in steps 4b, 5a, and 5b and note whether or not the mutated site was one of the mutagenic sites identified previously (Templetonet al. 2000). Because of sample size constraints, we then classify each site appearing in this esti-mated cladistic structure as having 0–1 homoplasies or ⬎1 homoplasy. A Fisher’s exact test is then applied to the resulting two-by-two table to test the null hypothesis no association be-tween mutagenic category (highly mutablevs.nonmutagenic) and homoplasy category (0–1 homoplasiesvs.ⱖ2).
RESULTS
Figure2.—A hypothetical example illustrating the differ- The first three steps in the inference chain (Figure 1) ence between maximum parsimony (A) and statistical
parsi-have already been completed and published in previous
mony (B). (A) The maximum parsimony networks that
in-articles for LPL (Clark et al. 1998; Templeton et al.
terconnect four haplotypes. An O indicates an inferred
2000). Moreover, our previous analysis (Templetonet
intermediate haplotype not present in the sample. Solid lines
indicate connections that are unique in the maximum parsi- al. 2000) had already identified the subregions that mony tree, whereas dashed lines indicate ambiguity. The lines would show little or no recombination (step 4a), as of ambiguity form a loop that can be broken at any of its four
indicated in the previous section. Hence, we begin our
sides to yield four distinct maximum parsimony networks,
presentation of the results with step 5a in Figure 1.
each with a total length of five mutations. (B) The statistical
Tree estimation of the subregions flanking the
recom-parsimony networks for the same haplotypes, under the
as-sumption that the limit of parsimony (as calculated inTem- binational hotspot (step 5a):Figures 4 and 5 show, re-pletonet al.1992) is one. This limit means that single nucleo- spectively, the SP trees estimated for the 5⬘and 3⬘ re-tide transitions that interconnect haplotypes that differ only
gions that flank the recombinational hotspot. The 5⬘
at a single nucleotide are regarded as certain. Thus, haplotypes
region has two statistically parsimonious solutions
(Fig-AGCT and TGCT differ by only a single nucleotide, so the
ure 4) for the haplotype categories given in Table 2.
direct connection between them is regarded as certain under
statistical parsimony, as is the connection between haplotypes Figure 5 shows the resulting statistical parsimony net-TGCT and TACT. Note that breaking the loop of ambiguity works for the remaining haplotypes as grouped into by discarding the branch between the AGCT and TGCT
haplo-the 3⬘categories shown in Table 3. The long branches
types is not allowed under statistical parsimony because such
leading to the four major termini that frequently serve
a break would require these haplotypes to be interconnected
as candidates for parental types in recombination (
Tem-evolutionarily by three mutations, including a homoplasy.
In-stead, homoplasies are allocated to the longer branches under pletonet al.2000) are well defined and have no loops, statistical parsimony (in this case the two possible connections but the 3⬘haplotypes at each of the four termini show of haplotype AAGG to either haplotype AGCT or haplotype
much homoplasy, including several loops, indicating
TACT). Hence, there are only two statistically parsimonious
multiple statistically parsimonious solutions (Figure 5).
networks compatible with this fictional data set, in contrast
Estimation of cladistic structure for the entire 9.7-kb
to four maximum parsimony solutions.
region with no detected recombination (step 4b):Figure 3 shows the SP tree estimated byTempletonet al.(2000)
(step 5b in Figure 1) that are contained within the cladistic under the null hypothesis of no recombination or gene
structure estimated in step 4b but that correspond to the conversion. Figure 6 shows the cladistic structure that subregions identified in step 4a. This allows a direct compari- remains after the removal of all 30 significant recombi-son of the two methods (steps 4a and 4b) for removing the
nation and gene conversion events, the homoplasies
effects of recombination. Step 6 in Figure 1 is therefore to
attributable to them, and any cladistic structure that
test the concordance of the tree topologies estimated in step
5avs.those estimated in step 5b. The null hypothesis that a evolved from the original recombinant/converted
hap-given data set fits equally well into two alternative evolutionary lotypes.
trees or networks is tested with a Wilcoxon matched pair, Estimation of cladistic structure for the entire 9.7-kb signed rank tests according to the procedures given in
Tem-region that evolved from recombinant haplotypes (step
pleton(1983, 1987) and the Templeton test option of PAUP*
4b):Figure 7 shows the 29 recombination events and 1
(Swofford1997).
web-Figure 3.—The estimated total haplotype network under the null hypothesis of no recombination or gene conversion. Haplotypes are indicated by a number followed by one or more letters indicating the populations in which that particular haplotype was present ( J, Jackson; N, North Karelia; R, Rochester). Small circles indicate nodes in the tree that represent intermediate haplotype states not found in the sample. Each line (solid or dashed) represents a single mutational event. The site involved in the mutation is indicated near the line by a small boldface number, with the numbers corresponding to the variable site numbers given in Table 1. Dashed lines indicate where loops or alternatives create ambiguity in the topology of the tree. Nodes that define four major clades are indicated by an oval containing T-i, where i can be 1, 2, 3, or 4. Other nodes involved in recombination events are indicated by the lowercase letters a–n and p–x. A star next to the branch between T-1 and the node connecting to T-2, -3, and -4 indicates that this is the branch that connects to the chimpanzee sequence and hence indicates the rooting of the tree.
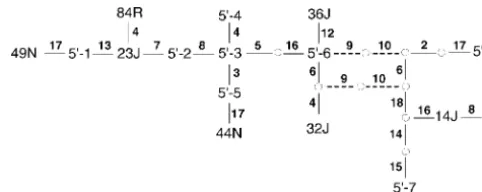
site), along with the cladistic structure estimated to have Collapsing the nonrecombinant and postrecombinant cladistic structure into separate 5ⴕ and 3ⴕsubregional
arisen as recombinant haplotypes and their descendants
accumulated subsequent mutations. Sometimes one of trees (step 5b):We collapsed the peeled tree of nonre-combinant cladistic structure obtained in step 4b into these descendant haplotypes served as an inferred
pa-rental type in a subsequent recombination event. This its 5⬘and 3⬘subsets as defined by the subregions identi-fied in step 4a by simply removing all variable characters results in an interlocking of the cladistic structure that
evolved from one recombinant with that of another not in the subregion of interest (step 5b, Figure 1). Figure 8A shows the resulting haplotype network when recombinant, as is also shown in Figure 7. In other
cases, neither the recombinant nor any of its descendant the peeled nonrecombinant tree for the entire 9.7-kb region includes only variable characters 1–18 (the 5⬘ haplotypes engaged in any subsequent recombination
events. Such cases are indicated in Figure 7 by the ab- region flanking the recombinational hotspot), and Fig-ure 8B shows the corresponding 3⬘collapsed tree (char-sence of any connection to any other recombination
postrecombi-TABLE 2
national cladistic structure shown in Figure 7 by
considering only the 5⬘characters (1–18), with the result The sets of haplotypes that are identical for shown in Figure 9A, and by considering only the 3⬘ variable sites 1–18
characters (36–69), with the result shown in Figure 9B.
Cross-validation of the cladistic structures emerging Haplotype
set name Haplotypes in set
from steps 5a and 5b (step 6):We first compare the
cladistic structures estimated for the 5⬘and 3⬘regions 5⬘-1 1JNR, 2JNR, 4JN, 9N, 21J, 43J, 46N, 50N, 52N, flanking the recombinational hotspot (with any recom- 53N, 56N, 59N, 60N, 61N, 62N, 63N, 64J, bination events involving those flanking regions ex- 65N, 70R, 71R, 76R, 79R, 86R
5⬘-2 10J, 12J, 16J, 25J, 30J, 40J
cluded) as shown in Figures 4 and 5 with the
nonrecom-5⬘-3 3JNR, 5NR, 7NR, 19J, 27J, 31J, 34J, 37J, 41N,
binant cladistic structure given in Figure 8. There are
42N, 47N, 51N, 54N, 66N, 69R, 74R, 78R,
fewer haplotype categories in Figure 8 than in Figures
83R, 85R
4 and 5 because all crossover events anywhere in the
5⬘-4 28J, 45J
9.7-kb region were peeled off in obtaining Figure 8, 5⬘-5 18J, 39J, 48N, 67N, 77N, 80R, 81R whereas the trees given in Figures 4 and 5 excluded 5⬘-6 11J, 24J, 26J
only crossover events that were internal to either the 5⬘ 5⬘-7 15J, 33J
5⬘-8 17J, 22J, 35J, 57J
or 3⬘flanking regions, respectively. Consequently, the
5⬘-9 6NR, 13J, 38J, 58N, 68R, 72R, 75R
contrast of alternative topologies is limited only to that
5⬘-10 55N, 73R, 82R, 87R, 88R
portion of the topology defined by the shared haplotype
categories. The Templeton test for the 5⬘ region is 1, Any haplotypes not listed in this table have a unique 5⬘ with only 1 observation out of 18 not tied. A minimum sequence in the 1–18 interval.
of 5 untied observations is required for significance at the 5% level, so this result is not even close to
signifi-[CG dinucleotides, mononucleotide runs of length five cance at the 5% level. The Templeton test for the 3⬘
or greater, and DNA polymerase␣ arrest sites having region is 3 with only 2 untied observations out of 34.
the motif TG(A/G)(A/G)GA] or not, as detailed in This result is also not significant at the 5% level.
Templetonet al.(2000). The number of homoplasies We next cross-validate the postrecombinational
cla-associated with each of these sites was then counted. distic structure given in Figure 9 by comparing it with
The above counts exclude the 17 variable sites found the 5⬘and 3⬘trees shown in Figures 4 and 5, respectively.
in the recombinational hotspot. To include these sites, There are no topological inconsistencies for the 5⬘
re-we used the cladistic structure shown in Figures 6 and gion, so there was no need to perform a Templeton
7 to count the number of homoplasies for sites 19–35. test. For the 3⬘region, the Templeton test is 2 with only
Because there is no cross-validation for these sites, our 1 untied observation out of 34, a result not significant
analysis of the association between highly mutable sites at the 5% level.
and homoplasy is done both including and excluding
Association between homoplasies in the cladistic
these 17 sites.
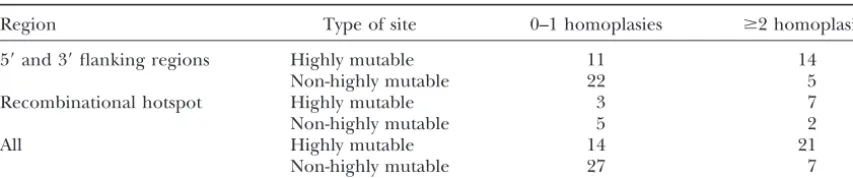
structure with mutagenic categories after the removal
The results are shown in Table 4, and a Fisher’s exact
of the effects of detected recombination:The cladistic
test reveals a significant pattern in which homoplasies structure is probably most accurately reconstructed for
are disproportionately found at highly mutable sites, the 5⬘and 3⬘flanking regions, which show considerable
when the recombinational hotspot sites (19–35) are ex-cross-validation through two different estimation
tech-cluded (a two-tailed probability of 0.0089 under the null niques (step 6 above). Hence, we count the number of
hypothesis of homogeneity) or included (a two-tailed homoplasies at sites 1–18 and 36–69 as displayed in
probability of 0.0013 under the null hypothesis of homo-Figures 4 and 5, but using the resolved loops from
Fig-geneity). ures 8 and 9 that are topologically consistent with
Fig-ures 4 and 5. Making use of this added resolution is justified because the trees in Figures 8 and 9 are based
DISCUSSION
on more character state information than those in
Fig-ures 4 and 5. In addition, six recombination/gene con- Cladistic structure: Although recombination is com-mon in theLPLgene, the inference that most of this version events were excluded in estimating the cladistic
structures shown in Figures 4 and 5, as mentioned ear- recombination is concentrated into a hotspot ( Tem-pletonet al.2000) implies that there should be much lier. Figure 9 shows the mutations inferred to have
oc-curred after these recombination/gene conversion cladistic structure to the haplotype variation in the flanking regions having few inferred recombination or events, and the sites found in the relevant flanking
re-gions given in Figure 9 are also included in this analysis. gene conversion events. This prediction is borne out by Figures 4 and 5. The 5⬘region has only two statistically In this fashion, all 18 sites in the 5⬘ region and all 34
TABLE 3
The sets of haplotypes that are identical for variable sites 36–69
Haplotype
set name Haplotypes in set
3⬘-1 1JNR, 52N
3⬘-2 2JNR, 5NR, 70R, 83R
3⬘-3 27J, 33J, 74R Figure4.—The haplotype network for the 5⬘region
encom-3⬘-4 3JNR, 4JN, 7NR, 82R, 85R, 87R passing variable sites 1–18. The 5⬘ haplotype categories are
3⬘-5 11J, 17J, 23J, 79R given in Table 2. The layout of the network is the same as
3⬘-6 6NR, 18J, 25J, 62N, 65N, 68R, 69R, 80R, 88R that given in Figure 3.
3⬘-7 21J, 84R, 86R
3⬘-8 22J, 57J
3⬘-9 13J, 72R, 73R
mini 2, 4, and 5, thereby implying that virtually all the
3⬘-10 47N, 55N
haplotypes defined by the evolutionary old 3⬘structure
3⬘-11 58N, 66N
on the long branch between T-1 and the remaining
3⬘-12 10J, 31J
termini have undergone recombination. Figure 7 also
Any haplotypes not listed in this table have a unique 3⬘
reveals that substantial cladistic structure has also arisen
sequence in the 36–69 interval.
after recombination events have occurred. Thus, there is both nonrecombinant and postrecombinant cladistic structure in this region of theLPLlocus. We anticipate ambiguity, as shown by the multiple loops in Figure 5.
that cladistic structure will exist for other nuclear DNA One loop (associated with haplotype 49N) is due to the
regions showing recombination when the recombina-fact that a critical variable nucleotide was not scored
tion is concentrated into hotspots (Chakravartiet al.
(position 40) in haplotype 49N, but the others are the
1984). result of apparent homoplasy that could be due to either
Partitioning cladistic structure into
nonmultiple mutational events or undetected
recombina-tional and postrecombinarecombina-tional components: Peeling tion/gene conversion events. Nevertheless, the long
off inferred recombinants from a tree estimated branches leading to the four major termini (T-1 through
through statistical parsimony under the null hypothesis T-4 in Figure 5) remain well defined and with no loops,
of no recombination is a novel method of estimating as are many of the branches leading from these termini
cladistic structure in a DNA region subject to recombi-to specific haplotypes or haplotype clusters. Therefore,
nation. Such peeling partitions cladistic structure into there is also much cladistic structure in the 3⬘region.
a component that has never been influenced by detect-Moreover, the long branch lengths among the four
ma-able recombinational events and a component that jor termini imply that this evolutionary structure is quite
evolved after recombination. To check the accuracy of old. This conclusion is reinforced by the fact that when
this novel approach, we cross-validated it with the haplo-the chimpanzee sequence (Nickerson et al. 1998) is
type networks estimated in a more traditional fashion added as an out-group, it roots the 3⬘tree within the
within subregions with little evidence for recombination long branch connecting T-1 to the other three termini
(Figures 4 and 5) and found no significant differences. (data not shown). Thus, there is ancient and deep
evolu-The few topological differences that did exist were mi-tionary structure in the gene region despite frequent
nor. Starting with the 5⬘ region, the only discrepancy overall recombination, particularly for sites that flank
between Figure 8A and Figure 4 is in the position of the recombinational hotspot and that are preferentially
5⬘-2. There is an additional homoplasy at site 8 in the found in these long branches.
peeled tree that is not present in the more traditionally These conclusions are reinforced by the peeled tree
estimated tree. The single discrepancy between the to-shown in Figure 6, which provides an estimate of the
pologies could be due to a recombination event that cladistic structure contained within the entire 9.7-kb
placed site 8 upon a new 3⬘ background but had too region sequenced that has not been altered by any
de-few markers to be statistically significant under the re-tected recombination or gene conversion events. This
combination test given by Crandall andTempleton
peeled tree also contains the long branches among the
(1999). four major termini that are defined primarily by sites
Similarly, the 3⬘region of the peeled nonrecombinant 3⬘to the recombinational hotspot. Indeed, the peeled
tree shown in Figure 8B differs from the topology given tree in Figure 6 shows that some nonrecombinant states
in Figure 5 by only two additional homoplasies involving have persisted all the way back to the root of the LPL
sites 53 and 65 and by a slightly different but equally gene tree. The peeled tree also reinforces the
conclu-parsimonious (when inference is restricted to characters sion of a recombinational hotspot because the peeled
Figure5.—The haplotype network for the 3⬘region encompassing variable sites 36–69. The 3⬘haplotype categories are given in Table 3. The layout of the network is the same as that given in Figure 3. In addition, nodes that define four major clades that served as common termini for parental types involved in recombination events are indicated by an oval containing T-i, where i can be 1, 2, 3, or 4.
topological differences are not significant by the Tem- 10 inferred recombination events in their evolutionary history, as well as postrecombination mutational accu-pleton test and can be explained by two additional
re-combination events that were not statistically significant mulation. Overall, Figure 7 reveals a complex history of interlocking recombination events as a major force because of too few markers. Therefore, the peeled tree
shown in Figure 6 accurately reflects both the 5⬘and 3⬘ in shaping the haplotype diversity found in this region of theLPL gene. At this point, we have not yet deter-evolutionary structure that flanks the recombinational
hotspot found in this 9.7-kb region. The few topological mined how accurately this complex recombinational history has been reconstructed, although we do know discrepancies that are detected are explicable by three
additional recombination events, but these three events that two events are not robust to alternative tree topolog-ies (recombination events 23 and 24 in Figure 7) and did not involve enough markers to achieve statistical
significance. Given the overall number of recombina- that events 26 and 28 are collapsed into a single recombi-nation event under some alternative tree topologies, as tion events that were statistically significant, it is
reason-able to expect that some additional recombination are events 16 and 20 (Templetonet al.2000). In light of these uncertainties, Figure 7 is best regarded as a events occurred but were not detected (Templetonet
al.2000). hypothesis of the recombinational history of the DNA region that explains much of the haplotype complexity The results given in Figure 7 imply that much of the
cladistic structure observed in the 9.7-kb region arose and that is based upon individual recombination events that all have statistical support. However, even if all the due to mutational accumulation in haplotype lineages
that were initially created by a recombination or gene details implied by Figure 7 are not accurate, we feel that it does portray the complexity of the interplay among conversion event. In addition, Figure 7 implies that a
single haplotype lineage could have been affected by many recombinational and mutational events that would be needed to explain the patterns of haplotype multiple recombination events during its evolutionary
ro-Figure6.—The estimated haplotype tree after all recombinant and gene conversion clades have been removed. The layout of the network is the same as that given in Figure 3. The thick lines indicate the two possible resolutions of recombination event 6 (the second event in Figure 2 ofTempletonet al.2000). One of these pairs of thick lines should be removed, but the symmetry of this recombination event prevents any inference on which one leads to a parental type and which to a recombinant.
bust to alternative tree topologies and exclusion of likely impossible to find large subregions that show little or no internal recombination. Hence, the peeling method false positives identified inTempletonet al.(2000).
As with the peeled nonrecombinant tree, we found of inferring cladistic structure has a broader range of applicability than the method of subdividing a gene into that the postrecombinational cladistic structure
sug-gested by Figure 7 was topologically consistent with the smaller regions that show little or no internal recombi-nation.
5⬘and 3⬘trees shown in Figures 4 and 5, respectively,
as ascertained by the Templeton test. There were no Evidence for multiple mutational events:Templeton
et al. (2000) showed that sites in the LPL region that topological inconsistencies for the 5⬘ region between
Figures 3 and 9A, and there is only a single inconsistency have known mutagenic motifs have much higher levels of polymorphism than the remaining sites. This high involving two additional homoplasies at sites 53 and 69
in the 3⬘region. polymorphic frequency raises the possibility that such sites are also likely to experience multiple mutational All this topological consistency indicates that this
peeling method has promise in partitioning the cladistic events, leading to true homoplasies in the evolutionary structure of the haplotype tree. Table 4 reveals that structure in gene regions with recombination into
non-recombinant and postnon-recombinant components. We mutagenic motifs are also associated with increased ho-moplasy. The homoplasy counts in Table 4 eliminate used the existence of a recombinational hotspot in the
LPL region as a tool to provide a cross-validation test, the impact of all 30 significant recombination/gene conversion events detected previously (Templeton et
but the inference scheme given in steps 1, 2, 3, 4b, and
5b in Figure 1 could also be applied to regions with al.2000). As mentioned above and discussed in Tem-pletonet al.(2000), it is quite likely that additional but uniform recombination. In contrast, step 4a would be
homoplasies are still caused by recombination rather be used to confirm this hypothesis. Moreover, the six recombination/gene conversion events that occur than mutation, the potential effect of highly mutable
sites upon patterns of apparent homoplasy will be dimin- within the subregions (three in each) would be ex-cluded from the initial cladistic analysis of phenotypic ished because apparent homoplasies due to
recombina-tion depend only upon physical posirecombina-tion and not upon associations, but could then be used to physically local-ize within the flanking regions any detected phenotypic sequence motif at a particular site. Hence, the
homo-plasy counts in Table 4 are conservative for testing the associations in a manner similar to the use of recombi-nants in the Alcohol Dehydrogenase locus of Drosophila
null hypothesis that highly mutable sites have the same
incidence of homoplasy as do the remaining sites. melanagasterbyTempletonet al.(1987). However, two of these six recombination events may be false positives Because undetected recombination or gene
conver-sion would be expected to weaken this association, these (Templetonet al.2000), so recombination events 6 and 12 in Figure 7 should be used with caution in attempts to results indicate that the highly mutable sites have indeed
been subjected to multiple mutational events. Hence, localize physically any detected phenotypic associations. Even with this caution, a nested cladistic analysis of this the infinite sites mutation model, which assumes that
multiple events can never occur, is not strictly applicable region of theLPLlocus should yield more information than a cladistic analysis in a region that had no recombi-to theLPLregion. This is an important conclusion
be-cause many of the statistics commonly used to analyze nation, as already demonstrated by Templeton et al.
(1987),TempletonandSing(1993), andKeavneyet
DNA sequence data are based upon the infinite sites
model, and some of these statistics, but perhaps not all al.(1998) for other nuclear regions showing some re-combination.
(Clarket al.1998), may be inappropriate for this region
(further discussion on this point is inTempletonet al. Choosing a small number of SNPs for disequilibrium mapping in theLPLregion:One of the major new goals 2000). Statistics based upon the infinite sites model must
therefore be used with caution in theLPLregion and of the Human Genome Project is to develop a map of more than 100,000 SNPs distributed over the entire in other DNA regions in the human genome that have
mutagenic motifs associated with a substantial propor- human genome (Collins et al. 1998). Although the SNPs are frequently described as being randomly cho-tion of the variacho-tion (Rideoutet al. 1990;Krawczak
and Cooper1991; Krawczak et al. 1995; Reiss et al. sen, they are not because an effort is made to find SNPs that have common allelic alternatives. Because common 1991; Jones et al. 1992; Magewu and Jones 1994;
Todorova and Danieli 1997; Agarwal et al. 1998; alleles tend strongly to be old alleles (KimuraandOhta
1973; Castelloe and Templeton 1994), the current
Nakagawaet al.1998;Tvrdiket al.1998).
Implications for genotype/phenotype association strategy will preferentially use SNPs that are evolution-arily old. The justification for creating a SNP map is
studies:As shown in Figures 3–7, there is much cladistic
structure in theLPLlocus despite common recombina- the expectation that linkage disequilibrium, at least in relatively isolated, homogeneous human populations, tion, primarily because the recombination is
concen-trated into a small hotspot. This cladistic structure is should exist between at least one of these SNPs and the common alleles at any locus in the genome. Given that important for future studies on associations between
genetic variation and phenotypic variation. Indeed, the the current strategy has about one SNP per gene (al-though recent recommendations increase this
num-LPL gene is an ideal candidate for a cladistic analysis
because the recombinational hotspot preserves much ber), this claim requires that a single SNP marker near or in the locus of interest would show significant disequi-cladistic structure while simultaneously allowing
posi-tional inferences to be made on any detected pheno- librium with nearly all common alleles at this locus. This is certainly not the case for even the third of the LPL
typic associations (TempletonandSing1993;Keavney
et al.1998). One would perform separate nested analyses gene analyzed in this article.
It is virtually impossible for any single SNP to show using the permutational methods developed for diploid
genotypic data (Templetonet al.1988) on the two sub- disequilibrium across the entire 9.7-kb region se-quenced because of the recombinational hotspot. First, regions using the subregional haplotype trees given in
Figures 4 and 5. The nesting rules given inTempleton SNPs in the hotspot show little disequilibrium either with one another or with any markers in the 5⬘and 3⬘ andSing(1993) can deal with the loops found in the 3⬘
end while making use of the extensive cladistic structure flanking regions (see Figure 8 inTempletonet al.2000). This is particularly true for SNPs with common alleles: found in this subregion. Alternatively, one could use
the results shown in Figures 6 and 7 to resolve most of by selecting such SNPs one also selects for old polymor-phisms, thereby providing much time for recombina-the loops before creating recombina-the nested design from recombina-the
subregional haplotype networks. Any significant pheno- tion to occur if the SNP is located in the hotspot. Hence,
ⵑ20% of the sequenced portion of theLPLgene repre-typic effects detected within either subregion would
most likely be due to a mutation or mutations on the sents a disequilibrium blind spot. If a “randomly” chosen SNP fell into this hotspot region, it would most probably appropriate 5⬘or 3⬘side of the hotspot, and the many
Figure8.—(A) The topology that re-sults when only sites 1–18 are retained in the peeled tree shown in Figure 6; (B) the topology that results when only sites 36–69 are retained in the peeled tree shown in Figure 6. Thick dashed lines indicate those portions of these haplotype networks that are topologi-cally incompatible with the networks given in Figures 1 and 2.
only SNPs that would be expected to provide some dis- surviving clades, these four clades capture the majority of mutational divergence found in the 3⬘ end of the equilibrium coverage are those falling into the 5⬘and
3⬘regions that flank the recombinational hotspot. Obvi- gene. Moreover, because the branches interconnecting these four major clades are long, we have great confi-ously, significant disequilibrium is expected only within
each of the flanking regions and not between them. dence that this portion of the estimatedLPLhaplotype tree is accurate and fully resolved. Cladistic analyses of Therefore, a single SNP could not provide adequate
disequilibrium coverage for even this third of theLPL phenotypic associations do not require that the haplo-type tree be estimated in a completely accurate, resolved gene. Rather, separate SNPs would be needed for each
flanking region. fashion (Templeton andSing1993), but ambiguities in the estimated haplotype tree structure do weaken the Given that choosing SNPs nonrandomly by
popula-tion frequency criteria implies a nonrandom choice by power of this evolutionary approach. Therefore, SNPs in the 3⬘region should be chosen from mutations oc-evolutionary history as well, it is far better to use the
evolutionary history explicitly. We now address how the curring on the long branches that discriminate among these four major clades. In performing this task, we cladistic and homoplasy structure estimated in this
arti-cle can be used for choosing SNPs in the two flanking will focus upon those polymorphic sites that display no homoplasy at all, even before the inferred recombina-regions.
Starting with the 3⬘end, there are four major clades tion and gene conversion events have been peeled off. From Figure 3, 12 polymorphic sites exist that show no (the four termini in Figures 5 or 6). Given that the 3⬘
cladistic structure implies that these are old and long- homoplasy at all. The simplest explanation for why a
Figure 9.—(A) The topol-ogy that results when only sites 1–18 are retained in the recom-binant clades shown in Figure 7; (B) the topology that results when only sites 36–69 are re-tained in the recombinant clades shown in Figure 7. Thick dashed lines indicate those portions of these haplotype networks that are topologically incompatible with the net-works given in Figures 4 and 5.
site would show no homoplasy is that it is a recent muta- mutable sites. Highly mutable sites should tend to show high levels of polymorphism, which makes them highly tion that has had insufficient time and is sufficiently
rare to make it unlikely to have been involved in a informative of their direct phenotypic effects and useful in defining additional haplotype variation when used in recombination or gene conversion event. Three of the
12 sites not affected by homoplasy fit this pattern (sites conjunction with other nearby variable sites. However, highly mutable sites are not ideal as single-site markers 12, 22, and 24), but 9 of these sites with no homoplasy
are in the long branches that mark the four major 3⬘ of association (the primary purpose of choosing SNPs in this context) because they could show complicated clades (sites 32, 37, 39, 43, 47, 48, 51, 52, and 54).
Hence, most of the sites with no homoplasy are old and patterns of disequilibrium due to the fact that identity by state may not reflect identity by descent if multiple common. Their lack of homoplasy is therefore
attrib-uted to a lack of recombination (or a lack of evolution- mutational events occurred. Our demonstration that mutable sites are strongly associated with increased ho-ary persistence of any recombinants), and they are clean
cladistic markers for the four major clades. moplasy indicates that this possibility cannot be ignored. Given that almost half of the SNPs in the sequenced Three of these nine SNPs (at variable sites 39, 43, and
47) unambiguously mark the oldest and most extensive portion of theLPLgene come from the highly mutable classes, this consideration imposes another constraint divergence found within this gene region, the
distinc-tion between terminus 1vs.termini 2, 3, and 4. Another upon choosing SNPs for disequilibrium mapping. For the particular task of choosing among the three SNPs important consideration in choosing among these three
TABLE 4
The distribution of homoplasy across highly mutable and non-highly-mutable sites after the effects of all detected recombination and gene conversion events have been removed
Region Type of site 0–1 homoplasies ⱖ2 homoplasies
5⬘and 3⬘flanking regions Highly mutable 11 14
Non-highly mutable 22 5
Recombinational hotspot Highly mutable 3 7
Non-highly mutable 5 2
All Highly mutable 14 21
Non-highly mutable 27 7
SNP at site 39 is at a highly mutable site and should be homoplasy, but only site 2 is not in a highly mutable category. Hence, the SNP at site 2 should be used for excluded, leaving two candidates (the SNPs at sites 44
and 57). To discriminate among the other termini, the discriminating between the remaining two right-side clades. In summary, scoring three SNPs at sites 5, 9 or SNP at site 51 unambiguously discriminates between
terminus 4 and the node leading to termini 2 and 3 10, and 2 would mark the major sources of haplotype divergence in the 5⬘ region of the sequenced portion and is not at a highly mutable site. Finally, any one
of the SNPs at sites 32, 37, 48, or 52 unambiguously of this gene.
These considerations indicate that a single SNP can-discriminate between T-2 and T-3, but the SNP at site
37 would be the best because it is not in one of the not provide adequate disequilibrium coverage for even this third of the LPL gene and that at least four to highly mutable categories. Hence, three SNPs (at sites
43 or 47, site 51, and site 37) are needed to identify the six SNPs are needed to mark most of the mutational divergence found in the regions flanking the recombi-four major 3⬘clades that represent the oldest and most
extensive genetic diversity within the region sequenced. national hotspot. Note that choosing these four to six SNPs required detailed analysis of the entire 9.7-kb re-The 5⬘ end consists of evolutionarily closer
haplo-types, and there are no sites totally lacking homoplasy gion with respect to cladistic structure, recombination, and mutation. This reinforces the conclusion ofClark
within this end with respect to the total data set (Figure
3). However, much of this homoplasy is due to recombi- et al.(1998) that four random markers within 9.7 kb of theLPLgene would not be a reliable method of detec-nation with the 3⬘end, and there are many sites that
have no homoplasy within the 5⬘ end (Figures 4 and tion of nearby causal variation. But with choices in-formed by an estimate of evolutionary history, highly 9A). Hence, the 5⬘ sites with no homoplasy in the 5⬘
tree can be used to mark the major sources of haplotype mutable sites and recombinational events, four SNPs (site 5 plus three 3⬘ markers) would capture most of divergence in the 5⬘end, but should always be used in
conjunction with the minimal set of three 3⬘markers the mutational divergence found in this region, and with just two more SNPs in the 5⬘region even greater identified above because all sites show apparent
homo-plasy in the total data set due to recombination. The resolution is possible.
However, even these cladistically informed choices single branch in Figure 4 that captures most of the
5⬘ variation is the branch between the 5⬘-3 and 5⬘-6 may not always be meaningful because of genetic differ-ences among populations. The four to six SNPs indi-haplotype sets. To the left of this branch are a set of
closely related 5⬘haplotype categories that differ from cated above are informative for the three specific popu-lations we have sampled, but these SNPs may not be their nearest neighbors by only a single site, and to the
right of this branch is a set of more distantly related 5⬘ polymorphic in all human populations, and hence may not be informative for all human populations. Evolu-haplotype categories (Figure 4). This branch is marked
by two sites, and of those, site 5 shows no 5⬘homoplasy tionary considerations are also relevant to the problem of choosing SNPs in light of potential genetic heteroge-and is not highly mutable. Hence, the SNP at site 5
captures most of the 5⬘variation. With additional sites, neity among populations. Detailed phylogeographic analyses of human mitochondrial DNA, Y-linked DNA, even greater 5⬘resolution is possible. The right half of
Figure 4 consists of three clusters of 5⬘haplotypes (5⬘-6, and autosomal DNA all indicate that the primary pattern in recent human evolution has been one of gene flow 32J, and 36J; 5⬘-8; and 5⬘-7, 8J, and 14J), all of which
are at least two mutational steps from a common node. constrained by isolation by distance (Templeton1998). Under isolation by distance, it takes time for a new Variable sites 9 and 10 show no 5⬘homoplasy and are
not in highly mutable categories, and either would dis- mutation to spread geographically, with the older muta-tions tending to be the most geographically widespread criminate the [5⬘-6, 32J, 36J] cluster from the remaining
detected old evolutionary structure in the 3⬘, but not We thank Jody Hey and two anonymous reviewers for their excellent 5⬘, flanking region. In particular, the oldest branch is suggestions for improving an earlier draft of this article. This work was supported by the National Heart, Blood, and Lung Institute grants
the one connecting the T1 terminus to the other three
HL39107, HL58238, HL58239, and HL58240.
termini (Figure 5). As expected under an isolation-by-distance model, haplotypes on either end of this old-est branch are found in all three populations sampled.
Hence, the SNP chosen to mark this branch (the SNP LITERATURE CITED
at either sites 44 or 57) is useful in any of the three Agarwal, S. K., L. V. Debelenko, M. B. Kester, S. C. Guru, P.
Manickamet al., 1998 Analysis of recurrent germline mutations
populations sampled, and under the evolutionary
pre-in theMen1gene encountered in apparently unrelated families.
dictions of the isolation-by-distance model, this SNP
Hum. Mutat.12:75–82.
should be useful for almost all human populations. The Boerwinkle, E., D. L. Ellsworth, D. M. Hallman andA.
Bid-dinger,1996 Genetic analysis of atherosclerosis—a research
other long branches in the 3⬘region are also likely to
paradigm for the common chronic diseases. Hum. Mol. Genet.
be old (although not as old as the longest branch that
5:1405–1410.
connects to the out-group), and hence should also tend Castelloe, J.,andA. R. Templeton, 1994 Root probabilities for
intraspecific gene trees under neutral coalescent theory. Mol.
to identify geographically widespread clusters of
haplo-Phylogenet. Evol.3:102–113.
types. Indeed, the haplotypes associated with T2 and
Chakravarti, A., K. H. Buetow, S. E. Antonarakis, P. G. Weber,
T4 are also found in all three populations sampled. C. D. Boehmet al., 1984 Nonuniform recombination within the
human-globin gene cluster. Am. J. Hum. Genet.36:1239–1258.
Only the haplotypes associated with T3 (Figure 5) are
Clark, A. G., 1990 Inference of haplotypes from PCR-amplified
restricted to a single population (the Jackson sample).
samples of diploid populations. Mol. Biol. Evol.7:111–122.
Hence, the remaining 3⬘SNPs identified above are also Clark, A. G., K. M. Weiss, D. A. Nickerson, S. L. Taylor, A.
Buchananet al., 1998 Haplotype structure and population
ge-expected to be useful in most human populations,
al-netic inferences from nucleotide sequence variation in human
though not as many as the SNP marking the longest
lipoprotein lipase. Am. J. Hum. Gen.63:595–612.
branch. Collins, F. S., A. Patrinos, E. Jordan, A. Chakravarti, R.
Gestelandet al., 1998 New goals for the US Human Genome
The evolutionary situation is quite different at the 5⬘
Project—1998–2003. Science282:682–689.
end, which does not reveal any deep cladistic structure.
Crandall, K. A.,andA. R. Templeton,1999 Statistical approaches
Hence, the SNPs in this part of theLPLgene may have to detecting recombination, pp. 153–176 inThe Evolution of HIV,
edited byK. A. Crandall.The Johns Hopkins University Press,
little utility beyond the populations actually sampled.
Baltimore.
For example, as discussed above, the single most
infor-Jones, P. A., W. M. Rideout, J. C. Shen, C. H. SpruckandY. C. Tsai,
mative SNP in the 5⬘region for the three populations 1992 Methylation, mutation and cancer. Bioessays14:33–36.
Keavney, B., C. A. McKenzie, J. M. C. Connell, C. Julier, P. J.
sampled is the SNP at site 5 (Figure 4). The haplotypes
Ratcliffeet al., 1998 Measured haplotype analysis of the
Angio-found to the left of the SNP at site 5 in Figure 4 are Angio-found
tensin-I Converting Enzymegene. Hum. Mol. Genet.7:1745–1751.
in all three populations sampled, but the haplotypes to Kimura, M.,andT. Ohta,1973 The age of a neutral mutant
per-sisting in a finite population. Genetics75:199–212.
the right of this SNP in Figure 4 are found only in the
Krawczak, M., andD. N. Cooper,1991 Gene deletions causing
Jackson population. Hence, if we had sampled just the
human genetic disease: mechanisms of mutagenesis and the role
Rochester and North Karelian populations and not the of the local DNA sequence environment. Hum. Genet.86:425–
441.
Jackson population, the SNP at site 5 would have been
Krawczak, M., P. H. ReitsmaandD. N. Cooper,1995 The
muta-uninformative. On the basis of these evolutionary
con-tional demography of protein C deficiency. Hum. Genet.96:
siderations, we conclude that the SNPs identified in the 142–146.
Long, A. D., R. F. Lyman, C. H. Langleyand T. F. C. Mackay,
3⬘flanking region are likely to have general utility for
1998 Two sites in thedeltagene region contribute to naturally
most human populations, whereas the SNPs in the 5⬘
occurring variation in bristle number inDrosophila melanogaster.
flanking region are likely to be informative only for Genetics149:999–1017.
Lyman, R. F.,andT. F. C. Mackay,1998 Candidate quantitative
specific populations.
trait loci and naturally occurring phenotypic variation for bristle
The ability to identify such highly informative SNPs
number inDrosophila melanogaster—thedelta-hairlessgene region.
for particular populations illustrates the utility that si- Genetics149:983–998.
Magewu, A. N.,andP. A. Jones,1994 Ubiquitous and tenacious
multaneous estimation of recombinational, mutational,
methylation of the CpG site in codon 248 of the p53 gene may
and evolutionary structure can play in human genetic
explain its frequent appearance as a mutational hot spot in
hu-epidemiology. Moreover, the ability to identify SNPs man cancer. Mol. Cell. Biol.14:4225–4232.
Markham, R. B., D. H. Schwartz, A. Templeton, J. B. Margolick,
that may have general utility in most human populations
H. Farzadeganet al., 1996 Selective transmission of human
is another important application of evolutionary
fea-immunodeficiency virus type 1 variants to SCID mice
reconstitu-tures that can arise from such a cladistic analysis of ted with human peripheral blood mononuclear cells. J. Virol.70:
6947–6954.
haplotype variation. However, as the 5⬘flanking region
Nakagawa, H., K. Koyama, Y. Miyoshi, H. Ando, S. Babaet al., 1998
shows, the evolutionary analysis may also indicate that
Nine novel germline mutations of Stk11 in ten families with
Peutz-it may be unlikely to identify a SNP that will be informa- Jeghers syndrome. Hum. Genet.103:168–172.
Nickerson, D. A., S. L. Taylor, K. M. Weiss, A. G. Clark, R. G.
tive for most human populations. When dealing with
Hutchinsonet al., 1998 DNA sequence diversity in a 9.7-kb
such DNA regions, it would be better to obtain sequence
region of the humanLipoprotein Lipase gene. Nat. Genet. 19:
data for the entire region in the populations of interest 233–240.
Rao, D. C., R. C. Elston, L. H. Kuller, M. Feinleib, C. Carterand