A 12-year cavern abandonment test
P.Bérest1a, B.Brouard2 and G.Hévin3 1
Laboratoire de Mécanique des Solides, Ecole Polytechnique ParisTech, 91128Palaiseau, France 2
Brouard Consulting, 101 rue du Temple, 75003 Paris, France 3
Storengy, Eurosquare 1, 155 Bd Victor Hugo, 93400 Saint Ouen, France
Abstract. In 1997-1998, an abandonment test was performed in a 950-m deep, 8000-m3 salt cavern operated by GDF SUEZ at Etrez, France. In this relatively small brine-filled cavern, which had been kept idle for 15 years before the test, thermal equilibrium was reached. A special system was designed to monitor leaks, which proved to be exceedingly small. In these conditions, brine permeation and cavern creep closure are the only factors to play significant roles in pressure evolution. This test strongly suggested that obtaining an equilibrium pressure such that the effects of these two factors were exactly equal would be reached in the long term. Four years later, pressure monitoring in the closed cavern resumed. Pressure evolution during the 2002-2009 period confirmed that cavern brine pressure will remain constant and significantly smaller than geostatic pressure in the long term, precluding any risk of fracturing and brine seepage to the overburden layers.
1 Introduction
In the past several years, there has been concern about the long-term behaviour of abandoned salt caverns. Such caverns are leached out from salt formations, with depths ranging from 300 m to 3000 m and volumes typically ranging from 10,000 m3 to 1,000,000 m3. Thousands of such caverns were created, and are used for brine production and/or hydrocarbon storage. Some day, they will be abandoned: the cavern will be filled with brine, a special plug will be set at casing seat, and cement will be poured in the well. A large “bubble” of saturated brine will be isolated. The long-term evolution of this brine is a serious concern. After cavern plugging, cavern brine pressure will build up, as has been proven by numerous “shut-in pressure tests” performed worldwide. The final value of cavern brine pressure is of utmost importance from the perspective of environmental protection. In some circumstances, brine pressure may reach a figure larger than the geostatic pressure, leading to hydro-fracturing: brine will flow upward through fractures to shallow water-bearing strata, leading to water pollution. In fact, pressure evolution in a closed cavern results from five main factors.
1.1 Cavern compressibility
Cavern compressibility is the ratio between any rapid change in cavern brine volume and cavern brine pressure. It results from the (adiabatic) elastic compressibility of brine and cavern itself, and is proportional to cavern volume, or V EVP, where E u4 10 /MPa4 is typical [1].
1.2 Cavern creep closure
Salt mass creep leads to cavern shrinkage. The driving force for cavern closure is the gap between geostatic pressure, Pf,and cavern pressure, or P. In the long term, salt behaves as a (highly)
1.4 Brine thermal expansion
The temperature history of cavern fluids during cavern operation generally is complex; in most cases, when a cavern is abandoned, brine temperature is smaller than geothermal temperature at cavern depth. Heat transfer from the rock mass to the cavern leads to brine warming. However, brine thermal expansion is hampered in a closed cavern, and brine pressure builds up. The thermal expansion coefficient of brine is D |4.4 10 /°Cu 4 , and a 1°C increase in brine temperature generates a pressure build-up of D E |1 MPa. After some time, however, thermal equilibrium is reached, and expansion no longer takes place. The characteristic time for conductive heat transfer is
2/3 4 c
t V k,where k = 100 m2/yr is salt thermal diffusivity. For instance, in a cavern with V = 8000 m3, the characteristic time is tc |1 yr, and it can be considered that thermal equilibrium is reached in a cavern after it has been kept idle (no liquid injection/withdrawal) during a period, say, of 5-6 years.
1.5 Brine leaks
Leaks through the casing or the casing shoe are known to have occurred in some underground storage environments [2]. The existence of such leaks — which are likely to vanish after the well of an abandoned cavern is plugged — would lead to severe misinterpretation of a cavern abandonment test (Salt permeability would be overestimated.) if casing leakage and brine permeation were not distinguished.
1.6 Brine pressure evolution
In the following, our focus is on caverns in which brine thermal expansion and leaks can be disregarded, and brine pressure evolution is governed by a differential equation:
>
@
>
0@
creep perm
VP Q P P Q P P
E f (1)
where Qcreepis the cavern volumetric closure rate, which is an increasing function of the gap between
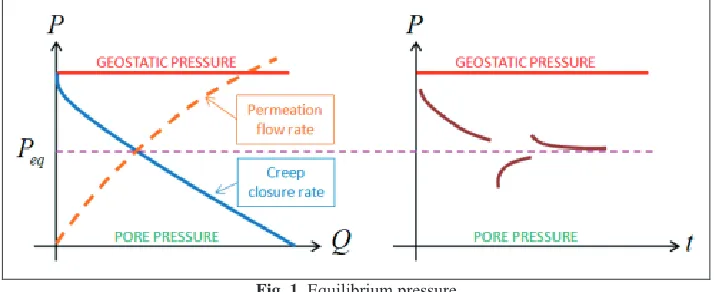
Fig. 1. Equilibrium pressure
It is found that equilibrium is reached (P Peq) when Qcreep Qperm— i.e., when cavern closure rate exactly equals brine permeation rate (Figure 1, left). The objective of an abandonment test is to assess equilibrium pressure and to verify that it is significantly smaller than geostatic pressure. An abandonment test (Figure 1, right) is performed following a trial-and-error method: when cavern pressure is higher (resp., lower) than equilibrium pressure, cavern pressure as a function of time consistently decreases (resp., increases). One significant advantage of this method is that, when transient effects are neglected, it provides both lower and upper bounds for the equilibrium pressure.
2 The 1997-1998 abandonment test
An abandonment test was performed in the EZ53 salt cavern of the gas storage site operated by GDF SUEZ at Etrez in southeastern France. This cavern had been leached out in July 1982. It is 950-m deep, and its volume is V = 8000 m3. Access to the cavern is through a 842-m-long 9-" casing cemented to the rock formation; a 929-m-long 7" string is set in the well [3].
2.1 Brine thermal expansion and Brine leaks
When the test began in 1997, the cavern had been idle for 15 years, and it was assumed that, after such a long period, thermal equilibrium in this relatively small cavern had been reached (see Section 1.4). A temperature gauge lowered in the cavern in February 1986 proved that the cavern brine temperature equalled the geothermal temperature of the rock formation (45°C at a 950-m depth). Thus, brine thermal expansion could be disregarded. Possible leaks also were a concern. On March 20, before the test began, a light, liquid hydrocarbon column was lowered in the 7"×9-" annular space to develop a brine-hydrocarbon interface at a depth of h = 864.5-m. Brine density was
3 1200 kg/m b
U , and hydrocarbon density was 3
850 kg/m . o
U Any hydrocarbon leak, Qact,
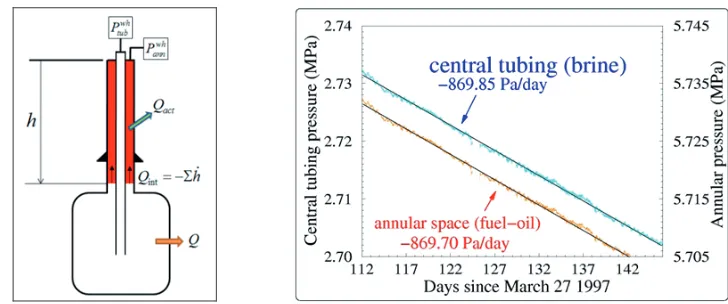
through the cemented casing or through the casing shoe, resulted in an interface rise by h Qact 6, where is the cross-sectional area of the annular space and, consequently, in a change by
( )
wh wh
ann tub b o
P P U U ghin the difference between the string pressure wh tub
P and the annular space
pressure wh ann
P as measured at the wellhead
.
This change can easily be measured.Fig. 2. Wellhead pressure evolution day 112 to day 142.
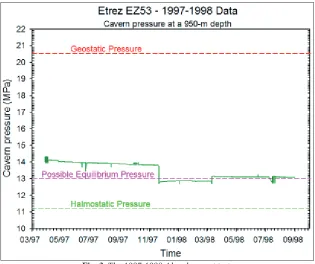
2.2 Test results
The test began on March 27, 1997 (day 1) and lasted for 540 days. The test (Figure 3) included four phases. At the beginning of each phase, a different pressure was applied in the cavern. The test ran smoothly except for the period from day 293 to day 315, described above. At the end of the test, the cavern pressure was P = 13.1 MPa and slowly decreasing. It was inferred that the equilibrium pressure at a depth of H 950 m was 950 13 0.1 MPa
eq
P r — i.e., smaller than the geostatic
pressure
Pf 20.5 MPaand larger than the halmostatic pressure, Ph 11.2 MPa at caverndepth. It also was inferred that salt-formation permeability was 20 2 2 10 m
K| u and that
cavern-creep closure rate was 2 10 yr4 -1
V V | u [3].
3 WAS THE 1997-1998 TEST LONG ENOUGH?
Fig. 3. The 1997-1998 Abandonment test.
4 The 2002-2009 test
4.1 November 1998 to May 2002
The EZ53 well completion was discussed briefly in Section 2. The well has a 7” central string that is 929-m (Htub) long, and a 842-m long 9-"cemented casing shoe. The internal volume of the string is 19.5 m3. At the end of the 1997-1998 test, the cavern and the central string are filled with saturated brine except for a 3.5-m liquid hydrocarbon column at the top of the string. The annular space is filled with liquid hydrocarbon to a depth h = 858.5 m. From depth 0 to 32 m, the cross-sectional area of the annular space is 52.4 litres/m; from 30 m to 842 m, it is 14.7 litres/m; and, from 842 m to 890 m (location of the cavern chimney), it is = 5.7 litres/m. The liquid hydrocarbon volume injected in the annular space in 1997 was approximately 14.5 m3.
No information is available for the period November 1998 to April 2002. On May 24, 2002, recording of the string pressure at the wellhead began again, and weekly recordings were performed. The pressure gauge, with a resolution of 0.1 MPa, is much less accurate than that used during the 1997-1998 test, although 0.05-MPa pressure changes can be detected. Wellhead string pressure from May 24 to June 6 was wh 1.75 MPa,
tub
P a figure observed consistently during one month. Because the string is filled with saturated brine, cavern pressure can be deemed to be
950 1.75 11.2 12.95 MPa
wh tub b
P P U gH (2)
1.
A liquid hydrocarbon leak occurred during the 1998-2002 period. Such a leak would result in a heavier annular space column, because the brine/hydrocarbon interface rises and hydrocarbon is replaced by saturated brine. This hypothesis is not fully convincing, as the leak was almost zero during the 1997-1998 period.2.
There were uncertainties in pressure measurements and liquid densities. Accuracy ofpressure gauges is poor: liquid densities are not constant, but depend on liquid pressure and temperature (which, from the wellhead to the cavern bottom, vary from a couple of MPa to 11 MPa, and from 10 °C to 45 °C, respectively). These result in variations of liquid density by 1% for brine (and more for liquid hydrocarbon).
4.2 From June 2002 to December 2002
On June 25, 2002, liquid hydrocarbon was withdrawn from the annular space, and brine was injected in the tubing to increase cavern pressure. The injected brine was slightly
undersaturated, with a density of 3
1177 kg/m .
uns b
U
The annular space was filled with thefully saturated brine from the cavern that displaced the fuel-oil column. The tubing pressure fluctuated from Ptubwh 3.2 to 3.4 MPa, an increase of
'
P
1.45 to 1.65 MPa when compared to the May 2002 period (see Figure 4). Because the cavern compressibility is3
3 m MPa ,
V
E
it can be inferred that the injected brine volume was 34.5 m
V P
E
' | (toincrease cavern pressure) plus 14.5 m3 (to withdraw liquid hydrocarbon from the annular
space), or 19 m3. It also can be inferred that the string, whose volume is 19.5 m3, is filledwith unsaturated brine and that the cavern pressure is:
950 ( ) 14.2 to 14.4 MPa
ann uns
tub b tub b tub
P P
U
gHU
g HH (4)The annular space pressure during this period isPannwh 3.1 to 3.2 MPa,from which a cavern pressure ranging from
'
950 14.3 to 14.4 MPa
wh ann b
P P
U
gH (5)can be inferred; the two figures are consistent (suggesting that the discrepancy observed in June 2002 resulted from poor estimation of liquid hydrocarbon density, the second hypothesis mentioned in Paragraph 4.1).
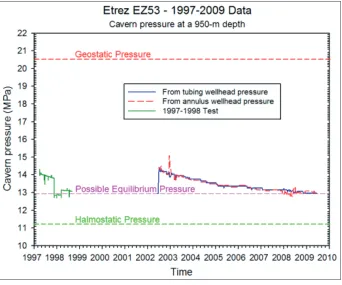
Fig. 4. Cavern pressure evolution in the 1997-2009 period.
string and the annular space to prevent brine freezing. Both wellhead pressures increased by 0.1 MPa, a figure consistent with what is known of cavern compressibility and hydrocarbon density. By mid-December, the annular pressure suddenly increased by 1.1 MPa (see Figure 4). This increase cannot be explained; gauge misreading is suspected, as, by the end of December, the pressure drops to the figure observed before this “pressure crisis”. A similar “pressure crisis” can be observed in March 2003, when both pressures unexpectedly dropped by 0.2 to 0.3 MPa. This pressure drop remains puzzling; both surface temperature and atmospheric pressure fluctuations generate small changes in wellhead pressure (These phenomena clearly were observed during the 1997-1998 test, when pressure gauge resolution was much better.), but these changes typically are 0.01 MPa in magnitude (see Figure 3) and cannot explain the much larger pressure drop observed in March 2003.
From March 2003 to 2007, pressure evolutions were smooth; both pressures slowly decreased (see Figure 4), as they did during the 1997-1998 test when pressure conditions were similar, and the gap between these two pressures remained roughly constant. At the end of 2007, string pressure readings became difficult, as the gauge clearly no longer worked properly. A new string gauge was set on June 4, 2008. From then until July 2009, the string pressure is wh 2.0 MPa,
tub
P and the annular
space pressure is wh 1.8 1.9 MPa. ann
P It can be concluded from these figures that the cavern
The authors are indebted to the Etrez station staff whose dedication allowed highly valuable information to be made available for interpretation. Gérard Durup was instrumental in designing the 1997-1998 test, and was the first author to highlight the significance of brine (micro) permeation from a salt cavern. Eric Chaudan and Storengy, a subsidiary of GDF SUEZ, kindly gave permission to publish the field data.
REFERENCES
[1] P. Bérest, J. Bergues, B. Brouard. Int J Rock Mech Min Sci,;36:1031-49b (1999)
[2] P. Bérest, B. Brouard. Oil & Gas Science and Technology - Rev. IFP. 58, n°3, 361-384 (2003)
[3] P. Bérest, J. Bergues, B.Brouard, J.G. Durup, B. Guerber. Int J Rock Mech Min Sci, 38:343-55
(2001)
[4] J. Ratigan. Proceedings SMRI Spring Meeting, Houston, Texas., p.141-64 (2003)
[5] B. Brouard, P. Bérest, M. Karimi-Jafari, R.B. Rokahr, K. Staudtmeister, Zander-Schiebenhöfer D, D. Foumaintraux, P. de Laguérie, T. You. Report 2006-1 for the SMRI, (unpublished, 2006)
[6] A. Bannach, M. Klafki. Report 2009-1 for the SMRI (unpublished, 2009)
[7] M. Wallner, W. Paar. Proceedings SMRI Fall Meeting, El Paso, Texas, p.177-88 ( 1997)
[8] R.B. Rokhar, R. Hauck, K. Staudtmeister, D. Zander-Schiebenhöfer. Proceedings SMRI Fall Meeting, San Antonio, Texas, p.89-103 (2000)
[9] Ph. Cosenza, M. Ghoreychi. Int J Rock Mech Min Sci, 36:527-533 (1993)
[10] D. Brückner, A. Lindert, M. Wiedeman. Proceedings sixth Conference on Mechanical Behaviour of Salt. London: Taylor & Francis Group, p.417-26 (2007)
[11] G. Hévin, C. Caligaris, G. Durup, O. Pichayrou, C. Rolin. Proceedings sixth Conference on Mechanical Behaviour of Salt. London: Taylor & Francis Group, p.427-34 (2007)
[12] D. Brückner, H. Wekenborg. Proceedings SMRI Fall Meeting, Rapid City,South Dakota, p.81-103 (2006)