Development and optimization of a “water window” microscope
based on a gas-puff target laser-produced plasma source
Alfio Torrisi1,2, *, Przemyslaw Wachulak2, Andrzej Bartnik2, Łukasz Węgrzyński2, Tomasz Fok2 and Henryk Fiedorowicz2 1Dept. of Medical Physics & Biomedical Engineering, University College London,Malet Place, Gower Street, London WC1E 6BT 2Institute of Optoelectronics, Military University of Technology, Kaliskiego 2 Str., 00-908 Warsaw
Abstract. A laser-plasma double stream gas-puff target source coupled with Fresnel zone plate (FZP) optics, operating at He-like nitrogen spectral line λ=2.88nm, is capable of acquire complementary information in respect to optical and electron microscopy, allowing to obtain high resolution imaging, compared to the traditional visible light microscopes, with an exposition time of a few seconds. The compact size and versatility of the microscope offers the possibility to perform imaging experiments in the university laboratories, previously restricted to large-scale photon facilities. Source and microscope optimization, and examples of applications will be presented and discussed.
1 Introduction
Since the ‘90s, significant efforts were made to bring technical capabilities of synchrotron-based microscopes to the development of compact sources [1]–[8], because that the small size and versatility of compact microscopy system offers the possibility to perform imaging experiments, previously restricted to large-scale facilities, in university laboratories. It was already demonstrated that spatial resolution can be increased in nanoscale imaging systems employing short wavelength radiation such as soft X-ray (SXR) [9]. Such radiation has been successfully employed in different microscope techniques, mainly in transmission mode, including scanning microscopy [10], 3D tomography [11] and contact microscopy [12]. Nanosecond lasers operating in the near IR range can generate hot plasma in vacuum irradiating solid and gas targets, from which extreme ultraviolet (EUV) and SXR are produced. In particular, the “water window” spectral range (l = 2.3 - 4.4 nm) is suitable for biological imaging, due to a significant difference in absorption of water (oxygen) and carbon - biological sample constituents, allowing the possibility to obtain high contrast images. Although synchrotrons allow imaging acquisition in the “water window” spectral range, with a spatial resolution of ~10 nm [13], a compact high resolution imaging systems is of major importance from the point of view of a worldwide spread and possible commercial applications. The imaging in short wavelength ranges requires a high photon flux. For this reason, until now, most of studies in this field are conducted using large scale facilities, such as synchrotron or free-electron laser [14]–[16]. As it is possible to understand, the trade-off between the exposure time and the size and complexity of the system represents a deep challenge in the development of
compact systems. In this work, a table-top SXR microscope based on a double stream nitrogen gas puff target, working at the monochromatic wavelength of l=2.88 nm, including its characterization, parameters optimizations and few applications will be presented and discussed.
2 Experimental setup
the SXR emission yield and avoids nozzle ablation by repetitive plasma formation. Further details about the laser pulse emission synchronization with the gas emission can be found in [17].
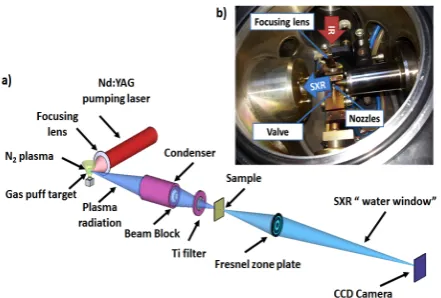
The gas pressures were set to 8 and 6 bar for nitrogen and helium, respectively, to ensure achievement of the highest possible photon flux at the CCD camera. Moreover, the pumping system allows to maintain a constant pressure of 2·10-2mbar in the vacuum chamber during the 10 Hz laser source operation. The gas-puff target source is very compact, robust and easy to operate and, moreover, being gaseous, is “debris-free”, eliminates debris production.
Fig. 1. a) Overall 3D scheme of the "water window" microscope and b) Top view of the gas-puff target source chamber.
2.1 Condenser optics for SXR microscopy
The SXR radiation was collected by a nickel-coated condenser mirror, manufactured by Rigaku Innovative Technologies (Czech Republic, Prague). The condenser efficiently reflects radiation from the SXR region at a small angle, focusing the radiation on the sample plane, with the energy cut-off of ~800 eV (~1.5 nm critical wavelength), above Ka-O edge (E = 543 eV). The
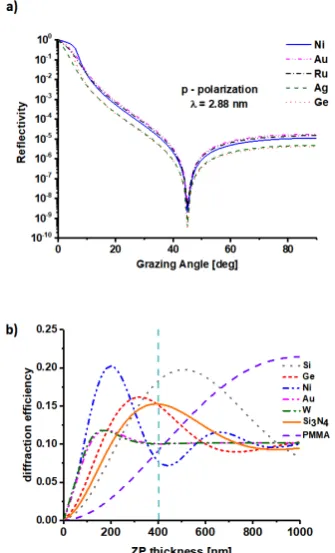
condenser was mounted on a three-axis motorized translation stages, enabling a smooth adjustment of the position in three directions (xyz) and the on manual stage to change tilt angle in two directions. The distance source-condenser was equal to 60 mm, while the distance condenser-sample was equal to 140 mm. Entrance and exit diameters of the condenser were equal to 11.7 and 14 mm, respectively, which results in entrance numerical aperture of NAC_in = 0.09 and exit numerical aperture of NAC_out = 0.05. For SXR, high reflectivity is possible employing small grazing angles. Fig. 2 a) shows the reflectivity p-polarization for different metallic surfaces at 2.88 nm (data from [18]). For higher incidence angles the major part of the radiation is absorbed in the mirror’s surface. However, it is possible to observe that the reflectivity at small grazing angles is sufficiently high for such mirror to be employed as a grazing incidence condenser. Moreover, out of presented, commonly used materials the nickel
exhibit one of the highest reflectivity. It is also relatively easy to deposit it using i.e. electroplating.
2.2 Fresnel zone plate objective for SXR microscopy
A 200 nm thick Ti filter (Lebow Company, California, USA) allows to cut off H-like line almost completely, so the main part of the energy is in a single line ( l= 2.88 nm), in the “water window” spectral range. A 400 nm thick Si3N4 Fresnel zone plate (FZP) objective (from Zoneplates Ltd., UK) was used to magnify image of the sample onto a back-illuminated SXR-sensitive CCD camera in transmission mode. The FZP, 250 µm in diameter, has the outer zone width of 30 nm and the focal length at 2.88 nm wavelength f = 2.6 mm. The magnified image was acquired with a back-illuminated CCD camera, sensitive to SXR (Andor, i-Kon). The numerical aperture of the zone plate, NAZP = 0.048, is matched to the exit numerical aperture of the condenser, NAC_out, limiting the loss of photons and providing incoherent illumination, since σ = NAC_out/NAZP = ~1. The image plane is located 574 mm from the zone plate. Thus, geometrical magnification of the system is ~220× allowing to achieve a half-pitch spatial resolution of ~60 nm [19].
Fig. 2. a) Typical reflectivity values for p (parallel) polarization of l = 2.88 nm radiation incident on different surface and b) Fresnel zone plate diffraction efficiency in the first diffraction order for different materials commonly used for its fabrication, as a function of the thickness of the lens, at l = 2.88 nm.
3 Results
3.1 Source optimization for SXR radiation
3.1.1 Measurement of the plasma spectral distribution
The SXR spectrum obtained with and without a Ti filter was measured using a transmission grating spectrometer equipped with a free-standing grating (5000-lines/mm), 33 µm entrance slit and the CCD camera. The grating was positioned ~770 mm from the plasma, the entrance slit was placed 4 mm from the grating, and distance between the grating and the CCD was 425 mm. To improve the spectrometer resolution, a 20 µm wide auxiliary slit was placed 300 mm from the plasma. The inverse relative bandwidth of the spectrometer was estimated from spectrum to be λ/Δλ ~ 70 at λ = 2.88 nm wavelength. The N2 measured spectrum (solid line in Fig.3a) was quasi-monochromatic, consisting of N5+:1s2-1s2p He-like nitrogen line at λ = 2.88 nm and N6+:1s-2p H-like nitrogen line at λ = 2.48 nm, according to L-α Ti edge at λ ~ 2.7 nm allows to filter out H-like line almost completely; thus, most energy of the beam illuminating the sample resides in a single line at λ = 2.88 nm in the “water window” spectral range, that represents the N2 plasma radiation employed for imaging. The plasma distribution was acquired, for comparison, employing
three different thicknesses of a free-standing Ti filter, i.e. 100 nm (dashed line), 200 nm (dotted line) and 500 nm (solid line). Results are plotted in Fig. 3a). As it is possible to observe, the 500 nm of Ti filters out completely the N2 emission at 2.48 nm. However, subsequent acquisitions of images using this filter, have demonstrated that the photon flux is too low to obtain a good signal to noise ratio. A reasonable compromise in order to achieve optimal imaging conditions is given by the employment of a 200 nm thick Ti filter.
3.1.2 Photon flux measurements
The source photon flux was measured at the sample plane using an AXUV100 silicon p-n junction photodiode (from, IRD Inc., California, USA), active area 10 x 10 mm2. The detector does not have any filters deposited, thus, due to broad spectral emission from the plasma, a 200 nm Ti filter was used, placed 31 cm from the detector. The detector signal was stored using a 4 GHz bandwidth Tektronix Inc. (Oregon, USA), DPO 70404 oscilloscope and later integrated numerically.The circuit was used to reverse bias the detector up to a voltage of ~ - 28 V. The photon flux acquired was equal to (7.9 ± 0.2) ·109 photons/pulse, which corresponds to energy of 561 ± 17 nJ/pulse at 2.88 nm wavelength.
3.1.3 Visualization of the plasma spatial distribution
The spatial distribution of nitrogen plasma in the “water window” spectral range was obtained using a pinhole camera equipped with 32 µm in diameter pinhole. A 200 nm Ti filter was mounted in order to assess the plasma size in the “water window” spectral range. The nitrogen plasma FWHM size was measured to be (HxV) 0.47 × 0.31 mm2. The plasma profile and its distribution are shown in Fig. 3b).
3.1.4 Condenser Alignment
be adjusted, as schematically depicted in Fig. 4a), overcoming geometrical restrictions of the vacuum system and allowing for visualization of the illumination pattern without the need to convert short wavelength radiation to the visible range using scintillators. Much more details about this techniques can be found in [21].
Fig. 3. a) Nitrogen plasma emission in the “water window” spectral range, unfiltered (dash-dotted line) and filtered with 100 (dashed line), 200 (dotted line) and 500-nm (straight line) thick Ti filter and b) SXR emission from nitrogen plasma generated by focused Nd:YAG laser pulses irradiating a double stream gas-puff target in the “water window” spectral range.
Condenser images, acquired at different positions along x and y axes, (with 20 SXR pulses, exposure time of 20 s and a bin of 4×4 pixels, to increase the signal-to-noise ratio) are shown in Fig. 4 b). The central picture (indicated with (0,0)) shows the condenser in an axial symmetric position and uniform illumination. It is possible to observe how the illumination becomes less uniform moving away from the central position.
Fig. 4. a) Scheme of the condenser alignment and b) Condenser illumination patterns acquired at different distances from the central position (uniform illumination). The condenser was placed in a three-step motor and moved along x and y axes, with different shifts.
3.2 Imaging Results
Herein few applications employing the “water window”
microscope are presented and discussed. The first sample in Figs.5 a-b) shows hippocampal neurons from E17 mouse embryos, cultured for on poly-D-lysine coated, 50 nm thick Si3N4 substrate. The neurons were imaged using a visible light microscope (40× objective, 400× magnification), Fig. 5 a) and the SXR microscope (sample to CCD magnification of 410×, exposure of 200 SXR pulses, 20 s), Fig. 5 b). The comparison shows a significant improvement of the spatial resolution employing the “water window” radiation where it is possible to observe that the high absorption coefficient at SXR wavelengths enhances the optical contrast, allowing to observe some features that are barely visible in Fig. 5 a). Indeed, in the SXR image it is possible to distinguish the neuron and dendrites that are blurred due to inferior resolution and phase-type imaging using the optical microscope. Same considerations can be made for the sample presented in Fig. 5 c-d), showing diatom cells deposited on top of 30 nm thick Si3N4 membrane. Also in this case small internal features are visible in the SXR image, in which is possible to obtain a better contrast respect to the optical image, distinguishing small features that are difficult to observe by visible light.
Fig. 5. Comparison of a) optical and b) SXR image of a hippocampal neurons from E17 mouse embryos; Diatoms sample imaged with c) visible light and d) SXR radiation.
4 Discussion and conclusions
noted that the SXR microscope still operates using photons instead of electrons. This is an important characteristic, because electrons interact with matter differently than the photons, thus providing the possibility to obtain different information from the samples. Moreover, although their resolution is similar to STED in the visible light region [23], [24], they enable the acquisition of full field images, contrary to STED acquisition, which operates in scanning mode, and does not require any fluorescence markers or staining, which modify the sample to be imaged.
In conclusion, the SXR compact microscopes can be regarded as complementary imaging tools to already existing, well-established ones, providing additional information about investigated samples. Compact overall dimension, easy accessibility and simple operation are key parameters for compact microscopes, such as fast exposure and tens of nanometers spatial resolution. This open the possibility of widespread commercialization of such systems, in the near future. Moreover, different samples were imaged in the SXR spectral range, microscope, including material science, nanotechnology and biology [19], [25], showing applicability and potential usability of such a “water window” microscope to different areas of research.
This work is supported by the National Science Centre, Opus programmes, grant agreement number UMO-2015/17/B/ST7/03718 and UMO-2015/19/B/ST3/00435, the Education, Audiovisual and Culture Executive Agency (EACEA) Erasmus Mundus Joint Doctorate Programme Project No. 2012-0033 and from the European Union’s Horizon 2020 research and innovation program, under Laserlab-Europe IV, grant agreement No. 654148. We would like to thank Dr. Michal Odstrcil from Paul Scherrer Institut, Villigen, Switzerland, for the hippocampal neurons from E17 mouse embryos sample preparation and Dr. E. Viaggiu, University of Tor Vergata, Rome (Italy), AlgaRes srl, for the preparation of diatoms sample.
References
1. G. Vaschenko, F. Brizuela, C. Brewer, M. Grisham, H. Mancini, C. S. Menoni, M. C. Marconi, J. J. Rocca, W. Chao, J. Liddle, E. H. Anderson, D. T. Attwood, A. V. Vinogradov, I. A. Artioukov, Y. P. Pershyn, V. V. Kondratenko, Opt. Lett. 30, 2095 (2005).
2. E. S. Wyndham, M. Favre, M. P. Valdivia, J. C. Valenzuela, PPC2009 - 17th IEEE Int. Pulsed Power Conf. 688 (2009).
3. R. Lebert, W. Neff, D. Rothweiler, J. Xray. Sci. Technol. 6, 107 (1996).
4. M. Benk, K. Bergmann, D. Schäfer, T. Wilhein, Opt. Lett. 33, 2359 (2008).
5. C. Brewer, F. Brizuela, P. Wachulak, D. H. Martz, W. Chao, E. H. Anderson, D. T. Attwood, A. V Vinogradov, I. a Artyukov, A. G. Ponomareko, V. V. Kondratenko, M. C. Marconi, J. J. Rocca, C. S. Menoni, Opt. Lett. 33, 518 (2008).
6. M. Berglund, L. Rymell, M. Peuker, T. Wilhein, H. M. Hertz, J. Microsc. – Oxford 197, 268 (2000). 7. H. Legall, G. Blobel, H. Stiel, W. Sandner, C. Seim,
P. Takman, D. H. Martz, M. Selin, U. Vogt, H. M. Hertz, D. Esser, H. Sipma, J. Luttmann, M. Hofer, H. D. Hoffmann, S. Yulin, T. Feigl, S. Rehbein, P. Guttmann, G. Schneider, U. Wiesemann, M. Wirtz, W. Diete, Opt. Express 20, 18362 (2012).
8. M. Müller, T. Mey, J. Niemeyer, K. Mann, Opt. Express 22, 23489 (2014).
9. The International Organization for Standardization,
“
ISO 21348 Definitions of Solar Irradiance Spectral Categories,” 6–7 (2007).10. C. Jacobsen, J. Kirz, Nat. Struct. Biol. 5, 650 - 653 (1998)
11. G. McDermott, M. A. Le Gros, C. G. Knoechel, M. Uchida, C. A. Larabell, Trends Cell Biol. 19, 587 (2009).
12. G. Poletti, F. Orsini, D. Batani, Solid State Phenom. 107, 7 (2005).
13. W. Chao, P. Fischer, T. Tyliszczak, S. Rekawa, E. Anderson, P. Naulleau, Opt. Express 20, 9777 (2012).
14. H. N. Chapman, A. Barty, M. J. Bogan, S. Ebastien, M. Frank, S. P. Hau-riege, S. Marchesini, B. W. Woods, S. Bajt, W. H. Benner, R. A. London, E. Plonjes, M. Kuhlmann, R. Treusch, S. Düsterer, T. Tschentscher, Jochen R. Schneider, E. Spiller, T. Möller, C. Bostedt, M. Hoener, D. A. Shapiro, K. O. Hodgson, D. van der Spoel, F. Burmeister, Magnus Bergh, Carl Caleman, G. Huldt, M. Marvin Seibert., F. R. N. C. Maia, R. W. Lee, A. Szöke., N. Timneanu, J. Hajdu, Nat. Phys. 2, 839-843 (2006). 15. M. A. Le Gros, G. Mcdermott, B. P. Cinquin, J.
Synchrotron Radiat. 21, 1 (2014).
16. R. Ortega, S. Bohic, R. Tucoulou, A. Somogyi, G. Devèst, Anal. Chem. 76, 309 (2004).
17. P. W. Wachulak, A. Torrisi, A. Bartnik, D. Adjei, J. Kostecki, L. Wegrzynski, R. Jarocki, M. Szczurek, H. Fiedorowicz, Appl. Phys. B 118, 573 (2015). 18. CXRO X-Ray Interactions With Matter - database
online: http://henke.lbl.gov/optical_constants/. 19. P. W. Wachulak, A. Bartnik, M. Skorupka, J.
Kostecki, R. Jarocki, M. M. Szczurek, L. Wegrzynski, T. Fok, H. Fiedorowicz, Appl. Phys. B Lasers Opt. 111, 239 (2013).
20. J. Kirz, J. Opt. Soc. Am. 64, 301 (1974).
21. P. W. Wachulak, A. Torrisi, A. Bartnik, Ł. Węgrzyński, T. Fok, R. Jarocki, J. Kostecki, M. Szczurek, H. Fiedorowicz, J. Opt. 17, 55606 (2015). 22. P. Wachulak, A. Torrisi, M. F. Nawaz, A. Bartnik,
D. Adjei, Š. Vondrová, J. Turňová, A. Jančarek, J. Limpouch, M. Vrbová, H. Fiedorowicz, Microsc. Microanal. 21, 1214 (2015).
24. J. N. Farahani, M. J. Schibler, L. A. Bentolila, Microsc. Sci. Technol. Appl. Educ. 2, 1539 (2010). 25. A. Torrisi, P. Wachulak, M. Fahad Nawaz, A.