IVUS detection using Image Processing:
A Review
Rahul Lanjewar
1, Kiran Barapatre
2, Mayur Petkar
3, Prasad Pande
4Assistant Professor, Dept. of Electronics Engg., D. B. A. C. E. R, Nagpur, Maharashtra, India1,2,3
Assistant Professor, Dept of Electronics & Communication, R. K. N. E. C, Nagpur, Maharashtra, India4
ABSTRACT: Intravascular ultrasound (IVUS) is a medical imaging technique used to see the blood vessels out through the surrounding blood column by visualizing the blood vessels in individuals to determine the amount of accumulation of degenerative material built up at in the epicardial coronary artery which cannot be vizualized by Angiography. IVUS not only enables to visualize the lumen of the coronary arteries but also blood cells "hidden" within the wall. This paper reviews the contour detection in which various features of an image in the form of intensity and the contour detection techniques have been discussed with implementation level.
KEYWORDS: Intravascular ultrasound, Image, Intensity, Contour detection
I. INTRODUCTION
Medical imaging is the methodology of creating visual representations of interior part of a body for clinical analysis and medical examination. It is an interdisciplinary branch consists of biological imaging and incorporates radiology as well. The image processing techniques have reached a new landmark which not only can detect anterior features but also made a contemporary approach to produce an image from sound.
IVUS is a catheter-based technique that renders two-dimensional cross-sectional images of the coronary arteries and provides information concerning the lumen and wall. In a typical IVUS image, three arterial regions can be distinguished: the lumen, the vessel wall, consisting of the intima and the media layers and the adventitia plus surroundings (Fig. 1).
Fig.1 A typical IVUS image with the lumen and mediaadventitia borders demarcated
II. RELATED WORK
In the traditional methods the segmentation of IVUS images performed manually which appeared to be a time-consuming procedure affected by variable examiner observations. To overcome these limitations, several approaches for semiautomated segmentation have been proposed in the previous research. The location of the boundries of interest are located and then an edge detection filter is applied within the pointed neighbourhood [3]. The extracted image data were then used for the estimation of the closed smooth final contour. Sonka et al. (1995) implemented a new approach of priori based knowledge-based graph searching method on a coronary artery anatomy and a selected region-of-interest prior to the automated border detection [4].
In the further investigations by Kompatsiaris et al. 2000 including the approach of the user interaction is required to draw an initial contour as close as possible to its final position by using the initial contour, the active contour approximates the final desired border [5] . In other methods the active contour or deformable model principles have also been used for the extraction of the lumen and medial-adventitia borders in three dimensions after setting an initial contour. However the approach of contour detection failed for low contrast interface regions such as the lumen border which corresponds to weak pixel intensity variation in the images. In the further improvement the active surface segmentation algorithm for plaque characterization, had been used for the frequency information after acquiring the
radio-frequency (RF) IVUS data. RF data were also used in after in vivo acquisition for the segmentation of the lumen
boundary in IVUS images. According to this approach, tissue describing parameters were directly estimated from RF data and a neuro-fuzzy inference system was used to distinguish blood from tissue regions. Further research presented a 3D IVUS segmentation by applying Rayleigh probability density functions (PDFs) for modelling the pixel grey value distribution of the vessel wall structures. Despite facilitating the analysis of IVUS data compared with manual processing, the method posed the restriction of needing substantial human intervention for further analysis which has been proven by clinical practice. Brusseau et al. explored an automated method of detection for the endoluminal border based on an active contour [6]. It involved the separation of regions with different statistical properties without using a pre-selected region of interest or initialization of the contour close to its final position. However the work didn’t examined the detection of the media-adventitia boundary. Another approach based on deformable models was reported by Plissiti et al. (2004), who employed a neural network for the modification and inimization of an energy function, as well as a priori vessel geometry knowledge [7]. Despite being to a significant extent automated, this method still required further manual estimation of the boundaries in the first frame of the sequence of IVUS images. In a new approach to make a shape-driven approach to segment IVUS images which was based on building a shape space using training data and, consequently, constraining the lumen and media-adventitia contours to a smooth, closed geometry in the space. In the latest approach an automated approach for segmentation of IVUS images based on a variation of an active contour model was presented which employed the initialization of the contours in each IVUS frame was automatically performed using an algorithm based on the intensity features of the image. The initially extracted boundaries constituted the input to the active contour model which later deformed down to the contours appropriately resulting in identifying their correct location on the IVUS frame; however, contour initialization based on intensity information alone is not most efficient approach.
III.AUTOMATED TEXTURE-BASED APPROACH FOR THE SEGMENTATION OF SEQUENTIAL IVUS IMAGES
Fig.2 Generalized Block diagram of Image Segmentation
The automated system consists of following important stages:
1. Image Pre-processing
a) Image pre-processing
The Preprocessing of the image data for the purpose of applying a texture description method consists of two steps:
a. Representation of the images in polar coordinates
b. Removal of catheter-induced artifacts.
Representation of an image in polar coordinates is provides the description of local image regions in terms of its radial and tangential characteristics. The Polar representation facilitates in various other detections steps, such as contour initialization and the smoothing of the obtained contour. The initial stage consists of conversion of each IVUS image into its corresponding polar coordinate image where columns and rows correspond to angle and distance from the center of the catheter.
Removal of Artifacts, defines a dead zone of radius equal to that of the catheter, where no useful information is
contained. Knowing the diameter D of the catheter, these catheter-induced artifacts are easily removed by setting I (r,θ
) = 0 for r > 𝐷 2 + constant, being a small constant.
b) Texture analysis
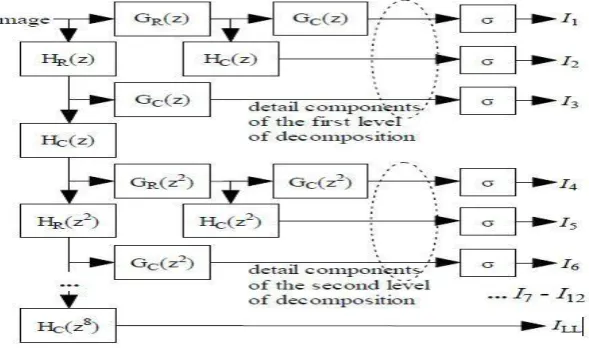
Texture Analysis deals with the generic analysis of images. There are various image processing techniques available in the research community but the Discrete Wavelet Frames (DWF) decomposition [12] turned out more effective used for detecting and characterizing texture properties in the neighborhood of each pixel. This is a method similar to the Discrete Wavelet Transform (DWT) that uses a filter bank to decompose the grayscale image to a set of subbands. The main difference between DWT and DWF is that in the latter the output of the filter bank is not subsampled. The DWF approach has been proven to decrease the variability of the estimated texture features, thus improving pixel classification for the purpose of image segmentation. The employed filter bank is based on the lowpass Haar filter given by
H (z) = 1 𝑧(1 + 𝑧
−1) (Eq.1)
According to the DWF theory, the texture of pixel p can be characterized by the standard deviations of all detail components, calculated in a neighborhood of pixel p. The calculation of these standard deviations is denoted by σ blocks in Fig.2. The images resulting from treating each calculated standard deviation as intensity value of pixel p are
denoted as 𝐼𝑘=1...K K =12, . In the proposed approach, a DWF decomposition of four levels is
employed, resulting in k , 𝐼𝑘 =1...K, K =12 such images, in addition to an approximation component, which is a
low-pass filtered image denoted 𝐼𝐿𝐿. However, not all of these images are used for the localization of the contours, as discussed in the sequel.
Due to the definition of the filters that are applied for texture analysis, the resulting approximation component of the filter bank features dominant tangential edges of the input image shifted in the radial direction by a constant number of pixels. This is undesired for the localization of these edges and is resolved by reversely shifting the entire image,
𝐼𝐿𝐿 (r,θ ) = 𝐼𝐿𝐿𝑜𝑟𝑖𝑔𝑖𝑛𝑎𝑙 (r + c, θ ), by a constant c .
c) Contour initialization and Contour Refinement
Objective of the contour initialization procedure is the detection of pixels that are likely to belong to the lumen and media-adventitia boundaries, taking into consideration the previously extracted texture features. In contrast to the initial contours generated as described in the previous section, which are not smooth and are characterized by discontinuities, the true lumen and media-adventitia boundaries are smooth, continuous functions of θ . Consequently, in order to obtain smooth contours that are consistent with the true ones, the application of a filtering or approximation procedure to the initial contour functions Cint (θ ), Cext(θ ) is required.
Fig.4 Illustration of the low-pass filtering-based contour smoothing procedure
In this review, a simple low-pass filtering solution is been analysed which takes advantage of the filtering functionalities developed for the purpose of texture analysis. More specifically, the low-pass filters H(z2i ), i = 0,...,M
−1 i that are based on the low pass Haar filter (Eq. 1) are successively applied to each of the two initial contour functions. This process is illustrated in Fig. 4. This simple procedure performs acceptably in smoothing the contours; however, better results can probably be obtained using a more elaborate approximation technique such as one based on radial basis functions.
IV.CONCLUSION AND FUTURE WORK
Based on the review it can be envisaged that the discussed image features along-with the extraction and refinement of contour the system can function as an automated system which not only can renders two-dimensional cross-sectional images of the coronary arteries but also provides information concerning the lumen and wall for the detection of boundaries in case of medical examination of a patients. Future work includes the combination of IVUS image data with a coronary angiography, which will allow the exploitation of information regarding the correct 3D morphology of the vessel, both for the initialization procedure and for the RBF-based contour refinement; the former could also benefit from such an approach, providing that it is extended accordingly. The combined use of texture, intensity and possibly additional information for the initialization step, and the integration of the developed automated analysis methodology to a computer aided diagnosis tool that will also support manual intervention of the medical expert also belong to future work.
REFERENCES
1. Anjum Asma and Gihan Nagib,’Energy Efficient Routing Algorithms for Mobile Ad Hoc Networks–A Survey’, International Journal of Mintz G, Nissen S, Anderson W, Bailey S, Erbel R, Fitzgerald P, Pinto F, Rosenfield K, Siegel R, Tuzcu E, Yock P. American College of Cardiology Clinical Expert Consensus Document on Standards for Acquisition, Measurement and Reporting of Intravascular Ultrasound Studies (IVUS). A report of the American College of Cardiology Task Force on Clinical Expert Consensus Documents. J Am Coll Cardiol 2001;37:1478 –1492. 2. Chatzizisis YS, Coskun AU, Jonas M, Edelman ER, Stone PH, Feldman CL. Risk stratification of individual
coronary lesions using local endothelial shear stress: a new paradigm for managing coronary artery disease Curr- Opin Cardiol 2007a;22:552– 564.
3. Herrington D, Johnson T, Santago P, Snyder W. Semi-automated boundary detection for intravascular ultrasound. In: Computers in Cardiology Proceedings. Durham, NC, USA. IEEE. October 1992;103–106.
4. Sonka M, Zhang X, Siebes M, Bissing M, DeJong S, Collins S, McKay C. Segmentation of intravascular ultrasound images: A knowledgebased approach. IEEE Trans. Medical Imaging 1995;14:719 –732.
5. Kompatsiaris I, Tzovaras D, Koutkias V, Strintzis, M. Deformable boundary detection of stents in angiographic images. IEEE Trans Med Imaging 2000;19:652– 662.
Plissiti M, Fotiadis D, Michalis L, Bozios G. An automated method for lumen and media-adventitia border detection in a sequence of IVUS frames. IEEE Trans Inform Tech Biomed 2004.
BIOGRAPHY