ABSTRACT
FANG, YUAN. Optimization of Daylighting and Energy Performance Using Parametric Design, Simulation Modeling, and Genetic Algorithms. (Under the direction of Dr. Soolyeon Cho).
With the increasing demand for sustainable design and green buildings, performance is
becoming an important driving force behind design decisions. Currently, however, only limited design options have been explored, and there are limited performance evaluation methods
available for designers in the early design stages. This research proposes a new building performance optimization process that can help designers evaluate both daylighting and energy performance, generate optimized design options, and understand the relationship between
design variables and performance metrics.
The proposed method of performance optimization utilizes various tools and
technologies including parametric design, building simulation modeling, and Genetic Algorithms. In this method, building design alternatives are extensively explored through parametric design. Daylighting and energy modeling and simulation are performed to evaluate
building performance. Genetic Algorithms is used to identify design options with optimal energy and daylighting performance. A case study was conducted to test and verify the
Optimization of Daylighting and Energy Performance Using Parametric Design, Simulation Modeling, and Genetic Algorithms
by Yuan Fang
A dissertation submitted to the Graduate Faculty of North Carolina State University
in partial fulfillment of the requirements for the degree of
Ph.D. in Design
Design
Raleigh, North Carolina 2017
APPROVED BY:
_______________________________ _______________________________
Soolyeon Cho Robin Abrams Committee Chair
_______________________________ _______________________________
BIOGRAPHY
Yuan Fang was born in 1988, in Harbin, China. She received her Bachelor’s degree in Architecture from Harbin Institute of Technology and Master’s degree in Architecture from Tianjin University. During her study, she was involved in number of architectural design and
research projects.
She joined Ph.D. in Design program at North Carolina State University in 2013. She has
conducted extensive research on building daylighting and energy performance optimization, green buildings design, renewable energy systems integration, and thermal comfort analysis.
She worked as a teaching assistant for Dr. Soolyeon Cho in Energy Modeling and Simulation
ACKNOWLEDGMENTS
I would like to thank my advisor, Dr. Soolyeon Cho who offered me the opportunity to pursue this research. He provides generous support, decisive guidance and essential advice throughout my research. I would like to thank my committee Dr. Robin Abrams, Dr. Jianxin Hu and Dr.
Emily Griffith for their constant supports and constructive feedback.
Special thanks to Mostapha Sadeghipour Roudsari, who developed the Ladybug and
Honeybee, which are environmental plugins for Grasshopper. Without his excellent work, the research could not be possible. Thanks to Chris Mackey, who provide detailed tutorials to help beginners start their energy modeling work. Thanks to all the members of the Ladybug and
Honeybee online community, who generous share their work and ideas to help me overcome the obstacles in my research.
TABLE OF CONTENTS
LIST OF TABLES ... viii
LIST OF FIGURES ... xi
CHAPTER 1: INTRODUCTION ...1
1.1 Problem Statement... 1
1.2 Research Purpose ... 2
CHAPTER 2: LITERATURE REVIEW ...3
2.1 Parametric Design ... 3
2.1 Building and Daylighting ... 6
2.1.1 Benefits of Daylighting ... 6
2.1.2 Daylighting Performance Metrics ... 9
2.1.3 Daylighting Simulation ... 12
2.2 Building and Energy ... 13
2.2.1 Energy Performance Metrics ... 13
2.2.2 Energy Simulation ... 15
2.4 Building Performance Optimization ... 16
2.4.1 Optimization ... 16
2.4.3 Genetic Algorithms ... 19
2.5 Review of Building Performance Optimization Studies ... 21
2.5.1 Optimization of Building Systems ... 22
2.5.2 Optimization of Building Envelope ... 24
2.5.3 Optimization of Building Geometry ... 26
2.6 Summary of Literature Review ... 29
CHAPTER 3: CONCEPTUAL FRAMEWORK AND RESEARCH OBJECTIVES ...31
3.1 Conceptual Framework ... 31
3.2 Research Goals and Objectives... 34
CHAPTER 4: METHODOLOGY ...36
4.1 Research Framework... 36
4.1.1 Overview ... 36
4.1.2 Integrated Daylighting and Energy Simulation ... 37
4.1.3 Daylighting Optimization ... 39
4.1.4 Energy Optimization ... 41
4.1.5 Multi-Objective Optimization... 42
4.2 Research Design ... 44
4.2.1 Case Study Model ... 44
4.2.4 Independent Variables ... 52
4.2.5 Dependent Variables ... 55
CHAPTER 5: RESULTS ...56
5.1 Baseline Design and Performance ... 56
5.2 Optimization Case 1 (Orlando, FL) ... 62
5.2.1 Daylighting Optimization ... 62
5.2.2 Energy Optimization ... 66
5.2.3 Multi Objective Optimization ... 70
5.2.4 Data Analysis ... 74
5.3 Optimization Case 2 (Raleigh, NC) ... 79
5.2.1 Daylighting Optimization ... 79
5.2.2 Energy Optimization ... 82
5.2.3 Multi Objective Optimization ... 86
5.2.4 Data Analysis ... 89
5.4 Optimization Case 3 (Minneapolis, MN) ... 93
5.3.1 Daylighting Optimization ... 93
5.3.2 Energy Optimization ... 97
5.3.3 Multi Objective Optimization ... 100
CHAPTER 6: CONCLUSIONS ...111
6.1 Conclusions ... 111
6.2 Limitations ... 112
6.3 Future Studies ... 113
LIST OF TABLES
Table 2.1 Building types and recommended illuminance values ... 10
Table 2.2 U.S. National Median EUI by Building Type ... 15
Table 4.1 Representative Cities ... 48
Table 4.2 Construction set: DOE Ref 2004 – CZ1-2 - Office ... 50
Table 4.3 Construction set: DOE Ref 2004 - CZ4 - Office ... 50
Table 4.4 Construction set: DOE Ref 2004 - CZ6 - Office ... 51
Table 4.5 Material Information for Radiance ... 51
Table 4.6 Design Variables and Ranges ... 52
Table 5.1 Design Variables of Baseline Building ... 56
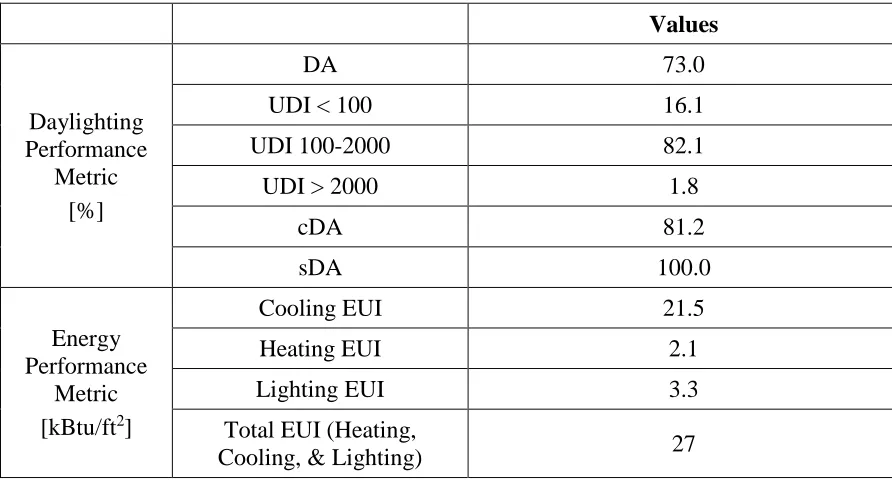
Table 5.2 Daylighting and Energy Performance of Baseline Design ... 60
Table 5.3 Variables of Optimized Design (Orlando, FL) ... 65
Table 5.4 Daylighting and Energy Performance of Optimized Design (Orlando, FL) ... 65
Table 5.5 Variables of Optimized Design (Orlando, FL) ... 69
Table 5.6 Daylighting and Energy Performance of Optimized Design (Orlando, FL) ... 69
Table 5.7 Variables of Pareto Frontiers (Orlando, FL) ... 72
Table 5.8 Daylighting and Energy Performance of Three Options (Orlando, FL) ... 73
Table 5.9 Summary of Fit (Orlando, FL) ... 75
Table 5.10 Effect Summary (Orlando, FL) ... 75
Table 5.11 Parameter Estimates (Orlando, FL) ... 75
Table 5.12 Summary of Fit (Orlando, FL) ... 77
Table 5.15 Variables of Optimized Design (Raleigh, NC) ... 81
Table 5.16 Daylighting and Energy Performance of Optimized Design (Raleigh, NC) ... 81
Table 5.17 Variables of Optimized Design (Raleigh, NC) ... 85
Table 5.18 Daylighting and Energy Performance of Optimized Design (Raleigh, NC) ... 85
Table 5.19 Variables of Pareto Frontiers (Raleigh, NC) ... 88
Table 5.20 Daylighting and Energy Performance of Pareto Frontiers (Raleigh, NC) ... 89
Table 5.21 Summary of Fit (Raleigh, NC) ... 90
Table 5.22 Effect Summary (Raleigh, NC) ... 90
Table 5.23 Parameter Estimates (Raleigh, NC) ... 91
Table 5.24 Summary of Fit (Raleigh, NC) ... 92
Table 5.25 Effect Summary (Raleigh, NC) ... 92
Table 5.26 Parameter Estimates (Raleigh, NC) ... 93
Table 5.27 Variables of Optimized Design (Minneapolis, MN) ... 96
Table 5.28 Daylighting and Energy Performance of Optimized Design (Minneapolis, MN) 96 Table 5.29 Variables of Optimized Design (Minneapolis, MN) ... 99
Table 5.30 Daylighting and Energy Performance of Optimized Design (Minneapolis, MN) 99 Table 5.31 Variables of Pareto Frontiers (Minneapolis, MN) ... 102
Table 5.32 Daylighting and Energy Performance of Pareto Frontiers (Minneapolis, MN) . 103 Table 5.33 Summary of Fit (Minneapolis, MN) ... 104
Table 5.34 Effect Summary (Minneapolis, MN) ... 104
Table 5.35 Parameter Estimates (Minneapolis, MN)... 105
Table 5.38 Parameter Estimates (Minneapolis, MN)... 107
Table 5.39 Comparison of Optimized Design ... 108
Table 5.40 Comparison of Daylighting Optimization Results ... 109
Table 5.41 Comparison of Energy Optimization Results ... 109
Table 5.42 Comparison of Energy Regression Models ... 110
LIST OF FIGURES
Figure 2.1 Parametric Design ... 4
Figure 2.2 Pareto front (red dots) and dominated solutions (green dots) ... 19
Figure 3.1 Building Performance Optimization in Architectural Design Process ... 32
Figure 3.2 Structure of Optimization Tools ... 34
Figure 4.1 Research Diagram ... 37
Figure 4.2 Integrated Daylight and Energy Simulation ... 38
Figure 4.3 Optimization Process in Grasshopper ... 39
Figure 4.4 Daylighting Optimization Process and Tools ... 40
Figure 4.5 Energy Optimization Process and Tools ... 42
Figure 4.6 Multi-Objective Optimization Process and Tools ... 43
Figure 4.7 Case Study Model... 45
Figure 4.8 Placement of Sensors ... 46
Figure 4.9 US Climate Zones (IAQSource, 2016) ... 48
Figure 5.1 Baseline Building Design ... 57
Figure 5.2 Annual Dry Bulb Temperature ... 58
Figure 5.3 Solar Altitude... 59
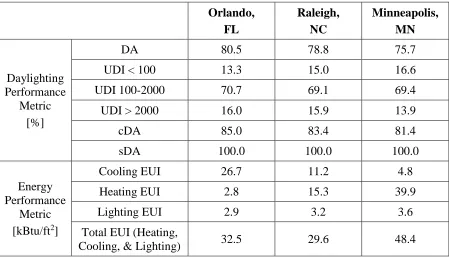
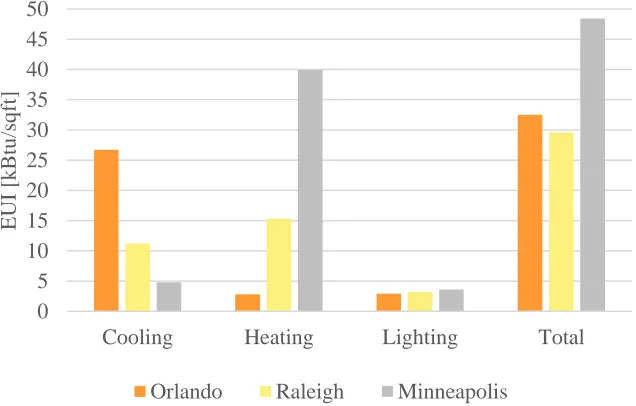
Figure 5.4 Daylighting Performance Metrics of Three Climates ... 61
Figure 5.5 Energy Performance Metrics of Three Climates ... 61
Figure 5.6 Optimization Process in Galapagos (Orlando, FL) ... 63
Figure 5.7 Geometry of Optimized Design for Daylighting (Orlando, FL) ... 64
Figure 5.10 Geometry of Optimized Design for Energy (Orlando, FL) ... 68
Figure 5.11 Daylighting Performance of Optimized Design (Orlando, FL) ... 68
Figure 5.12 Pareto front (Orlando, FL) ... 70
Figure 5.13 Geometry of Pareto Frontiers (Orlando, FL) ... 72
Figure 5.14 Actual by Predicted Plot (Orlando, FL) ... 74
Figure 5.15 Plots of Total Energy against Design Variables (Orlando, FL) ... 76
Figure 5.16 Actual by Predicted Plot (Orlando, FL) ... 77
Figure 5.17 Plot of UDI against Design Variables (Orlando, FL) ... 78
Figure 5.18 Optimization Process in Galapagos (Raleigh, NC) ... 79
Figure 5.19 Geometry of Optimized Design for Daylighting (Raleigh, NC) ... 80
Figure 5.20 Daylighting Performance of Optimized Design (Raleigh, NC) ... 80
Figure 5.21 Optimization Process in Galapagos (Raleigh, NC) ... 83
Figure 5.22 Geometry of Optimized Design for Energy (Raleigh, NC) ... 84
Figure 5.23 Daylighting Performance of Optimized Design (Raleigh, NC) ... 84
Figure 5.24 Pareto frontier (Raleigh, NC) ... 86
Figure 5.25 Geometry of Pareto Frontiers (Raleigh, NC) ... 87
Figure 5.26 Actual by Predicted Plot (Raleigh, NC) ... 90
Figure 5.27 Plots of Total Energy against Design Variables (Raleigh, NC) ... 91
Figure 5.28 Actual by Predicted Plot (Raleigh, NC) ... 92
Figure 5.29 Plot of UDI against Design Variables (Raleigh, NC)... 93
Figure 5.30 Optimization Process in Galapagos (Minneapolis, MN) ... 94
Figure 5.33 Optimization Process in Galapagos (Minneapolis, MN) ... 97
Figure 5.34 Geometry of Optimized Design for Energy (Minneapolis, MN) ... 98
Figure 5.35 Daylighting Performance of Optimized Design (Minneapolis, MN) ... 98
Figure 5.36 Pareto frontier (Minneapolis, MN) ... 100
Figure 5.37 Geometry of Pareto Frontiers (Minneapolis, MN) ... 101
Figure 5.38 Actual by Predicted Plot (Minneapolis, MN) ... 104
Figure 5.39 Plots of Total Energy against Design Variables (Minneapolis, MN) ... 105
Figure 5.40 Actual by Predicted Plot ... 106
CHAPTER 1: INTRODUCTION
1.1 Problem Statement
Because of the Energy Crisis and climate change, there are growing concerns for sustainability around the world. Buildings contribute to one of the largest energy consumption sectors of the
total energy consumed (EIA, 2016). The interior environment of buildings is also closely related to the health and productivity of occupants (Edwards & Torcellini, 2002). Therefore,
the development of green buildings or high performance buildings is becoming an intense research topic. It is important to minimize the energy consumption without sacrificing the comfortable and healthy indoor environment.
With continuous advancement of computational technology, there are numerous building performance simulation tools available for designers and engineers to evaluate various aspects
of building performance. Building performance simulation has been applied to different stages of building design and construction (Augenbroe, 2002).
The early design stage is where most building design decisions are made, and where there is
the greatest potential to achieve high performance building designs (Miles, Sisk, & Moore, 2001). However, design alternatives and how are they are related to building performance are
Therefore, to achieve high performance buildings, it is important to optimize the design process
that can fully explore design possibilities in the early design stage, and push design decisions towards optimal building performance.
1.2 Research Purpose
The primary goal of the research is to develop a building daylighting and energy performance optimization method in the early design stage for designers to make design decisions towards
optimal performance. This optimization method is required to have following features.
First, it can expedite the generation of multiple design alternatives, so that the potential of building design can be extensively explored.
Second, the daylighting and energy performance of each design alternative can be obtained simultaneously.
Third, optimal design options can be found from the large number of design options, and the optimal solution should be reliable.
How this process can be integrated into early architectural design stage, and how the
optimization results would influence the design decisions are discussed. This research also aims to test the applicability of this optimization process through case studies under different
CHAPTER 2: LITERATURE REVIEW
The literature review consists of two main sections. The first section is the review various technologies supporting the building performance optimization process: parametric design, daylighting and energy performance simulation, and genetic algorithms. The second part is the
review of precedent building performance optimization studies and their limitations.
2.1 Parametric Design
In architectural design practice and research, parametric design approach is becoming popular. Parametric design in architecture refers to the modeling process of building geometry using parameters and functions. Parametric design adopts similar programming technologies in
computer science. It has the flexibility of programming, but its graphical user interface and visual codes make it more user friendly than traditional programming languages.
The advantage of parametric design over traditional design method is its ability to quickly generate design alternatives (Gerber, 2009). Parametric design maintains dynamic links between parameters and geometry defined by the parameters. The modification of parametric
values lead to simultaneous updates of the building geometry. Once a parametric building model is developed, design alternatives can be rapidly generated through the manipulation of
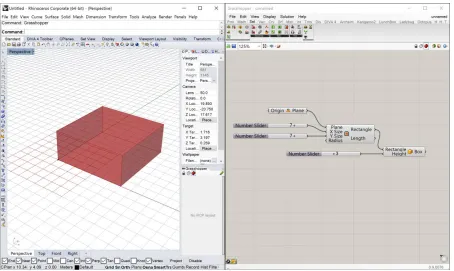
parameters. Figure 2.1 presents one simple example of parametric design. It shows the development of the box geometry involving three functions and three parameters. The three parameters control the width, depth, and height of the box. Different box geometries can be
exploration of patterns and forms. For example, Hemmati and Alavi’s (2016) research
presented different building envelope patterns generated though the data manipulation of one parametric model.
Figure 2.1 Parametric Design
By combining parametric design and building performance evaluation tools, it is able to create design options based on the design performance criteria, such as structural performance,
lighting performance, energy performance. Rolvink, van de Straat, and Coenders (2010) explored building structural system using parametric approaches, and demonstrated how
Furthermore, the exploration of design alternatives can be automated once the parametric
model is developed (Kilian, 2006). Just as computer programming, a certain task can be accomplished automatically once a sequence of instructions are defined by the corresponding code. The automation of the design exploration can significantly save time and provides the
opportunity for optimization.
The disadvantage of parametric design is that the modeling of the initial parametric model
takes longer time than conventional methods. But as the number of design alternatives grows, parametric modeling method will quickly show advantage. Another disadvantage is that the design alternatives generated by a parametric model still follows the same design concept, and
have lots of similarities. If the intent is to compare completely different design options, the parametric design method is not appropriate.
Eltaweel and Su (2017) reviewed that parametric design software was first developed in 2008, and the prevalent tools include Catia, 3D MAX, 3D Maya, Rivet, Grasshopper, Dynamo, Generative Components, Marionette, and Modelur. The most popular parametric design
software is Grasshopper, which is a plugin for the NURBS (Non-Uniform Rational Basis Spline) modeling software Rhinoceros.
Grasshopper is an open software which can be enhanced by plugins. The plugins target various areas such as building geometry development, building structure, environmental analysis, mechanical engineering. Ladybug and Honeybee (Roudsari & Pak, 2016), Geco, Diva and
normal energy modeling process, the required input data are usually climatic data, building
geometry, materials, occupancy and several other schedules and HVAC description and operation. Their output usually includes energy consumption, thermal and visual comfort metrics, and daylight metrics.
2.1 Building and Daylighting
2.1.1 Benefits of Daylighting
Properly designed daylighting environment can significantly enhance the health and productivity of occupants, and improve the energy efficiency of buildings.
Edwards and Torcellini (2002) reviewed the effects of natural light on building occupants, and
summarized that daylighting was found to be associated with higher productivity, lower absenteeism, improved mood, reduced fatigue, and reduced eyestrain. Solar radiation on the
skin is essential for human body to produce vitamin D (Holick, 2004). Vitamin D is essential for the general health and well-being of people, and vitamin D deficiency has been proven to increase the risks of many common cancers, diabetes, autoimmune disease, and sclerosis
(Holick, 2004). Full-spectrum light from the sun is the best type of light for human eyes’ function, whereas most artificial light are concentrated in certain portion of the spectrum, and
Researchers also found various benefits of daylight in different building types. In hospitals and
assisted-living communities, daylight can improve the physiological and psychological states of both patients and staff (Edwards & Torcellini, 2002). Proper lighting environment can ease pain, reduce depression of patients, decrease length of stay in hospitals, and lessen agitation
among dementia patients (Joseph, 2006). Walch et al. (2005) found that patients staying on the bright side of the hospital took 22% less painkilling medication per hour. Choi, Beltran, and
Kim (2012) found a significant relationship between indoor daylight environments and a patient’s average length of stay (ALOS) in a hospital, and the ALOS of patients in rooms
located in the southeast area was 16% - 41% shorter than that in the northwest area.
The benefits of daylight in office environments include reduced absenteeism, increased productivity, financial savings (Edwards & Torcellini, 2002). People prefer to work in daylight
to artificial light and they prefer to be close to windows (Joseph, 2006). Leather, Pyrgas, Beale, and Lawrence (1998) found the area of sunlight penetration is significant positively related to job satisfaction, and negatively related to intention to quit. A successful example of daylighting in commercial office is Lockheed’s Building 157 in Sunnyvale, California, which has
15-foot-high window walls, sloped ceilings, and a central atrium to bring daylight deep into the
building (Romm & Browning, 1994). Absenteeism dropped 15 percent and productivity rose 15 percent, which helped Lockheed win a $1.5 billion defense contract (Romm & Browning, 1994).
(1997) compared the scores of students from schools using daylighting to schools using
artificial light, and found students from daylit schools have higher scores in reading and math tests.
Another important benefit of daylighting is energy savings. Alrubaih et al. (2013) reviewed
that artificial lighting systems consume about 25%-40% of the total energy consumption of buildings, and daylighting as an alternative to artificial lighting is considered to be one of the
simplest method to improve energy efficiency. Daylight by itself does not lead to energy savings. Cost and energy savings are achieved through lighting control strategies and photo sensors, when artificial lighting can be dimmed or switch off when daylight is sufficient
(Wong, 2017). Lockheed’s Building 157 saved about 75 percent on its lighting bill, and the its energy costs was about half of a typical building constructed at that time (Romm & Browning,
1994). Opdal and Brekke (1995) compared the energy savings result from calculation and measurements and found 40% of lighting energy savings from calculation and 30% of lighting energy savings from measurements. Lee and Selkowitz (2006) performed a 9-month field study
in the mockup of a commercial building in New York, and found 20–23% and 52–59% energy savings in two areas of the space through automated roller shades and daylighting controls.
In addition to the potential to reduce lighting energy, daylighting can also lower the building’s
cooling load by reducing the heat released by the lighting fixtures. However, excessive glazing area may contribute to great heat loss and heat gain, and increase the heating and cooling
designed, so that the advantages of reduced lighting and cooling energy can overcome the
disadvantages of increased heat loss and heat gain.
2.1.2 Daylighting Performance Metrics
Various performance metrics were defined by researchers to evaluate the quantity of natural
light on task surfaces in the interior space. The most used metrics are discussed below.
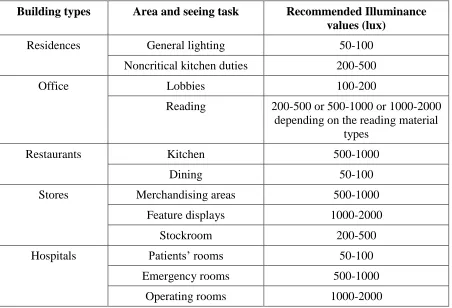
Illuminance
Illuminance measures the amount of light on a surface per unit area, and its unit is lux. Illuminance is the most commonly used metric to evaluate the brightness of the indoor environment. Recommended levels of illuminance are defined by the Illuminating Engineering
Society (IES) according to the space type, the type of visual tasks, the age of occupants, etc. Table 2.1 shows some examples of the recommended illuminance values for different building
types and seeing tasks (DiLaura, Houser, Mistrick, & Steffy, 2011).
Daylight factor (DF)
Daylight factor (DF) measures the ratio of the indoor illuminance to the outdoor illuminance
under overcast sky conditions. DF is easy to measure and calculate, and its concept is intuitive. Thus it is the most frequently used metric to evaluate the daylight condition of a building.
Table 2.1 Building types and recommended illuminance values
Building types Area and seeing task Recommended Illuminance values (lux)
Residences General lighting 50-100
Noncritical kitchen duties 200-500
Office Lobbies 100-200
Reading 200-500 or 500-1000 or 1000-2000
depending on the reading material types
Restaurants Kitchen 500-1000
Dining 50-100
Stores Merchandising areas 500-1000
Feature displays 1000-2000
Stockroom 200-500
Hospitals Patients’ rooms 50-100
Emergency rooms 500-1000
Operating rooms 1000-2000
Daylight autonomy (DA)
Daylight autonomy (DA) is the ratio of the number of hours in the year when the illuminance provided by daylighting is above the minimum illuminance requirement, to the total number
of hours occupied in a year (Reinhart & Walkenhorst, 2001). DA is a dynamic daylighting metric. Dynamic daylight metrics are based on time series of illuminances, which are based on
consider the quantity and features of daily variations of daylight together with irregular
meteorological events (Reinhart, Mardaljevic, & Rogers, 2006).
Useful daylight illuminance (UDI)
Useful daylight illuminance (UDI) is the ratio of the number of hours in the year when
illuminance provided by daylighting is within a useful range, to the total number of occupied hours in a year (Nabil & Mardaljevic, 2005). UDI aims to determine the daylighting level that
is neither too dark nor too bright (Reinhart, Mardaljevic, & Rogers, 2006). UDI is usually presented by three metrics: UDI <100 lux, UDI 100-200 lux, and UDI >2000 lux. The illuminance range that considered useful is between 100 lux to 2000 lux. Illuminance below
100 lux in considered as too dark, and illuminance above 2000 lux is considered too bright.
Continuous Daylight Autonomy (cDA)
Continuous Daylight Autonomy (cDA) is similar as DA, but it provides partial credit to the times when the illuminance is below minimum requirement (Rogers, 2006). For example, the minimum illuminance requirement of a space is 300 lux, and at a certain time step the
illuminance is 150 lux. DA would give it 0 credit, while cDA would give it 0.5 credit.
Spatial Daylight Autonomy (sDA)
Annual Sunlight Exposure (ASE)
Annual Sunlight Exposure (ASE) is the percentage of area that exceeds specified illuminance for more than a specified percentage of hours in a year (Heschong et al., 2012). sDA and ASE are usually used together to evaluate the daylighting condition of the space.
2.1.3 Daylighting Simulation
Wong (2017) reviewed various methods to evaluate daylighting performance of buildings,
including scale models with simulator, mathematical models, full scale models for field measurement, and computer simulation software. This review evaluated the strengths and weaknesses of each method, and found that computer simulation method is the most commonly
used in the building design stage because of its capability of involving design variants and its accurate results.
Wong (2017) also provided an extensive review of computer simulation tools for daylighting performance, and the most frequently used programs are Radiance, Adeline, Ecotect, DOE, Daysim, and EnergyPlus. There are two most utilized illumination algorithms in daylighting
simulation programs: ray-tracing (view-dependent algorithm) and radiosity (scene-dependent algorithm), which can be respectively represented by Radiance and Relux (Yu & Su, 2015).
One major drawback of Radiance is the lack of user interface, so it is usually incorporated as
a lighting simulation engine within other tools, such as Daysim (Ochoa et al., 2011).
2.2 Building and Energy
2.2.1 Energy Performance Metrics
Since the energy crisis in the 1970s, there are growing concerns for energy conservation and the use of renewable energy resources. Energy production is related to air pollution and global
climate, which can directly lead to the prevalence of certain disease (Brown, Henze, & Milford, 2017).
Buildings, industries and transportation systems are the three major sectors in energy
consumption. Energy consumed in the buildings accounts for about 20% of the total energy consumed worldwide (EIA, 2016). In the U.S., buildings sector accounts for about 41% of total
energy consumption in 2010, which is 44% more than the transportation sector and 36% more than the industrial sector (D&R International, 2012).
Energy consumption in buildings has increased dramatically worldwide over the past few
decades, and it is expected to keep growing. According to EIA (2016), energy consumption in buildings is expected to increase by an average of 1.5% per year from 2012 to 2040. Cao, Dai,
To evaluate the energy performance of buildings, it is necessary to compare the calculated or
measured building performance metrics to some reference values, which may represent the energy-related characteristics of the building components or the energy consumption of building systems (Borgstein, Lamberts, & Hensen, 2016). It is increasingly common to
evaluate building performance based on normalized whole-building energy consumption metrics, such as Energy Use Intensity (EUI) (Borgstein, Lamberts, & Hensen, 2016).
EUI is the energy per square foot per year, and it is calculated by dividing the total yearly energy consumption of the building by its total gross floor area (EPA, 2016c). Table 2.2 summarizes U.S. national median EUI values for some typical building types (EPA, 2016b). These values can be used to compare a property’s energy use to the national median. Source
energy reflects the total amount of raw fuel required to operate the building, while site energy
is the amount of heat and electricity consumed by a building which is usually shown in utility bills (EPA, 2016a).
Generally, lower EUI indicates better energy performance of a building. Building energy use
can be influenced by numerous internal and external factors such as weather, plug loads, and occupant schedules, and certain building types always have higher EUI than others (EPA,
Table 2.2 U.S. National Median EUI by Building Type
Primary Function Source EUI (kBtu/ft2) Site EUI (kBtu/ft2)
Restaurant 432 223.8
Hospital 389.8 196.9
College/University 262.6 130.7
Mall 235.6 93.7
Hotel 162.1 73.4
Office 148.1 67.3
K-12 School 141.4 58.2
Laboratory 123.1 78.8
Residence Hall/Dormitory 114.9 73.9
2.2.2 Energy Simulation
Building energy modeling and simulation is the process of predicting a building’s energy performance prior to the building construction. It analyzes the energy consumption of a building at the design stage and it can speed up the design process, increase efficiency, enable
the exploration of multiple design variants, and finally lead to more optimal designs (Augenbroe, 2002).
Before the prevalence of building simulation technologies, architects and engineers relied heavily on manual calculations and often use ‘rule-of-thumb’ methods and extrapolations in
With the development of computers, there is a rapid proliferation of building performance
simulation tools in the past few decades. Those tools are becoming more easily for designers to use because of the improved user interface, reduced calculation time, easy data transfer between programs, and intuitive result display. The most popular energy modeling tools
include DOE-2, EnergyPlus, Energy 10, TRNSYS, HAP, IES-VE, and TRACE 700. These tools focus on various aspects of building performance, including building energy efficiency
and consumption, thermal comfort, ventilation and indoor air quality, lighting environment, and acoustic environment (Wang & Zhai, 2016).
The EnergyPlus is one of the most popular building performance simulation programs. It is an
advanced whole-building energy simulation engine, and it can be used to model both energy consumption and water use in buildings. The EnergyPlus simulation result is highly accurate,
and it was validated by different researchers (Mateus, Pinto, & da Graca, 2014; Anđelković, Mujan, & Dakić, 2016). EnergyPlus is funded by the U.S. Department of Energy, and it is a free, open-source, and cross-platform software.
2.4 Building Performance Optimization
2.4.1 Optimization
One common approach that designers seek the best design solution is “design of experiment” and comparison, where different design variables are combined to establish multiple design alternatives, and the optimal design is found through the comparison of their performances.
For example, Mahmoud and Elghazi (2016) used an experimental method to the evaluation of
kinetic facades system performance, and found optimal design solutions with best daylight performance. Ho, Chiang, Chou, Chang, and Lee (2008) explored the performance of 4 types of shading designs with different height and width combination for a classroom design, and
found the optimal design with maximum uniform illumination distribution. However, only limited design options can be explored in this method.
Optimization is the process or methodology of making a design or decision as functional or effective as possible (Merriam Webster Online, 2017). Mathematically, optimization is the process of finding the minimum or maximum value of a function by choosing the best value
of variables. Optimization provides the possibility to explore a large number of design solutions efficiently, but the transfer of a building design problem into the mathematical
domain is not an easy task. With the development of parametric design, building performance simulation and optimization technologies in recent years, optimization of building performance has become possible. The applications of mathematical optimization started since
the 1980s and 1990s, but most studies in building performance optimization with building energy simulation and an algorithmic optimization engine were published in the late 2000s
(Nguyen, Reiter, & Rigo, 2014).
Building performance optimization is usually considered as a process automated by a building simulation program and an optimization engine, which consists of optimization algorithms
Optimization process usually requires two types of inputs: variables and objective functions.
In building performance optimization, variables are the values controlling the geometry or properties of the design, and objective functions are the building performance metrics usually calculated by simulation tools (Machairas, Tsangrassoulis, & Axarli, 2014). Typical design
variables explored in optimization studies are the orientation of a building, the shape of a building, construction dimensions, construction materials, window to wall ratio, lighting
equipment, and HVAC system sizes. Optimization methods were applied to a wide variety of building design problems such as energy, cost, orientation, façade design, thermal comfort, daylighting, massing, structure, and life cycle analysis (Machairas, Tsangrassoulis, & Axarli,
2014).
2.4.2 Multi-Objective Optimization
In building design problems, designers often need to deal with multiple conflicting objectives, such as maximum thermal comfort versus minimum energy consumption, or maximum equipment capacity versus minimum cost. There are two common methods to solve this
problem. The first method is weighted sum model, where different weight is applied to various objectives, and the weighted objectives are summed up to a single cost function. Then the
problem is transformed to a single objective problem. Weighted sum approach is easy to apply, but the result heavily depends on the weigh allocated to each objective, which require professional knowledge and experience.
2013). For example, a two-objective minimization problem is illustrated in Figure 2.4. The two
objectives are a and b. The solutions shown in red squares are non-dominated since there are no solutions with better performance in both objectives. They are called non-dominated solutions and make up the Pareto front. All the green dots are dominated solutions, since there
are solutions that are better in both objectives. Genetic algorithms show strong advantages in solving multi-objective problems.
Figure 2.2 Pareto front (red dots) and dominated solutions (green dots)
2.4.3 Genetic Algorithms
It is important to choose the proper optimization algorithm for different optimization problems.
Numerous types of optimization algorithms have been developed in recent years. Nguyen, Reiter, and Rigo (2014) reviewed the different optimization algorithms, and classified them as local or global methods, deterministic or stochastic methods, heuristic or meta-heuristic
algorithms, etc. The strength and weakness, and typical algorithms of each family were also
thoroughly reviewed. Similar reviews were also conducted by Evins (2013), and Machairas, Tsangrassoulis, and Axarli (2014).
From the review of previous studies, it can be concluded that the stochastic population-based
algorithms, such as Genetic algorithms, Particle swarm optimization, and Hybrid algorithms, were the most frequently used in building performance optimization (Nguyen, Reiter, & Rigo,
2014).
Genetic algorithm is the most popular optimization algorithm in building performance studies. Genetic algorithm was first proposed by Holland (1975) in the 1970s as a heuristic search
method. It is based on the natural selection process in biological evolution (Galletly, 1998). It recurrently modifies a population of solutions using principles that can be observed in nature,
such as selection, crossover, and mutation. Genetic algorithm randomly selects solutions of good performance from the current population and uses them as parents to produce the next generation, and the population "evolves" toward an optimal solution (MathWorks, 2016). It is
suitable for building performance optimization for the following few reason: it can handle both continuous and discrete variables; it allows parallel simulations on multi-processor computers;
it is suited to solve multi-objective problems; it is robust in handing discontinuity, multi-modal, and constrained problems; it is robust to high simulation failure rates (Nguyen, Reiter, & Rigo, 2014).
optimization tools for building design (Machairas, Tsangrassoulis, & Axarli, 2014). Custom
programmed algorithms are the most flexible, but advanced programming skills are required. Examples of optimization tools for building design include MultiOpt (Chantrelle, Lahmidi, Keilholz, El Mankibi, & Michel, 2011), GENE_ARCH (Caldas, 2008), ParaGen (Turrin, von
Buelow, & Stouffs, 2011). These tools are developed by third party developers, but they are not widely used and their performance is not widely tested and validated.
Currently, the optimization packages are becoming popular because they do not require advanced programming skills, have enough flexibility, and users can work in familiar software environment. Genetic algorithm based optimization packages are available in the Grasshopper
parametric modeling environment. Galapagos is one example which is able to conduct single objective optimization. Labib (2015) used Galapagos to study the interaction between light
shelves and complex ceiling forms for optimized daylighting performance. Ercan and Elias-Ozkan (2015) also used Galapagos to optimize the design of shading devices for daylighting performance. Octopus is also a plugin for Grasshopper, which is based on genetic algorithm
and can produce trade-off solutions for multi-objective optimization problems. Zhang, Zhang, & Wang (2016) performed a multi-objective optimization of a community center building
using Grasshopper and Octopus.
2.5 Review of Building Performance Optimization Studies
The number of building performance optimization papers has increased significantly in recent
focused on renewable energy generation, and the others focused on control strategies and
lighting systems. 53% of the studies addressed single objective optimization; 8% of the studies used weighted sum approach in objective optimization, and 39% applied Pareto multi-objective optimization (Evins, 2013). Genetic Algorithm was the most common optimization
method, which was used in more than half of the works, and the other popular methods are direct search, simulated annealing, particle swarm (Evins, 2013). The most common
optimization objective was energy consumption, which was found in 60% of the studies, and the other common objectives are cost, comfort, daylight performance, CO2 emission, etc (Evins, 2013).
In this review, precedent building performance optimization studies are categorized according to their major area of optimization: building systems, building envelope, and building
geometry.
2.5.1 Optimization of Building Systems
HVAC system
The Heating, Ventilation and Air Conditioning (HVAC) systems are essential to maintain comfortable interior thermal environment, and they have significant influence on the building
Wright, Loosemore, and Farmani (2002) investigated a multi-objective genetic algorithm
optimization method to identify the optimum pay-off between energy cost and occupant thermal discomfort. The 11 design variables were all related to HVAC system, such as supply air temperature, supply air flow rate, coil width, coil height, number of rows, number of
circuits, and maximum flow rate. Feasible solutions were found within a few generations.
Kusiak and Xu (2012) performed a multi-objective optimization of HVAC system to achieve
minimum energy consumption while maintaining acceptable indoor room temperature. The optimization model was based on particle swarm optimization algorithm. 21 parameters were selected as the candidates for the optimization model, and these parameters include supply air
temperature, fan speed, room temperature, room humidity. The optimized model was applied on the actual HVAC system, and it demonstrated 29.99% decrease in energy consumption.
Renewable energy system
While sustainable design strategies can reduce the energy demand of buildings, renewable energy system can generate energy for building’s demand, and achieve low or zero carbon
buildings. Renewable energy systems explored in building performance optimization studies include combined heat and power systems, solar technologies, and ground energy and storage
Kayo and Ooka (2009) used multi-objective genetic algorithm to optimize a distributed energy
system. The objectives are the minimization of energy consumption and cost, and design variables are different levels of cool heat supply, hot heat supply, hot water supply, and electricity supply. This method was applied to a hospital building in Tokyo, and optimal design
options were found.
Fan and Xia (2017) presented a weighted sum multi-objective optimization for building
envelop retrofitting. Rooftop solar panel system was also taken into consideration. The optimization objective is to maximize energy savings and economic benefits. Design variables are solar panel types, and window, wall, roof materials. The result showed that, the optimal
retrofitting plan would yield promising energy savings with acceptable economic benefits in a 24-year period.
2.5.2 Optimization of Building Envelope
Building envelop is the physical separator between the interior and exterior environment, which has great influence on the building performance. Building envelop optimization studies
mostly concerned the selection of construction types and building materials, and some studies considered basic shape variables like window to wall ratio and orientation. The most
Schwartz, Raslan, and Mumovic (2016) proposed a multi-objective optimization process for a
residential complex refurbishment. The optimization objectives are minimum life cycle carbon footprint and life cycle cost over 60 years. The variables are the wall insulation materials, thermal bridge insulation, and window to wall ratios. The study successfully found the optimal
design solutions. The results also indicate that the optimization of annual energy consumption, which is more commonly considered, might result in higher life cycle CO2 emissions.
Ascione, Bianco, De Masi, Mauro, & Vanoli (2015) adopted a multi-objective approach to optimize the energy performance and thermal comfort, and the methodology was applied to a residential building in two different Mediterranean climates. The problem was solved using
Genetic Algorithm in MATLAB and energy simulation engine EnergyPlus. Design variables were related to the thermo-physical performance of the building envelop, such as the thermal
transmittance, the thermal capacity, thickness of materials, and the radiative properties of external coatings. This methodology was considered effective, and different optimization results were found for the different climates.
Azari, Garshasbi, Amini, Rashed-Ali, and Mohammadi (2016) utilized a multi-objective optimization method to optimized energy consumption and life cycle impacts on the
environment. Design variables include insulation materials, window types, window frame materials, wall thermal resistance, and window-to-wall ratios. The energy simulation tool was eQuest 3.65 and environmental impact estimation tool was Athena IE. A hybrid artificial neural
network and genetic algorithm was used as the optimization method.
Lartigue, Lasternas, and Loftness (2013) provided a methodology for optimizing the building
envelope with respect to minimum heating load, minimum cooling load and maximum daylight. The variables to optimize are the window to wall ratio and the window type. Energy performance simulation software was TRNSYS, daylighting simulation software was Daysim,
and optimization tool was GenOpt. Trade-off solutions between different objectives were found using Pareto approach.
Carlucci, Cattarin, Causone, and Pagliano (2015) presented a multi-objective optimization of a net zero-energy house in southern Italy to minimize thermal and visual discomfort. The four objectives are minimum thermal discomfort during winter and summer and minimum visual
discomfort due to glare and inappropriate daylight level. EnergyPlus was the daylighting and energy simulation engine, and GenOpt was the optimization engine. Design variables include
wall, roof, floor materials, glazing materials, control strategies for shading devices, and opening of windows.
2.5.3 Optimization of Building Geometry
One of the most important design decisions made in early design stage is the building form, shape, or geometry. It does not only determine the aesthetics and functions of a building, but also greatly influences a building’s energy and daylighting performance. The main design
Tuhus-Dubrow and Krarti (2010) developed a simulation–optimization tool to optimize
building shape and building envelop features. This tool coupled a genetic algorithm to a building energy simulation engine, and aimed to find optimal building design for minimum energy consumption. Different building shapes, including rectangle, L, T, cross, U, H, and
trapezoid were investigated. Building envelope features, including wall and roof constructions, foundation types, insulation levels, and window types and sizes were also considered. The
optimization results indicated that rectangular and trapezoidal shaped buildings generally have lowest life-cycle cost.
Lin and Gerber (2014) developed an Evolutionary energy performance feedback for design
(EEPFD) methodology using parametric design and multi-objective optimization. A prototype tool, H.D.S. Beagle, was also developed to facilitate the development of the methodology.
H.D.S. was a plug-in for Autodesk Revit, which integrates Autodesk Green Building Studio and Microsoft Excel. Optimization objectives were spatial programing compliance, energy performance, and financial performance. Complex building geometries with multiple design
variables were explored in the research.
Futrell et al. (2015) used a bi-objective optimization method to investigate building design for
minimum energy demand and maximum daylight. Design variables were ceiling height, window transmittance, window width, shade length, and light shelf length. A classroom design in Charlotte, NC was optimized for north, south, east, and west orientations. For each
front. Results showed that for the south, east, and west orientations, energy and daylighting
performance are not in strong conflict. A stronger conflict was found for the north orientation.
Caruso and Kämpf (2015) optimized the three-dimensional form of buildings for minimum energy consumption due to solar irradiation. A cumulative sky model approach was used for
the computation of solar irradiation on the building envelope, and an evolutionary algorithm was used to find the optimal building form. Various families of building forms were
investigated, and optimal shapes were found.
Ercan and Elias-Ozkan (2015) presented a methodology to explore shading device design alternatives for optimal daylight performance in an office building in a hot and humid climate.
Parametric design tool Grasshopper was used to generate design alternatives for shading devices with four design variables. The optimization objective was minimum solar irradiation
and the variance between the analysis nodes. Weighted sum approach was used to solve this multi-objective optimization problem.
Zhang et al. (2016) provided an approach to optimize the shape of free-form building based on
solar radiation and space efficiency. Rhinoceros and Grasshopper was used to develop the parametric free-form building model. A multi-objective genetic algorithm was used to find
trade-offs between the three objectives: maximum solar radiation gain, maximum space efficiency, and minimum shape coefficient. Compared to a cube-shaped reference building, the optimized free-form shape building achieved 30–53% higher solar radiation, 15-20% lower
2.6 Summary of Literature Review
The findings from the literature review are summarized below:
First, design decisions made in the early design stage have significant impacts on the building’s daylighting and energy performance. Great performance improvement was found after
implementing building performance optimization. However, there are not enough tools and methodologies for designer to easily evaluate and optimize their design in early design stage.
Second, daylighting is an essential part of interior environment for occupants’ health and comfort. It is also an effective sustainable strategy to improve buildings’ energy performance. Even though there are a growing number of studies on the optimization of building
performance, daylighting performance were usually not one of the optimization objectives to be considered.
Third, precedent building performance optimization studies usually employed fixed building geometry, and the variables to be optimized were physical properties of material or settings of building systems. The studies that evaluated alteration in building shapes were restricted to
simplified performance objectives, such as solar radiation. There is a lack of studies that combined both variance in building geometry and sophisticated energy modeling and
simulation process.
Fourth, parametric design is found to be a powerful approach in generating design alternatives, and the combination of Rhino and Grasshopper was the most used parametric design tools.
developed energy and daylighting models are simulated in EnergyPlus and Daysim, which are
two of the most reliable simulation engines in the industry. Galapagos and Octopus are genetic algorithm based optimization engines in Grasshopper. Genetic algorithms were the most popular optimization algorithms in building performance optimization, and were proved to be
reliable in both single-objective and multi-objective problems.
This research aims to establish a building performance optimization process considering both
CHAPTER 3: CONCEPTUAL FRAMEWORK AND RESEARCH OBJECTIVES
3.1 Conceptual Framework
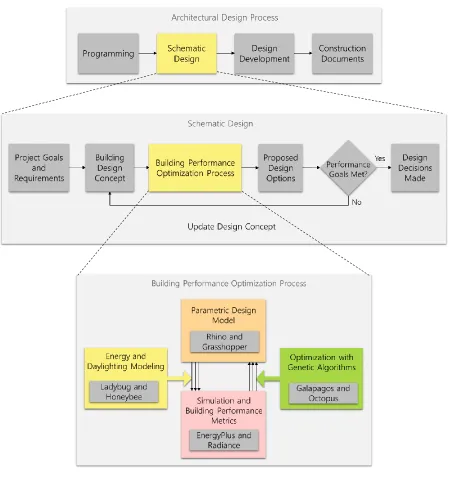
The proposed building performance optimization process is integrated in schematic design phase, which is an important early architectural design phase (Figure 3.1). After understanding
the project goals and requirements, architects develop preliminary building design concept, including study drawings illustrating the spatial relationships, scale, and form of the design.
The building performance optimization process aims to provide designers with optimized design options without compromising original building design concept. If the proposed design options are meet the performance target and other design requirements, the design will be
continued into the next design stages. If it is not satisfactory, initial design concept could be modified and this optimization process could be repeated multiple times, until a desirable
design is obtained.
The four main components inside the framework are parametric building design, energy and daylight modeling, simulation and building performance metric, and optimization. The goal is
to seamlessly connect the four components, and automate the building design generation, performance simulations and optimization process.
Figure 3.1 Building Performance Optimization in Architectural Design Process
In energy and daylight modeling process, detailed building information is assigned to the
Honeybee. Ladybug provides the main functions of energy and daylighting modeling, while
Honeybee is used for the manipulation and visualization of weather data and simulation data. Ladybug will generate an idf file for energy simulation in EnergyPlus and a rad file for daylight simulation in Radiance. After simulation, Ladybug imports simulation result file back to
grasshopper, and read the energy and daylight performance metrics.
The optimization process needs two type of input: variables and fitness function. In building
performance optimization, variables are the building design variables in grasshopper that can control the building geometry. The fitness function is the energy or daylight performance metrics calculated by the simulation engine. For single objective optimization, the fitness
function is the minimum or maximum value of the performance metric, such as minimum energy load or maximum UID. Then genetic algorithm is used to examine the relationship
between design parameters and performance metrics, and generate new design options towards better performance. For multi-objective optimization, multi-objective genetic algorithm is used to find the Pareto front, which is the trade-off solutions between different objectives. The
optimization process is stopped at a user specified criterion, such as total simulation time.
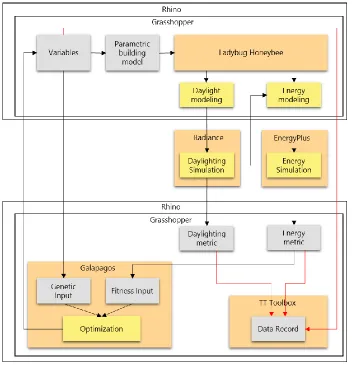
Each component requires different tools, and the structure of the tools is shown in Figure 3.2.
Rhino is a 3D NURBS modeling tool. Grasshopper is a plug-in for Rhino, and it provides parametric modeling platform that integrates the functions in Rhino and other add-on programs. Ladybug, Honeybee, Galapagos, Octopus, and TT toolbox are plug-ins for
and Octopus are optimization tools. Galapagos is for single objective optimization, and
Octopus is for multi-objective optimization. TT toolbox is used to record each simulation data, and export the data to an Excel document.
Figure 3.2 Structure of Optimization Tools
3.2 Research Goals and Objectives
The goal of the research is to develop and verify an optimization process for high performance buildings design. This process can help designers identify designs with optimized daylighting and energy results, and understand how design parameters influence building performances.
To achieve the goal, objectives are specified as follows:
1. Define a case study model, building design variables, and optimization objectives.
2. Develop the optimization framework with a parametric design model, energy and
3. Use this framework to optimize daylighting and energy performance of the case study
building respectively, and optimize both daylighting and energy performance using multi-objective optimization techniques.
4. Analyze the data from the optimization process, and examine the relationship between
design variables and performance metrics. Compare the three optimization results, and propose best design solutions. Compare the optimization results of the same design in
different climate zones.
5. Summarize the research findings. Identify the limitations in the optimization process,
CHAPTER 4: METHODOLOGY
4.1 Research Framework
4.1.1 Overview
The overall research strategy and process is shown in Figure 4.1. There are four main steps.
The first step is to identify design parameters and build a parametric design model. The second step is the development of daylight and energy model for three optimization cases. The three
cases represent the same building geometry in different climate zones in United States: hot, mixed, and cold climate. The purpose is to compare how the optimization results are different, and how the relationship between design variables and performance are different in the three
climate zones.
The third step is nine optimization processes - a daylighting optimization process, an energy
optimization process, and a multi-objective optimization process considering both daylighting and energy for each climate zone. The reason to separate three optimization processes is to fully explore building design potential under different objectives, and compare the
performance difference.
The fourth step is the analysis and evaluation of simulation data and optimized design after the
optimization processes are accomplished for each climate. The optimal designs are compared visually, and the settings of each optimized design are compared. The building performance improvement, and the variables with the most influence on the building performance are also
Figure 4.1 Research Diagram
4.1.2 Integrated Daylighting and Energy Simulation
To achieve energy savings from daylighting, it is necessary to install lighting control system in the building. Lighting controls can adjust the level of electric light to complement the
illumination provided by daylight, or turn off the light when daylight illuminance is adequate. In building performance simulation, the process is similar. Figure 4.2 illustrates the integrated daylighting and energy simulation process for daylight energy savings. A daylighting
illuminance. Then a year-long lighting schedule will be generated. The schedule will be input
into energy model to incorporate the electrical lighting, heating or cooling energy requirement differences due to daylighting. Ladybug and Honeybee have the functions of exporting and importing lighting schedules, which makes each daylighting and energy simulation sequence
automated.
Figure 4.2 Integrated Daylight and Energy Simulation
Figure 4.3 shows the workflow of this process in grasshopper. Group A is the components for
developing the building geometry. The geometry is connected to components in Group B for energy and daylighting modeling. The daylight model is connected to components in Group C for daylighting simulation. Group D connects both the energy model from Group B and the
Figure 4.3 Optimization Process in Grasshopper
4.1.3 Daylighting Optimization
Figure 4.4 presents the detailed daylighting optimization process. The process begins in Grasshopper with parametric design variables and building geometry. Ladybug and Honeybee provides the functions of daylight and energy modeling. In the daylighting modeling process,
the parametric building geometry is connected to Radiance materials component, with the setting of material transparency, reflectance, etc. Then the building materials are connected to
daylighting simulation component, with the input of weather files, daylighting sensor placement, and other simulation settings. A rad file is generated and daylighting simulation is executed in Radiance. After simulation, Ladybug imports simulation result file back to
grasshopper, reads the daylight performance metrics, and generates an annual lighting schedule.
A
B
D
E
Figure 4.4 Daylighting Optimization Process and Tools
In the energy modeling process, parametric building geometry is connected to EnergyPlus
materials, and connected to a Honeybee thermal zone component. Honeybee automates the process of intersecting the masses, and finding adjacent surfaces. Honeybee assigns construction set, schedules and internal loads for each space based on the building type and
Ladybug brings the energy simulation result back to grasshopper, and reads the energy
performance metrics.
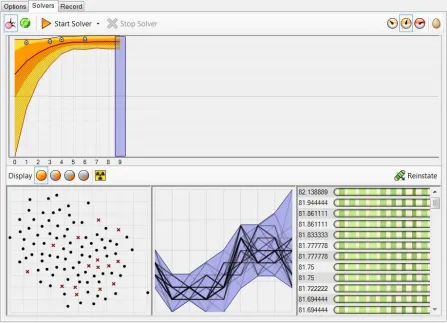
The optimization process uses Galapagos to search for optimal building configurations for the maximum UDI, which is the percentage of hours in a year that the illuminance is between 100
and 200 lux. The design variables are connected to the Genetic input of Galapagos, and the UDI output are connected to the Fitness input. The population size of each generation is 100
with an initial boost of twice the population for the first generation. The design variables, daylighting metrics, and energy metrics of each simulation are automatically exported to an Excel file using TT Toolbox.
4.1.4 Energy Optimization
Figure 4.5 presents the detailed energy optimization process. The overall procedure is the same
as daylighting optimization. The difference is only in the optimization objective, which is the minimum energy required for the building. Therefore, the fitness input for optimization is the total energy load for heating, cooling, and lighting. The design variables, daylighting metrics,
Figure 4.5 Energy Optimization Process and Tools
4.1.5 Multi-Objective Optimization
Multi-objective optimization is also similar as the previous two processes. The only difference is that it uses a different optimization engine, that can evaluate multiple objectives at the same
Figure 4.6 Multi-Objective Optimization Process and Tools
The two objectives are maximum average UID, and minimum total cooling, heating, and
lighting load. The target is to find design with balanced performance between daylighting and energy. Octopus by default find the minimum value of each objectives, so the objective to be maximized (average UDI) should be multiplied by -1. Pareto frontiers with trade-off between
4.2 Research Design
4.2.1 Case Study Model
A simple building geometry is chosen as the case study model, as shown in Figure 4.7. This building is a 3600 square feet office building with a pitched roof. Building shape, sizes of
windows, shadings, and skylights on different parts of the building are explored for optimal daylighting and energy performance. There are three windows on each facade of the building,
and three skylights on the north and south side of the roof. There are horizontal shadings on the south windows, vertical shadings on east and west windows, and no shading on the north windows. To simplify the problem, placement of the doors and the interior partition are not
considered in the optimization process.
The model is developed with OpenStudio open office construction set, loads, schedules, and
(1) Southeast view
(2) Northwest view
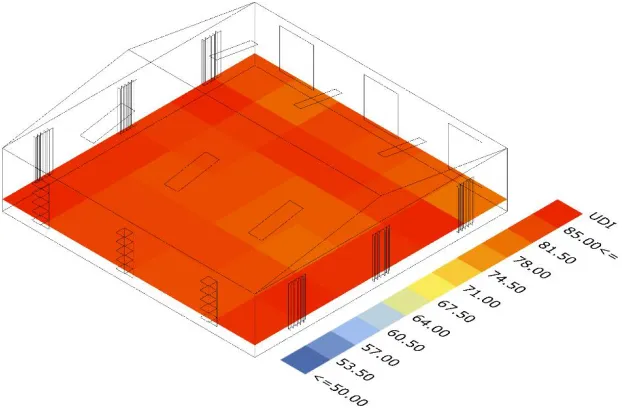
(1) 36 sensors
(2) 35 sensors
4.2.2 Optimization in Three Different Climate Conditions
Climate is one of most important factors that determines buildings’ energy consumption because of the direct relationship between outdoor temperature and building cooling and heating load. Daylighting performance is greatly influenced by the latitude of the building
location.
Figure 4.9 presents the 18 climate zones in the US. Three representative cities are chosen as
the locations for the three optimization cases (Table 4.1). Orlando represents climate zone 2A, which is hot climate. Raleigh represents climate zone 4A, which is mixed climate. Minneapolis represents climate zone 6A, which is cold climates. These three cities present three typical
climate conditions in the US, and they show great difference in both temperature and latitude. The models are built with DOE commercial reference buildings template from OpenStudio.
The construction set and climate files for the three models are listed in Table 4.1.
The main purpose to compare optimization results between climate zones is to see how the same building design would change with the climate features to achieve optimal performance.
Another purpose is to compare if the relationship between design variables and performance metrics are different in different climates. The output to be compared are the geometry of the
Figure 4.9 US Climate Zones (IAQSource, 2016)
Table 4.1 Representative Cities
Climate
Zone City Construction Set Weather File
2A Orlando, Florida DOE Ref 2004 – CZ1-2 - Office
USA_FL_Orlando.Intl.AP.722050_T MY3
4A Raleigh, North Carolina
DOE Ref 2004 - CZ4 - Office
USA_NC_Raleigh-Durham.Intl.AP.723060_TMY3
6A Minneapolis, Minnesota
DOE Ref 2004 - CZ6 - Office