University of Windsor University of Windsor
Scholarship at UWindsor
Scholarship at UWindsor
Electronic Theses and Dissertations Theses, Dissertations, and Major Papers
11-7-2015
Experimental study on vibration mitigation of bridge stay cables
Experimental study on vibration mitigation of bridge stay cables
using cross-ties and hybrid system
using cross-ties and hybrid system
Gnanasekaran Sandanam University of Windsor
Follow this and additional works at: https://scholar.uwindsor.ca/etd
Recommended Citation Recommended Citation
Sandanam, Gnanasekaran, "Experimental study on vibration mitigation of bridge stay cables using cross-ties and hybrid system" (2015). Electronic Theses and Dissertations. 5495.
https://scholar.uwindsor.ca/etd/5495
This online database contains the full-text of PhD dissertations and Masters’ theses of University of Windsor students from 1954 forward. These documents are made available for personal study and research purposes only, in accordance with the Canadian Copyright Act and the Creative Commons license—CC BY-NC-ND (Attribution, Non-Commercial, No Derivative Works). Under this license, works must always be attributed to the copyright holder (original author), cannot be used for any commercial purposes, and may not be altered. Any other use would require the permission of the copyright holder. Students may inquire about withdrawing their dissertation and/or thesis from this database. For additional inquiries, please contact the repository administrator via email
i
Experimental study on vibration mitigation of bridge
stay cables using cross-ties and hybrid system
By
Gnanasekaran Sandanam
A Thesis
Submitted to the Faculty of Graduate Studies
through the Department of Civil & Environmental Engineering in Partial Fulfillment of the Requirements for
the Degree of Master of Applied Science at the University of Windsor
Windsor, Ontario, Canada
2015
ii
Experimental study on vibration mitigation of bridge
stay cables using cross-ties and hybrid system
by
Gnanasekaran Sandanam
APPROVED BY:
______________________________________________ Dr. N. Zamani (Outside Department Reader) Mechanical Automotive & Materials Engineering
______________________________________________ Dr. Amr EI Ragaby (Department Reader)
Department of Civil and Environmental Engineering
______________________________________________ Dr. S. Cheng (Advisor)
Department of Civil and Environmental Engineering
iii
Declaration of originality
I hereby certify that I am the sole author of this thesis and that no part of this thesis
has been published or submitted for publication.
I certify that, to the best of my knowledge, my thesis does not infringe upon
anyone’s copyright nor violate any proprietary rights and that any ideas, techniques,
quotations, or any other material from the work of other people included in my thesis,
published or otherwise, are fully acknowledged in accordance with the standard
referencing practices. Furthermore, to the extent that I have included copyrighted material
that surpasses the bounds of fair dealing within the meaning of the Canada Copyright Act,
I certify that I have obtained a written permission from the copyright owner(s) to include
such material(s) in my thesis and have included copies of such copyright clearances to my
appendix.
I declare that this is a true copy of my thesis, including any final revisions, as
approved by my thesis committee and the Graduate Studies office, and that this thesis has
iv
Abstract
Controlling excessive vibrations of stay cables on cable-stayed bridges is important
to minimize the fatigue failure and damage at the cable anchorages. Using cross-ties to
connect a vulnerable cable with its neighbors to form a cable network and installing
external damper to a cable have been widely used in field. More recently, the idea of adding
damper to an existing network to form a hybrid system was also proposed. Though the
stiffening effect of the cross-tie solution are widely studied by numerous researchers, the
damping property of a network has rarely been investigated. Also, the available studies on
the hybrid system are very limited. In the present work, experimental study was carried out
to investigate the modal behavior of a cable network in terms of its first modal frequency
and damping. The efficiency of the damper-only solution and hybrid system solution with
different configurations were also examined and the results were compared. Then, an
independent finite element simulation was conducted. The two sets of results agree well.
They both indicate that the cross-tie solution improves the stiffness of the target cable, the
damper-only solution enhances its energy dissipation, and the hybrid system increases both
v
Acknowledgements
I am grateful to my supervisor Dr. Shaohong Cheng for all the assistance and
encouragement given throughout the period of research and especially for the advice and
direction to prepare my report. Her broad knowledge in the subject of structural dynamics
was greatly contributed to complete my thesis. My gratitude is extended to my thesis
committee Dr. N. Zammani and Dr. Amr EI Ragaby for the helpful comments for my
thesis. I would like to thank laboratory technologists Mr. Matthew St. Louis, Mr. Lucian
Pop, and Mr. Patrick Seguin for their help with the experimental study. Lastly, I would like
to thank the graduate student Mr. Javaid Ahmad and the exchanged student from Brazil
vi
Table of Contents
DECLARATION OF ORIGINALITY ... iii
ABSTRACT ... iv
ACKNOWLEDGEMENTS ...v
LIST OF FIGURES ... viii
LIST OF TABLES ... xii
INTRODUCTION ...1
1.1 Background ...1
1.2 Mechanisms of wind-induced cable vibrations...1
1.3 Countermeasures to control cable vibration ...4
1.4 Motivation ...6
1.5 Objectives ...7
LITERATURE REVIEW ...9
2.1 Cross-tie solution ...9
2.2 Damper solution ...15
2.3 Hybrid system solution ...16
EXPERIMENTAL STUDY ...20
3.1 Experimental setup...20
3.2 Free vibration test of a single cable ...33
3.2.1 Testing procedure...33
3.2.2 Pre-processing of experimental data ...35
3.2.3 Results ...36
3.3 Forced vibration test of a damped single cable ...41
3.3.1 Testing procedure and data analysis ...42
3.3.2 Results ...43
vii
3.4.1 Setup of cable network ...47
3.4.2 Testing procedure...49
3.4.3 Results ...50
3.5 Forced vibration test of a hybrid system ...55
3.5.1 Testing configurations ...55
3.5.2 Results ...59
NUMERICAL SIMULATION ...65
4.1 Finite element model...65
4.2 Numerical simulation ...69
4.3 Simulation results and comparison with experimental data ...78
COMPARISON OF EFFECTIVENESS OF DIFFERENT VIBRATION CONTROL METHODS ...85
5.1 Effectiveness of external damper ...88
5.2 Effectiveness of cross-tie ...91
5.3 Comparison of cable vibration control efficiency by different systems ...95
CONCLUSIONS AND RECOMMENDATIONS ...97
6.1 Conclusion ...97
6.2 Future recommendations ...100
REFERENCES ...101
APPENDIX A MATLAB CODE TO FIND NATURAL FREQUENCY AND AMPLITUDE OF VIBRATION ...106
APPENDIX B BUTTERWORTH BAND-PASS FILTER DESIGN IN MATLAB ...108
APPENDIX C MATLAB CODE FOR CUBIC SPLINE DATA INTERPOLATION ...109
APPENDIX D SUMMARY OF EXPERIMENTAL STUDY CASES ...110
viii
List of Figures
Figure 1.1 Position of upper rivulet (Gu and Du, 2005) ...2
Figure 1.2 Surface modification of cables (Kleissl and Georgakis, 2011) ...5
Figure 2.1 Experimental setup of cable network (Yamaguachi and Nagahawatta,1995) ....9
Figure 2.2 Fred Hartman Bridge-3D network (Caracoglia and Nichlos, 2007) ...17
Figure 2.3 Prototype network of Fred Hartman Bridge (Caracoglia and Zuo, 2009) ...18
Figure 3.1 Experimental setup of a hybrid system ...21
Figure 3.2 Additional mass blocks installed on cables ...23
Figure 3.3 Setup of Hydraulic pumps ...23
Figure 3.4 Setup of Load cells ...24
Figure 3.5 Calibration curve for load cell1 ...25
Figure.3.6 Calibration curve for load cell 2 ...25
Figure 3.7 Installation of accelerometer on the cable ...26
Figure 3.8 AstroDAQ Xe data acquisition system...27
Figure 3.9 Electronic dynamic smart shaker...28
Figure 3.10 Signal generator ...29
Figure.3.11 Linear viscous damper ...30
Figure.3.12 Experimental setup of damper calibration ...31
Figure 3.13 Damper calibration curve ...31
Figure 3.14 Type of cross-ties ...32
Figure 3.15 Sketch of single cable experimental setup ...33
ix
Figure 3.17 Sample acceleration raw data of a single undamped target cable (Tension 2150
N) ...37
Figure 3.18 Sample power spectral density curve of acceleration time history data of single undamped target cable (Tension 2150 N) ...37
Figure 3.19 Sample curve of filtered cable displacement time history associated with first modal response (Tension 2150 N) ...38
Figure 3.20 Sketch of damper-only experimental setup ...41
Figure 3.21 Maximum Displacement vs. Excitation Frequency...43
Figure 3.22 Sample displacement time history for a single damped cable at excitation frequency of 5.5 Hz ...44
Figure 3.23 Maximum Displacement vs. Excitation Frequency of the single damped cable ...46
Figure 3.24 Sketch of experimental setup of a cable network ...48
Figure 3.25 Installation of cross-tie ...48
Figure 3.26 Connector used to attach cross-tie to main cable ...49
Figure 3.27 Sample acceleration time history raw data of a cable network (rigid type cross-tie located at 1/2L for frequency ratio of 0.7) ...51
Figure 3.28 Sample power spectral density curve of the networked target cable acceleration response (rigid type cross-tie located at 1/2L for frequency ratio of 0.7) ...52
Figure 3.29 Sample curve of the filtered first modal displacement time history of the networked target cable (rigid type cross-tie located at 1/2L for frequency of ratio 0.7) ...52
x
Figure 3.31 Experimental setup of a Hybrid system B ...56
Figure 3.32 Tripod and stand used to support damper...58
Figure 3.33 Damper installation in line with the cross-tie ...59
Figure 3.34 Sample displacement time history for Hybrid system A at shaker excitation frequency of 6.7 Hz (rigid type cross-tie located at 1/2L for frequency of ratio 0.7) ...60
Figure 3.35 Frequency-response curve of Hybrid system A ...62
Figure 4.1 Single cable convergence analysis results ...68
Figure 4.2 Cable network convergence graph ...68
Figure 4.3 The first mode shape of a single target cable ...70
Figure 4.4 Kinetic energy time history curve for a sample damped cable ...72
Figure 4.5 The first mode shape of a cable network with rigid cross-tie installed at the mid-span of the target cable ...75
Figure 4.6 Kinetic energy time history curve for a sample Hybrid system A ...76
Figure 5.1 Comparison of first modal frequency of network and Hybrid system B for the effect of external damper (frequency ratio 0.7) ...89
Figure 5.2 Comparison of first modal frequency of network and Hybrid B for the effect of external damper (frequency ratio 0.8) ...89
Figure 5.3 Comparison of first modal damping ratio of network and Hybrid B for the effect of external damper (frequency ratio 0.7) ...90
Figure 5.4 Comparison of first modal damping ratio of network and Hybrid B for the effect of external damper (frequency ratio 0.8) ...91
xi
Figure 5.6 Comparison of first modal frequency of target cable and network for the effect
of cross-tie (frequency ratio 0.8) ...93
Figure 5.7 Damping ratio of damped cable and Hybrid A for frequency ratio 0.7 ...95
xii
List of Tables
Table 3.1 Properties of main cables ...22
Table 3.2 Properties of cross-ties ...32
Table 3.3 Sample damping calculation for the undamped target cable ...39
Table 3.4 Summary of undamped single cable experimental results...40
Table 3.5 Comparison of analytically predicted and experimentally measured first modal frequency (Hz) ...40
Table 3.6 Maximum excitation versus excitation frequency of single damped cable ...45
Table 3.7 Experimental result of the damped single cable ...47
Table 3.8 Testing cases for the cable network ...50
Table 3.9 Sample damping calculation for the networked target cable ...53
Table 3.10 Summary of experimental results of cable network ...54
Table 3.11 Testing cases of hybrid system ...57
Table 3.12 Maximum displacement versus excitation frequency of Hybrid system A ...61
Table 3.13 Summary of experimental results of Hybrid system A ...63
Table 3.14 Summary of experimental results of Hybrid system B ...64
Table 4.1 Properties of the target cable for a sample case ...69
Table 4.2 Modal frequencies of the target cable in a sample simulation case (Hz) ...70
Table 4.3 Properties of the damped cable for a sample case ...72
Table 4.4 Total kinetic energy in each cycle of the sample damped single cable ...73
Table 4.5 Properties of the network for a sample case ...74
Table 4.6 Modal frequencies of the sample cable (Hz) ...74
xiii
Table 4.8 Summary of experimentally and numerically obtained first modal frequency of
an undamped single cable (Hz) ...78
Table 4.9 Summary of experimentally and numerically obtained first modal damping ratio of an undamped single cable (%) ...79
Table 4.10 Summary of experimentally and numerically obtained first modal frequency and damping ratio of a damped single target cable ...79
Table 4.11 Summary of experimentally and numerically obtained first modal frequency of a networked target cable (Hz) ...80
Table 4.12 Summary of experimentally and numerically obtained first modal damping ratio of a networked target cable (%) ...81
Table 4.13 Summary of experimentally and numerically obtained first modal frequency of Hybrid system A (Hz) ...82
Table 4.14 Summary of experimentally and numerically obtained first modal damping ratio of Hybrid system A (%) ...82
Table 4.15 Summary of experimentally and numerically obtained first modal frequency of Hybrid system B (Hz) ...83
Table 4.16 Summary of experimentally and numerically obtained first modal damping ratio of Hybrid system B (%) ...84
Table 5.1 Summary of experimental results of the first modal frequency (Hz) ...86
Table 5.2 Summary of experimental results for the first modal damping ratio (%) ...87
1
Introduction
1.1 Background
Cables are important structural elements in civil engineering constructions. Stay
cables on cable-stayed bridges and transmission lines are some of the typical examples.
Cable-stayed bridges are becoming more popular in recent decades due to their pleasant
aesthetics, comparatively easy constructability and economic use of material. However,
stay cables on this type of bridge are very susceptible to dynamic excitations, because of
their low flexural stiffness and inherent damping. Large amplitude cable vibrations are of
much concern, as it would shorten the life span of cable and thus bridge and in some cases
even lead to significant structural damage. In addition, it may cause safety concern of the
public. Hence, extensive studies have been carried out to identify the source and the
mechanism of excitations as well as to develop countermeasures to suppress cable
vibrations.
1.2 Mechanisms of wind-induced cable vibrations
Studies on wind-induced vibration of cables on cable-stayed bridges have identified
a number of cable vibration mechanisms, which include rain-wind-induced vibration,
vortex-induced vibration, buffeting, wake galloping, high-speed vortex excitation, and dry
inclined cable galloping.
Cable excitation due to the combined effects of rain and wind occurs during the
period of moderate wind and rain. Studies revealed that about 95% of the reported cable
vibration field incidents belong to the rain-wind induced oscillations (Wagner and Fuzier,
2
would form at the upper and lower surfaces of the cable. Gu and Du (2005) pointed out
that the motion of upper rivulet around the cable is the prerequisite for rain-wind-induced
cable vibration, whereas the lower rivulet was found to be static. The schematic view of
position of upper and lower rivulet is shown in Figure 1.1. Xie et al (2012) carried out a
numerical study and found that the position of the upper rivulet would cause change of the
forces acting on the cable and the surrounding flow pattern. When the rivulet flows along
the surface of the cable, it oscillates around the circumferential direction causing inertial
forces, and pressure gradient. These combined effects lead to the excitation of the cable.
Vortex-shedding phenomenon is well defined by the term Kármán vortex shedding.
When wind past a cable, vortices are formed on either side of the body and shed in the
wake. Alternate vortex shedding behind the cable generates an oscillating force
perpendicular to the wind flow direction. When shedding frequency of vortices comes close
to the natural frequency of the cable, cable vibration amplitude would reach its maximum
3
to be comparatively small. According to Davenport (1994), the amplitude of this type of
vibration rarely reached the size of the radius of a cable.
Cable buffeting occurs due to velocity fluctuation in wind. Its impact on bridges is
found to be relatively small. However, the repetitiveness of cable oscillation may induce
fatigue damage at the cable anchorage.
According to wind tunnel tests on inclined cables and field observations, it was
found that high-speed vortex excitation could occur due to combined effect of axial vortex
shedding and Kármán vortex shedding (Matsumoto et al, 2001; Cheng et al, 2008a). It was
noted that this type of excitation takes place at higher reduced wind speed range compared
to the conventional Kármán vortex excitation. Thus, it is termed as high-speed vortex
excitation. Cheng et al (2008a) pointed out that this type of cable vibration could be easily
controlled by increasing cable damping.
The excitation phenomenon of dry inclined cable galloping was observed during
several wind tunnel tests including the tests by Saito et al (1994), Cheng et al (2003),
Miyata et al (1994), and Jakobsen et al (2012). However, there is no confirmed report that
this type of excitation has occurred in field. Studies showed that dry inclined cable
galloping occurred under a combination of specific wind speed in the critical Reynolds
number range and orientation of the cable and could possibly be explained by Den Hartog
criterion (Cheng et al, 2008b).
Cable excitation due to wake galloping occurs at high wind speeds on cables located
in the wake of other structural members. For example, when two cables are placed in
4
the vortex shedding frequency of the upstream cable could be in resonance with the natural
frequency of the downstream one and excite large amplitude oscillation on it. The response
can be minimized by placing the cables with appropriate spacing (Kumarasena et al, 2007).
It is worth mentioning that most of the reported problems on stay cables are due to
rain-wind-induced cable vibration. Hence, this type of cable motion can be treated as most
critical.
1.3 Countermeasures to control cable vibration
It is prime important to suppress unfavorable cable vibrations, since it would lead
to fatigue failure and damage at the cable anchorages. A number of cable vibration
controlling methods have been adopted in the field. They can be generally classified as
aerodynamic type and mechanical type.
Aerodynamic type of controlling method is applied by modifying cable surface
condition to prevent the formation of water rivulets along the cable surface. It is very
effective in suppressing rain-wind-induced cable vibrations. Figure 1.2 shows some
examples of surface modifications. The stay cables on the Tatara bridge in Japan
(Verlogeux, 1998), the Vasco da Gam a bridge in Portugal (Bosdogianni & Olivari, 1996),
and the Higashi-Kobe Bridge in Japan (Saito et al, 1994) are some of the practical examples
5
Mechanical type of countermeasure is accomplished either by installing external
dampers close to cable-deck anchorage or interconnecting main cables with cross-ties to
form a cable network. In the former method, cable vibration is suppressed by increasing
energy dissipation through external dampers. A number of different types of dampers have
been used on site, which include friction damper (Myrvoll et al, 2002), high damping
rubber damper (Nakamura et al., 1998), tuned-mass damper (Cai et al, 2006), magneto
rheological (MR) damper (Christenson and Spencer, 2001), and viscous damper (Main and
Jones, 2001). In a cable network solution, single cables are transformed into a cable
network by interconnecting each neighboring cables using cross-ties and thus the in-plane
stiffness of the system increases (Caracoglia and Jones, 2005a). Longer cables on a
cable-stayed bridge are more susceptible to vibration because of their low natural frequency.
With the introduction of cross-ties, the risk of cable oscillation is considerably reduced
because of the increased frequency. Also, the energy in a vulnerable cable can be
distributed to the other cables (Caracogolia, and Zuo, 2009). Damping of the system is also
slightly improved with the introduction of flexible cross-ties (Yamaguchi and
6
Bridge in Denmark (Virlogeux M, 1998), Yobuko Bridge in Japan (Yamaguachi and
Nagahawatta, 1995), and the Fred Hartman Bridge (Caracogolia and Jones, 2005) are some
of the practical examples. However, there are some drawbacks in the cross-tie solution.
This system is basically incapable of directly dissipating energy. The inability to control
out of-plane motion and the introduction of a large number of local modes that are hard to
control are the other limitations of this type of solution.
A hybrid system, where dampers are added to a cable network system, is proposed
to be more effective in vibration mitigation. This technique has been implemented on the
Normandie Bridge in France and the Leonard Bridge in USA (Caracoglia, Zuo, 2009). As
a novel solution, the hybrid system could enhance the effectiveness of cable vibration
control through energy dissipation as well as redistribution.
1.4 Motivation
The effectiveness of cross-tie solution in suppressing stay cable vibration has been
proved by a number of research and field experience. However, the mechanics of cable
network are yet fully understood. Even though the in-plane stiffness enhancement of a
networked cable has been extensively studied, the influence on its damping property was
properly scarce. In particular, experimental study on the cable network behavior and the
impact of cross-tie position and stiffness on the network dynamic response is limited.
The hybrid system, of which the usage of external damper is combined with
cross-ties, is a novel cable vibration control strategy proposed to overcome the limitations of
7
so far to study the behavior of a hybrid system. The potential advantages of a hybrid system
over the damper-only and the cross-tie-only solutions need to be further investigated.
1.5Objectives
The objectives of the current study are proposed as follows:
1. Find natural frequencies and structural damping of an inclined single cable with
experimental approach by conducting free vibration tests.
2. Design and setup the cable network. Conduct free vibration tests to identify natural
frequency and modal damping of a cable network comprised of two parallel
inclined cables connected by a transverse cross-tie.
3. Study the impact of the following three system parameters on the network modal
behavior:
a. Cross-tie position
b. Cross-tie stiffness
c. Frequency ratio between the two cables
4. Conduct forced vibration tests to determine modal frequency and modal damping
of a single cable attached with a damper.
5. Conduct experimental study to identify natural frequency and damping of a hybrid
system with the following two configurations:
a. External damper installed in line with the cross-tie
b. External damper installed near the support of the target cable, not in
8
6. Develop finite element models of an undamped single cable, a cable-damper
system, a cable network, and a hybrid system using ABAQUS software and validate
the experimental results.
7. Compare cable vibration controlling effects by a hybrid system with the
9
Literature Review
Experimental studies on mitigation of cable vibrations using cross-ties and external
dampers will be reviewed in this chapter. In addition, the findings of analytical and
numerical studies on the cross-tie and the hybrid solutions are discussed.
2.1 Cross-tie solution
Yamaguachi and Nagahawatta (1995) conducted an experimental study using a
simple experimental setup, as shown in Figure 2.1, in order to evaluate the influence of
cross-tie solution on the damping property of a cable network.
The first modal damping ratio of the cable network was studied by varying stiffness and
pre-tension of the cross-ties in a series of free vibration tests. The network first modal
damping was calculated using the logarithmic decrement method based on the response at
the mid-span of the target cable (top cable). The average of the logarithmic decrement was
taken as the representative modal damping. In order to compare the modal response of a
cable network with that of a single cable, damping in the isolated top cable was also
monitored. It was concluded that the modal damping of the cable network was larger than
10
of cross-tie flexibility. Also, it was found that the first modal frequency of the network was
higher than that of the isolated top cable. It improved further if prestress in the cross-tie
was increased. In addition, theoretical analysis for damping in a single cable and a cable
network was carried out using the energy-based approach. The modal strain and potential
energy in the two main cables were evaluated. Based on the analytical approach, it was
found that energy dissipation due to the stiff type cross-tie was almost negligible, whereas
the soft type cross-tie was capable of dissipating certain amount of energy.
In the study by Yamaguachi et al (2001), linear interaction between individual
members on the dynamic behavior of a cable network was investigated experimentally and
analytically. Experimental tests were carried out using both free and forced vibration tests.
Two sagged main cables were connected with a cross-tie, whose sag was set to be the same
as that of the main cables. So, the natural frequencies of the cross-tie and the main cables
were close to each other. It was found that the network damping increased when the motion
of the cross-tie became larger. Analytical studies on network damping were carried out
based on the energy method. Results showed that the system modal damping increased
with the increase of energy dissipation in the cross-tie, which confirmed the earlier findings
by Yamaguachi and Nagahawatta (1995).
Subsequently, Yamaguachi and Alaudin (2002) carried out experimental and
analytical studies to identify contribution of cross-tie to the dynamic response of a cable
network by considering its nonlinear interaction with main cables. Harmonic type of
excitation was used in the forced vibration test. It was found that while the response of a
single cable was nearly simple harmonic, that of the same cable within a network was multi
11
an early jump in the frequency-response curve of the cable network, and the amplitude
response of the cable network was lower than that of a single cable.
Sun et al (2007) conducted an experimental study on a cable network consisting of
three inclined cable connected with one transverse cross-tie. The modal frequency and
damping of the cable network were investigated by changing the tensioning method,
tension force and stiffness of cross-tie. Both stiff and a flexible type of cross-tie were used.
The stiffness ratio of the flexible and the stiff type cross-ties was maintained at 0.7%.
Results revealed that the stiff type of cross-tie was more helpful in increasing the network
natural frequency while the network damping increased more with the application of
flexible cross-ties. This set of testing agrees with the earlier findings by Yamaguachi and
Nagahawatta (1995). The experimental results were validated analytically using an
energy-based method. Influence of tensioning method, tension force, and stiffness of cross-tie on
the modal frequency and damping of cable network were analyzed. It was found that the
results obtained from experimental and analytical study have the same trend. The study
concluded that the improvement of damping of a cable network is rather low in the
tie-only solution and it could be improved by installing a damper at the connection of
cross-tie and main cable.
Besides experimental studies, a number of analytical and numerical studies have
been carried out to examine dynamic behavior of cable network. Caracoglia and Jones
(2005a) developed an analytical model to investigate the in-plane vibration behavior of six
simplified cable network cases: (a) Twin cables connected by a rigid cross-tie at the
mid-span of the cables; (b) Twin cables connected by a rigid tie at an arbitrary location; (c) Two
12
connected by a flexible cross-tie at the mid-span of the cables; (e) Two symmetric but
unequal length cables connected by a flexible tie at mid-span; and (f) Two symmetric but
unequal length cables connected by a flexible tie at mid-span and the cross-tie is extended
to and fixed at the ground. In order to simplify the analysis, it was assumed that the main
cables were taut flat cables as a result of their high pretension. Also, the cross-ties were
modelled as linear spring connectors. It was pointed out that the analysis procedure of even
a simplified cable network was very complex. It was suggested to use numerical simulation
for a more general cable network
The same group of researchers (Caracogolia and Jones, 2005b) extended the study
from a simple to a generalized complex cable network comprising ‘n’ number of stay
cables and variable number of cross-ties. The cable network configuration of the center
span of the Fred Hartman Bridge in USA was numerically modelled by assuming the plane
of the network remains vertical. The three-dimensional network was thus simplified to a
two-dimensional frame and the cross-ties were treated as inclined linear spring elements.
The sagging effects of cables were neglected. In addition, analyses were carried out by
modifying the original network design, such as changing the location, the number, and the
stiffness of cross-ties or extending cross-ties to the ground. Both local and global modes
were observed. Data collected from a field-monitoring program on this bridge was used to
validate the simulation results of the developed model. The study highlighted that the
existence of higher frequency local modes in a cable network, which are difficult to control,
affects the overall performance of the bridge stays.
Ahmad and Cheng (2013a) developed an analytical model to study the dynamic
13
interconnected transversely by a single line of rigid cross-tie in a free vibration condition.
In the analytical model, the horizontal cables were idealized as taut cables, and both cable
ends were assumed to be fixed. Also, it was assumed that the additional tension due to
dynamic motion could be neglected. The longitudinal motion of main cables and the
transverse motion of cross-ties were not considered in the formulation. The study
confirmed that the existence of local modes in addition to the global modes. It was
highlighted that the in-plane stiffness of a target cable would increases only when it was
connected with a neighboring cable that possessing either higher frequency and/or higher
mass-tension ratio.
Ahmad and Cheng (2014) identified key system parameters of a cable network
based on a network configuration of ‘n’ cables connected with a single line of transverse
rigid cross-ties. They include: a) length ratio (the ratio between length of the target cable
and that of a neighboring cable in the network); b) segment ratio (represents the position
of cross-tie); c) the frequency ratio (the ratio between fundamental frequency of the target
cable and that of a neighboring cable in the network); (d) the mass-tension ratio (the ratio
between the mass/tension value of the target cable that of neighboring cable); (e) total
number of cables in cable network. A parametric study was carried out to investigate the
influence of various key system parameters on the in-plane dynamic behavior of a cable
network. It was found that the frequency of the target cable would increase if it were
connected with a shorter or stiffer cable, and/or a cable with higher mass-tension ratio.
However, there might not be any benefit to enhance the stiffness if the neighboring and the
target cable have the same frequency. Further, it was pointed out that when a single rigid
14
influence the fundamental frequency. However, the fundamental frequency would become
sensitive to the length ratio with the change in cross-tie position. The product of length and
frequency ratio, and mass-tension ratio should be considered in order to select most
effective cross-tie position which would improve the system in-plane stiffness.
To investigate the influence of cross-tie stiffness on the behavior of a cable
network, Ahmad and Cheng (2013b) proposed an analytical model. The structural damping
property of cables and cross-tie as well as their nonlinear interactions were not included in
the model. A parametric study was conducted to investigate the influence of the key
parameters on the in-plane dynamic behavior of the cable network with a flexible
cross-tie. The increase of network frequency with the increase of the cross-tie stiffness was
re-confirmed by this study. Further, the study highlighted, when soft cross-tie was introduced,
decrease of modal frequency was substantial in an out-of-phase global mode compared
with an in-phase global mode. The effectiveness of cross-tie solution would be reduced if
cross-tie was moved towards the support of the main cables.
Ahmad et al (2014) further extended the analytical model developed by Ahmad and
Cheng (2013a) and included the damping properties of main cables in the formulation. To
the author’s knowledge, this is the first piece of analytical work, which considers the
damping ratio of main cables in studying the dynamic behavior of a cable network. It was
assumed that the main cables are taut damped cables with linear viscous type damping, and
the cross-tie is rigid and undamped. The study was focused to analyzing the in-plane
dynamic behavior of cable networks pertaining to modal frequency, mode shapes, and
modal damping. It was found that for a twin cable system (the properties of the target cable
15
the network with an undamped rigid cross-tie remained the same as that of an isolated
single target cable. The damping property of the target cable could be enhanced only if it
was connected with a neighboring cable of higher damping. Also, it was pointed out that
the system damping would increase if the cross-tie was positioned closer to the cable
mid-span. It was found in previous studies that the location of cross-tie affect the network
frequency. The optimum location of the rigid cross-tie, which would offer the most
favorable solution to network frequency and modal damping, was further examined in this
study.
2.2 Damper solution
Optimum design of a cable-damper system is required for an effective cable
vibration mitigation system. Kovacs (1982) identified the existence of an optimum
damping associated with its installation location in a cable-damper system using a
semi-empirical method. This result was subsequently confirmed by Yoneada and Maeda (1989)
by carrying out numerical analysis. Pacheco et al (1993) developed a universal damping
estimation curve for a cable-damper system, which could be used to design an optimum
size and location of a linear viscous damper to suppress cable vibration and to gain
maximum amount of additional damping.
The behavior of an inclined single cable when connected with a nonlinear hysteretic
damper was experimentally studied by Chen et al (2000). The damping of the system was
monitored by changing the amplitude of the harmonic excitation and varying the damper
position from 3.7 to 7.1 percent of the cable length from cable support. It was found that
the change in the damper location as above would not substantially influence the damping
16
ratio could increase if the amplitude of excitation increased. The nonlinear hysteretic
damper exhibited a high damping effect for a large amplitude vibration. The study
recommended to use this type of damper in mitigating cable vibration.
Sun et al (2005) conducted experimental studies to evaluate the damping in a cable
when it was connected with different types of dampers including oil damper, viscous
damper, MR damper, and friction damper. It was noted that the inherent damping of cable
alone was very low and it would decrease further for higher modes. In addition, it was
found that the first three modal damping ratio of the cable were increased by more than 3%
with the introduction of mechanical dampers.
2.3 Hybrid system solution
Vibration mitigation of cable-stayed bridges using a hybrid system, which consists
of cross-ties and external dampers, was proposed in recent years in order to overcome the
limitations of the damper-only and the cross-tie only solutions. When only cross-ties are
employed, the cable that has low frequency gains advantage if it is connected with a
neighboring cable of higher frequency. In a cable-stayed bridge, the longer cables would
be benefitted more once they are connected with shorter cables. Thus, the risk of excessive
oscillation is remarkably reduced. Also, the installation of cross-tie increases the in-plane
stiffness of the connected cables. However, the cable network system is incapable of
directly dissipating energy. The presence of large number of high frequency local modes,
which are usually difficult to control, is also a main concern. The energy dissipation of
stays can be improved by installing external dampers. However, the constrain on the
17
Limitations of both methods are expected to be resolved by combining the two together to
form a hybrid system.
Caracoglia and Jones (2007) extended their numerical study of a cable network
system (Caracoglia and Jones, 2005b) to a hybrid system, where the cross-tie was
connected to the deck through a damper. The numerical cable network model of the Fred
Hartman Bridge was further developed by introducing dampers in line with the cross-ties,
so a cross-tie line was connected to the deck through a damper. The sketch of the hybrid
system using the Fred Hartman Bridge as an example is shown in Figure 2.2. It was pointed
out that the hybrid system was most effective in suppressing global modes, where the
dampers could provide higher amount of energy dissipation. In addition, the study revealed
that a hybrid system with multiple dampers would be more preferable compared with that
of a single damper in a cable network.
18
Subsequently, Caracoglia and Zuo (2009) further developed the previous study
(Caracoglia and Jones, 2007) of a hybrid system to a more generalized model consisting of
a number of cross-ties and multiple dampers that were installed on the cables either in line
with the cross-ties or not, as shown in Figure 2.3. Full-scale monitoring data of the pure
cable network and the hybrid system on the Fred Hartman Bridge was analyzed in the
study. Results showed that the cross-tie-only solution was capable of mitigating in-plane
cable vibrations, in particular the large amplitude lower modes. But it could not suppress
the out-of-plane motion. In addition, the numerical simulation results suggested that the
hybrid system could not effectively mitigate the vibration of local modes at high
frequencies. Further, the study pointed out that it was not required to install dampers at
every cable in a cable network system. Instead, reduced number of optimally designed
dampers would serve the purpose.
Even though a limited number of analytical and numerical studies were conducted
19
control, no associated experimental study is available in the literature. Nevertheless, it is
essential to verify the results obtained from numerical/analytical works by experimental
studies to have a better understanding on the behavior of a hybrid system. Hence, the
current study will investigate experimentally the effectiveness of a hybrid system on the
cable vibration mitigation by varying the stiffness and location of cross-tie and position of
a linear viscous damper. In order to analyze the effectiveness of a hybrid system over a
pure cable network and a cable-damper system, it is also required to conduct experimental
tests on these two systems to identify their respective dynamic behavior. So, tests were
carried out for a pure cable network, a cable-damper system, and a hybrid system. Then,
the results obtained from experimental study will be compared with those yielded from
20
Experimental study
In order to study the dynamic behavior of cable networks, and evaluate their
effectiveness in control cable and hybrid system vibration, the in-plane modal response of
an isolated undamped single cable, a cable-damper system, a cable network, and two types
of hybrid systems were investigated experimentally in the current study. The experimental
setup, the instrumentations and equipment used for the study are explained in this chapter.
The testing and analyzing methods are also described. A set of preliminary results obtained
from the experimental study are presented and discussed. All the experimental tests were
carried out in the Structural Laboratory located at the Centre for Engineering Innovation,
University of Windsor, Windsor, Ontario, Canada.
3.1 Experimental setup
The experimental setup used by Huang (2011) and Fournier (2012) has been
modified to satisfy the needs of the current study. Study for the first modal frequency and
modal damping of a single undamped cable, a cable-damper system, a cable network, a
hybrid system with the damper connected at 6.5% of the length of the cable, and a hybrid
system with damper connected in-line with the cross-tie are carried out by developing four
separate experimental setups. Galvanized steel wire rope was used to simulate bridge stay
cable. In isolated undamped single cable study, a steel wire was installed between two
vertical steel columns to a slope of 13º with the horizontal. In the case of a cable-damper
system, a linear viscous damper was attached to the cable close to its lower support. For
the study of the cable network, another steel wire is installed in parallel with the first one,
and the damper was removed. Then the two inclined cables were interconnected with a
21
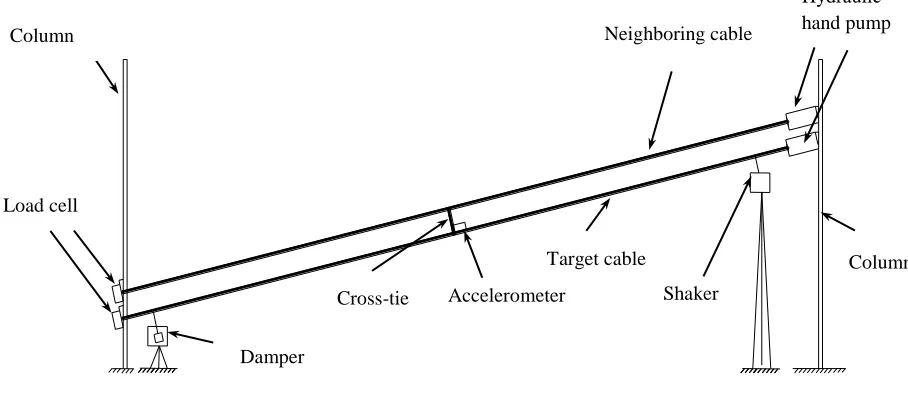
damper to the target cable in the cable network. A typical experimental setup of a hybrid
system, where the usage of instrumentations is the most comprehensive, is illustrated in
Figure 3.1. Detailed descriptions of each equipment/instrumentation are given below.
Cable
The length of each cable is 8.5 m. The unit mass of the cable is 0.0952 kg/m. Its
nominal diameter is 4.76mm. Lower pretension in cable will cause large sag, whereas
higher pretension may lead to an elliptical motion during vibration. Based on the
recommendation by Huang (2011), the pretension of the cables were maintained between
2500 N and 4000 N in order to get desired dynamic response.
Additional mass blocks were installed uniformly along the cable, as shown in Figure 3.2,
to result in cable frequency close to that of a real bridge stay cable. Adding seventeen of
50 g mass blocks with a uniform spacing of 470 mm to the top cable, the unit mass of top
cable was adjusted to 0.195 kg/m. Unit mass of the bottom cable was adjusted to 0.213
kg/m by adding ten 100 g mass blocks uniformly along the cable with the spacing of
Cross-tie
Target cable Column Load cell
Neighboring cable
Accelerometer Column
Hydraulic hand pump
Damper
Shaker
22
770 mm. The bottom cable was assumed to be the target cable. The top cable, which had
relatively higher frequency, was referred as the neighboring cable. The properties of the
two main cables are summarized in Table 3.1.
Table 3.1 Properties of main cables
Cable Span (m)
Unit mass
(kg/m)
Tension (N)
Frequency
ratio 0.7
Frequency
ratio 0.8
Target cable 8.5 0.213 2150 2500
Neighboring cable 8.5 0.195 4000 3600
Hydraulic pump
One end of each cable was attached to a hydraulic hand pump that was used for
applying pretension to the cable. The jack in the hydraulic pump was aligned with the cable.
Two hydraulic pumps of model number PH-84 were installed on the column and connected
with the cable end as shown in Figure 3.3. Each pump has a maximum capacity of 10,000
23
Figure 3.2 Additional mass blocks installed on cables
Figure 3.3 Setup of Hydraulic pumps
Additional mass blocks
Neighboring cable
Target cable
Jack
24
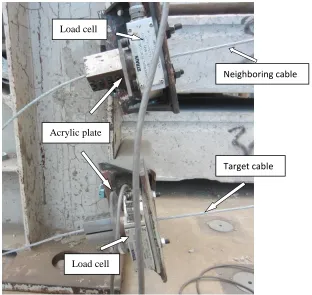
Universal flat load cell
As shown in Figure 3.4, the other ends of the cables were connected with universal
flat load cells to measure the applied tension in the cables. Acrylic plates were placed in
between all metallic parts and the load cell to minimize electronic interference. The model
number of the load cells is FL25U-2SG. Their maximum capacity is 25,000 lb. They were
calibrated using MTS tensile testing machine. A loading increment of 0.5 kN was used in
the calibration. The corresponding change in the load cell reading was recorded in terms
of voltage change by the data acquisition system. The calibration data for load cell 1 and
load cell 2 are given in Figures 3.5 and 3.6, respectively. Calibration constants of 5.481
kN/mV and 5.585 kN/mV can be derived for the two load cells.
Figure 3.4 Setup of Load cells
Neighboring cable
Target cable Acrylic plate
Load cell
25
Accelerometer
Accelerometer was used to record cable response during the tests. Since this study
focuses on determining the first modal frequency and modal damping of a studied cable,
the accelerometer was placed on the top surface of the cable at the mid-span to ensure that
it measures only the transverse in-plane movement of the cable. In the initial trial tests of
y = 5.481x
0 1 2 3 4 5 6 7 8
0 0.2 0.4 0.6 0.8 1 1.2 1.4
load (
kN)
Voltage (mV)
y = 5.585x
0 1 2 3 4 5 6 7 8
0 0.2 0.4 0.6 0.8 1 1.2 1.4
load (
kN)
Voltage (mV)
Figure 3.5 Calibration curve for load cell1
26
the cable network system, two identical accelerometers were installed respectively on the
top surface of the target cable and the neighboring cable at their mid-span to compare the
recorded response. This is to ensure the cross-tie was properly connected with the main
cables. At the initial test on the cable network, two accelerometers of model number
352A24 were used. Sensitivity of individual accelerometer is 10.14 mV/m/s2 and 9.95
mV/m/s2 respectively. Since the objective of the current study is to evaluate the
effectiveness of a cross-tie solution and a hybrid system in controlling vibration of the
target cable, in the subsequent tests, only transverse in-plane acceleration of the target cable
at the mid-span were recorded. The testing frequency range of the accelerometers is 1-8000
Hz, while that required in the current experimental study is 5 - 10 Hz.
Data acquisition system
The AstraDAQ Xe data acquisition system shown in Figure 3.8 was used to collect
all the experimental data. The PC-based data acquisition system is supplied by Astro-Med.
Inc. It was used in conjunction with the accompanying AstrLinkXe software. This unit has
eight input channels. Channels 7 and 8 were connected with the two load cells, while
Accelerometer
27
Channels 2 and 3 were connected with the two accelerometers. The input signals could be
monitored and recorded in the Realtime mode whereas the captured signals could be
reviewed and analyzed in the Review mode. Each channel of the unit is capable of
recording signals with sampling frequency up to 200 kHz. In the current study, a sampling
frequency of 1000 Hz was used.
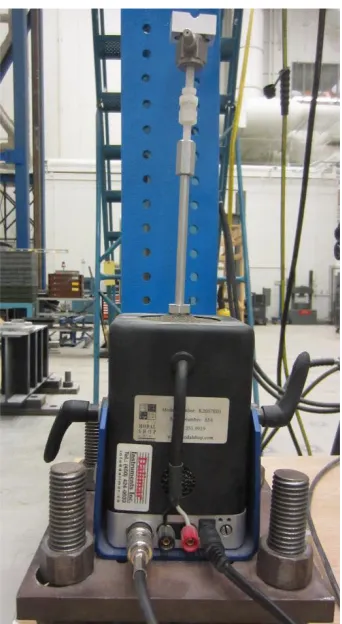
Electronic dynamic smart shaker
A shaker that was used to excite the cable in forced vibration tests is shown in
Figure 3.9. The model number of the shaker is K2007E01. The unit can provide a peak sine
force up to 31 N with 1.27 cm stroke, and its testing frequency range is 1-9000 Hz. The
28
to get the desired excitation of the cable, the shaker should be placed in-plane of the cable
motion.
Figure 3.9 Electronic dynamic smart shaker
Signal Generator
The signal generator of the model number 33120A was used to generate the signals,
which then was transferred to the shaker. The unit is shown in Figure 3.10. Multiple
dynamic functions, such as sine, square, triangle, and ramp can be generated by this unit.
Sinusoidal output function with the frequency range 4.5Hz to 8.5Hz was used in the current
study. This unit is capable of producing the output functions in frequency range of 1- 15
29
Passive linear viscous damper
A passive linear viscous damper designed by Fournier (2012) was modified and
used in the current study. The damper was used in the case of a cable-damper system and
a hybrid system. As can be seen from Figure 3.11, the damper consists of a plastic container
with an internal diameter of 100 mm, a rectangular prism acrylic block of the size 48mm x
48mm x 39mm, and a plastic stick. Synfluid PAO 100 viscous oil of viscosity 1250 cSt at
40o, which was purchased from Commonwealth Oil, was used as viscous fluid for this
damper.
30
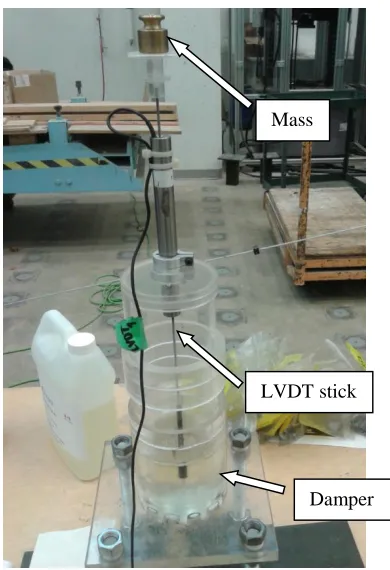
The damping coefficient of the damper was found from damper calibration. The setup for
damper calibration is given in Figure 3.12. The piston of the damper was connected with a
Linear Variable Differential Transformer (LVDT). The movement of the piston through
the viscous oil under a constant applied load was measured by LVDT in volts/second, and
collected by the data acquisition system. By multiplying the recorded values with the
conversion factor of the LVDT (2.5mm/volt), the velocity of the piston movement could
be found. Repeat the test by increasing the applied load. This was achieved by increasing
the weight placed at the top of the LVDT. Plot the variation of the piston velocity with
respect to the applied load, the damping coefficient of the damper could be derived. The
Acrylic block Plastic container
Acrylic block Damper stick
31
data obtained in damper calibration test is given in Figure 3.13, which yields a co-efficient
of 19.1N.s/m.
y = 19.1x R² = 0.9984
0.0 0.5 1.0 1.5 2.0 2.5
0.00 0.02 0.04 0.06 0.08 0.10 0.12
F
orc
e
(N
)
Velocity (m/s)
Mass
LVDT stick
Damper
Figure.3.12 Experimental setup of damper calibration
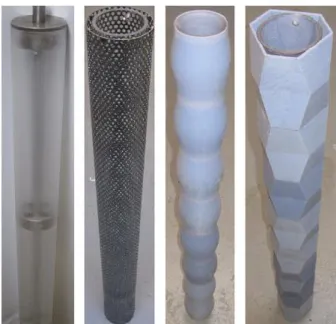
32
Cross-tie
Both rigid and flexible type of cross-ties were used in the current study to
understand the effect of cross-tie stiffness on the cable network behavior. A galvanized
wire was used for rigid tie, whereas a rubber rope was used for flexible type
cross-tie. Three cross-tie locations, i.e. 1/2, 1/3, and 1/4 span of the target cable were tested.
Table 3.2 Properties of cross-ties
Cross-tie type Length (m) Cross-sectional area (m2)
Axial stiffness
(N/m) Rigid
(galvanized)
wire)
0.3 3.55 x 10⁻⁵ 1.21 x 10⁶
Flexible
( rubber)
0.3 1.95 x 10⁻⁵ 2.05 x 10²
Figure 3.14 Type of cross-ties
33
3.2 Free vibration test of a single cable
In the experimental study, the frequency and damping of a target cable, before and
after it was connected with a neighboring cable and/or a damper, were compared to study
the effectiveness of various vibration controlling schemes. Hence, it is required to find
natural frequency and the inherent damping ratio of a single cable. This was achieved by
performing free vibration test of a single isolated target cable in the current study. The
sketch of the experimental setup is illustrated in Figure 3.15.
3.2.1 Testing procedure
The procedure that was adopted to perform the free vibration test for a target isolated
single cable is outlined below.
1. The cable was pretensioned using a hand hydraulic pump to a predetermined value.
The first modal frequency of the cable was predicted using the formula 𝑓1=
1 (2𝐿)√𝑇 𝑚⁄ ⁄ (Irvine & Caughy, 1974), where L is the cable length (m), T is the cable
pretension (N), and m is the cable unit mass (kg/m). Natural frequencies of the target
and the neighboring cables were varied by adjusting cable pretensions.
2. The accelerometer was mounted on the top surface of the cable at the mid-span.
Accelerometer
Column
Accelerometer
Column
Cable
Hydraulic pump
Accelerometer
Load cell
34
3. The AstroLINK Xe software was set to a sampling frequency of 1000 Hz and a
sampling time of 5 seconds. Channel 3 and Channel 8 of the data acquisition system
were connected to an accelerometer and a load cell, respectively.
4. A mass block of 1.25 kg was attached to the cable at mid-span using a fishing string
as shown in Figure 3.16. The cable was excited by burning the fishing string and
releasing the mass block.
5. The response (acceleration of the cable in the in-plane transverse direction) at cable
mid-span was monitored and captured by the data acquisition system in the
Realtime mode for further analysis.
Figure 3.16 Installation of mass block to excite free vibration
Mass block String
35
3.2.2 Pre-processing of experimental data
1. The saved data was retrieved in the Review mode from data acquisition system
and exported to Microsoft Excel.
2. The cable acceleration time-history raw data was then analyzed using Matlab
software. A code developed by Huang (2011) was utilized for the analysis. The
‘pwelch’ function in the Matlab, which estimates Power Spectral Density (PSD)
using the Welch’s method, was applied to the cable acceleration data to determine
the natural frequencies of the cable.
3. Once the first modal frequency of the cable was found, the raw signal was filtered
to isolate the first modal response. The Butterworth filter, which was designed to
retain the signals within a certain frequency band of interest, was adopted for this
purpose. In the current study, this range is set to be between f1 + 0.5 Hz and f1 -
0.5 Hz, where ‘f1’ is the cable fundamental frequency.
4. In order to transfer the filtered acceleration data to displacement data, the time
domain data was transferred to the frequency domain by applying Fourier
Transform. Those data was divided by f12. Then, by applying inverse Fourier
Transform, the displacement data was obtained.
5. Damping ratio of the cable was calculated by using logarithmic decrement method
(Chopra, 2007). The natural logarithm of the ratio between two successive peaks
of a free decay motion ui and ui+1 is called the logarithmic decrement. This is
usually denoted by 𝛿. The relationship between 𝛿 and damping ratio (𝜉) is given
by;
δ = ln 𝑢𝑖
𝑢𝑖+1= 2𝜋𝜉 √1−𝜉2
36
For a system with slow decay motion, it is preferable to relate two amplitudes of several
cycles apart instead of two successive amplitudes (Chopra, 2007). Since 𝜉 is a small value,
the equation can approximated as;
δ =1
𝑛ln 𝑢1
𝑢𝑛+1= 2𝜋𝜉
where n is the number of vibration cycles, 𝜉 is the damping ratio, u1 and un+1 are the
amplitude of the1st and the (n+1)th cycle, respectively.
3.2.3 Results
The isolated undamped target and neighboring cables were tested for two different
tension levels as mentioned in Table 3.1.
A sample set of testing results of an isolated undamped target cable is presented
below. Properties of the target cable are given in Table 3.1. The target cable was
pre-tensioned to 2.15 kN in the test. After exciting the cable, the in-plane transverse
acceleration of the cable was measured. Figure 3.17 shows a segment of the recorded cable
acceleration time history. Power spectrum analysis was performed for the acceleration
data to obtain the natural frequencies of the cable. The power spectrum density graph
obtained using the Matlab function ‘pwelch’ is shown in Figure 3.18.
37
Figure 3.17 Sample acceleration raw data of a single undamped target cable (Tension 2150 N)
Figure 3.18 Sample power spectral density curve of acceleration time history data of single undamped target cable (Tension 2150 N)
1.5 2 2.5 3 3.5 4 4.5 5
-25 -20 -15 -10 -5 0 5 10 15 20 25 Time(Second) A c c e le ra ti o n ( c m /s 2)
0 5 10 15 20 25
-90 -80 -70 -60 -50 -40 -30 -20 Frequency (Hz) P o w e r/ fr e q u e n c y ( d B /H z )
Welch Power Spectral Density Estimate
First mode 5.70 Hz
38
Since the accelerometer was installed at the centre span of the cable, the obtained signal
mainly contains the response of the 1st and the 3rd modes, the frequency of which are 5.7
Hz and 16.9 Hz, respectively. The raw data was then filtered using the Butterworth filter
to retain the signal associated with the first mode. The frequency range of the filter was set
to between 5.2 Hz and 6.2 Hz. Then, the filtered acceleration signals were converted to
displacement data. A sample curve of filtered displacement time history is given in Figure
3.19.
Then, the first modal damping ratio of the cable was calculated using the logarithmic
decrement method. This is an amplitude dependent method. The logarithmic decrement is
not a constant throughout. Hence, the first modal damping ratio of the target cable was
calculated by averaging the logarithmic decrement of consecutive peaks (Yamaguchi, Figure 3.19 Sample curve of filtered cable displacement time history associated
39
2005). The calculation is given in Table 3.3. The computed damping ratio of the cable was
thus 0.3%.
Table 3.3 Sample damping calculation for the undamped target cable
Cycle Maximum
amplitude (cm)
Damping ratio
(%)
1 0.8391 0.4%
2 0.8201 0.2%
3
0.8077 0.2%
4 0.7952 0.1%
5 0.7881 0.3%
6
0.7729 0.1%
7
0.7668 0.4%
8 0.7491 0.2%
9 0.7396 0.3%
10
0.7245 0.3%
11
0.7097 0.3%
12 0.6962 0.4%
13 0.6794 0.3%
14
0.6684 0.4%
15
0.6505 0.3%
16 0.6384 0.4%
17 0.6236 0.3%
18
0.6107 0.4%
19 0.5971
40
The results of undamped single cables are summarized in Table 3.4.
Table 3.4 Summary of undamped single cable experimental results
Frequency ratio
Frequency (Hz) Damping ratio (%)
Target cable
Neighboring
cable
Target cable
Neighboring
cable
0.7 5.70 8.30 0.3 0.1
0.8 6.40 7.80 0.3 0.1
Table 3.5 Comparison of analytically predicted and experimentally measured first modal frequency (Hz)
Frequency ratio
Target cable Neighboring cable
Analytical Experimental Analytical Experimental
0.7 5.91 5.70 8.42 8.30
0.8 6.37 6.40 8.00 7.80
As it can be seen from the Table 3.5, the experimental and analytical results are matching
closely. The analytical results were predicted from the formula 𝑓1= 1 (2𝐿)√𝑇 𝑚⁄ ⁄ (Irvine
& Caughy, 1974), where L is the cable length (m), T is the cable pretension (N), and m is the
41
3.3 Forced vibration test of a damped single cable
Since vibration of the damped cable decays fast, the damping ratio obtained from a
free vibration test may not be accurate enough. Hence, forced vibration tests were
performed to identify the first modal frequency and damping ratio of the damped cable.
Figure 3.20 shows the damped cable testing setup. The damper was installed at 6.5% length
of the target cable from its lower end, while the shaker was attached at 5% of cable length
from the upper end. When testing the damped cable, the pretension in the target cable was
adjusted to 2.15 kN and 2.5 kN in two separate runs. These are consistent with the target
cable frequency in an earlier isolated single cable setup when the frequency ratios between
the two main cables were 0.7 and 0.8, respectively.
Load cell Column
Column Accelerometer
Damper
Hydraulic hand pump
Shaker
42
3.3.1 Testing procedure and data analysis
The forced vibration testing procedure for the damped single cable is presented below.
1 Apply a predefined tension to the cable.
2 Mount an accelerometer on the top surface of the cable at the mid-span.
3 Determine the approximate first modal frequency of the cable by gradually
changing the excitation frequency of the shaker. When the excitation frequency
matches with the first modal frequency of the system, the highest amplitude of
vibration was observed.
4 Capture the in-plane transverse acceleration time history of the cable for the
excitation frequencies starting from 0.5 Hz lesser and up to 0.5 Hz higher of the
first modal frequency f1 of the damped cable. Increase the frequency in the signal
generator with an interval of 0.1 Hz from (f1 - 0.5) Hz to (f1-0.3) Hz and from to (f1
+ 0.3) Hz to (f1 + 0.5) Hz. The excitation frequency interval was adjusted to 0.05
Hz from (f1- 0.3) Hz to (f1 + 0.3) Hz.
5 Design a Butterworth filter to retain the data within of the frequency range between
f1- 0.5 Hz to f1 + 0.5 Hz, where f1 is the first modal frequency. Convert the filtered
acceleration data to displacement data and then determine the maximum amplitude
of vibration at each excitation frequency.
6 Plot a frequency-response curve to show the relation between the maximum
displacement at each excitation frequency versus the excitation frequency.
Determine the damping ratio of the damped cable using the half-power method (Paz
and Leigh, 2004). As shown in Figure 3.21, from the frequency-response curve,
43
amplitude of the frequency-response curve. Calculate the damping ratio using Eq.
(3.3). The natural frequency of the cable is the frequency corresponds to the peak
displacement.
𝜉 =
𝑅2−𝑅1𝑅2+𝑅1
(3.3)
3.3.2 Results
A sample calculation for determining the first modal frequency and modal damping
ratio of a damped cable using forced vibration method is presented below. In this sample
analysis, the cable had a pretension of 2.15 kN. A sample time history displacement curve 𝐷𝑚
𝐷𝑚 √2
𝑅2
𝑅1
44
at the excitation frequency of 5.5 Hz is shown in Figure 3.22. The sample data set and the
frequency-response curve is given in Table 3.6 and Figure 3.23, respectively.
Figure 3.22 Sample displacement time history for a single damped cable at excitation frequency of 5.5 Hz
1. Determine the maximum amplitude at each excitation frequency from the
corresponding displacement time history curve, as summarized in Table 3.6. Plot
the frequency-response curve, as shown in Figure 3.23 (the data point
45
Table 3.6 Maximum excitation versus excitation frequency of single damped cable
Excitation Frequency (Hz)
Maximum Displacement (cm)
5.20 0.3950
5.30 0.4806
5.40 0.6121
5.45 0.708
5.50 0.8356
5.55 1.0084
5.60 1.2856
5.65 1.5878
5.70 1.6728
5.75 1.4294
5.80 1.176
5.85 0.9835
5.90 0.8264
6.00 0.7023