1
A common terrorist threat worldwide is the use of large vehicle bombs to attack high value targets. Detonation of large yield devices can cause significant damage to nearby buildings, facilities and infrastructure with potentially high loss of life and large economic losses. Blast pressures can have major consequences on critical facilities such as nuclear power plants, causing economic loss, environmental damage and system failure. Closely spaced structures in a dense configuration provide a complicated setting for evaluating airblast pressures caused by explosive devices. The presence of multiple buildings can channel airblast, resulting in significant effects on load magnitudes at range from the detonation. Buildings reflect propagating blast waves causing increased loading at some locations and reduced loads elsewhere due to shielding from direct blast waves. The complex interaction between structures, streets, alleys and geographical terrain can have a major impact on structural loads. Currently, the most common way to estimate airblast pressures resulting from above ground explosive detonations is to use fast running, approximate blast tools such as CONWEP. These simplified tools may not provide accurate guidance on airblast pressures in complex environments. The following paper illustrates the use of Computational Fluid Dynamic (CFD) calculations of complex building configurations to quantify the resulting blast environment. Comparisons with simplified methods are presented. An approach to using a database of CFD simulations, customized for a specific site, to provide a fast running blast assessment tool is described. This approach provides a convenient, fast running tool for designers and security planners to visualize and accurately quantify the hazard from any threat size and location within the area of interest.
OVERVIEW
The common use of explosive devices by terrorists has increased the challenges facing structural designers and security planners who strive to minimize potential loss of life and economic damage resulting from these types of threats. Quantifying the threat of large yield, vehicle borne explosives detonated within urban centers or near critical facilities such as nuclear power generation plants can be especially challenging due to the interaction of blast waves propagating through areas having complex structural topologies.
An idealized spherical explosion located away from structural obstacles produces a propagating air blast which manifests 2-d axisymmetric (cylindrical) symmetry, i.e. the blast propagates uniformly in all horizontal directions. The pressure amplitude at any spatial location is purely a function of the location’s height above the ground and its radial distance from the center of the explosion. Although an explosive charge whose shape does not conform to cylindrical symmetry may not produce this idealized axisymmetric pressure variation in the near field; these non-symmetric pressure variations are usually second order in the far-field and can typically be ignored. Fig. 1 presents a plan view showing a snapshot of the circular peak pressure field produced by a spherical charge as it propagates radially prior to encountering any structural obstacles.
2
Fig. 1: Snapshot of 2-D axisymmetric form of pressure field prior to encountering structural obstacles
(a) 2-D layout of buildings in urban setting (b) 3-D display of buildings Fig. 2 Example layout of buildings in an urban setting – explosive charge located at center
3
4
Fig. 4: Example pressure field snapshot for explosion in actual city area
The effects of complex building layouts on airblast propagation can significant modify the pressure loads experienced by individual buildings and other facilities in proximity to an explosion. The blast pressure distribution can result in distributions of façade and structural damage throughout the area. Fig. 5 shows a local city area subjected to an explosive blast. Fig. 5a shows the peak pressure distribution in the vicinity of the explosion and Fig. 5b presents window breakage assessments based on the actual distributions of pressure and impulse resulting from the detonation. Here window breakage is illustrated, but damage to other equipment such as piping or electrical power distribution grids can also be evaluated and displayed. Simplified methods are not able to accurately quantify the distribution of blast pressures in these complex urban settings.
5 BLAST LOADS FOR NUCLEAR POWER FACILITY
Although Nuclear Power facilities are typically located away from urban centers and controlled access within the facility provides an important layer of security, these facilities may still be potential targets for vehicle borne explosive threats on the periphery of the facility. And the presence of large, critically important structures that make up the facility can complicate the process of developing accurate estimates of blast pressure loads on the structures and in the areas of interest.
A relevant example of a nuclear facility is shown in Fig. 6. The structural layout is idealized to avoid security concerns but represents the primary geometric details of a nuclear facility with two containment structures and two cooling towers. Assorted support structures are also included in the layout. Fig. 7 presents the peak pressure fields computed using CityBlast to compute high fidelity CFD simulations of explosive detonation at two different locations, one in front of the facility and one on the side of the facility. The locations and size of facility structures effects the blast pressure distribution over the facility.
6
(a) Threat located in front of facility (b) Threat located on side of facility Fig. 7: Influence of structures on spatial variation of peak pressure
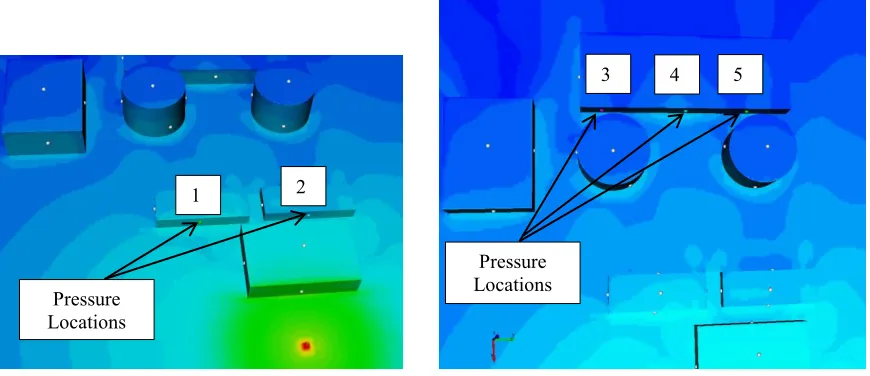
Looking closer at actual blast pressure time histories on the faces of buildings within the facilities is informative. Fig. 8 shows the location of five pressure output stations. Fig. 8a shows Output Locations #1 and #2, located at the mid-height of the front face of two similar buildings well within the strong blast effects range of the explosive threat. Location #2 is more shielded from the blast pressure than #1 due to the presence and position of another building in the blast path. Fig. 9 shows the pressure and impulse time histories computed using high fidelity CFD simulations and are compared with pressure time histories generated using the simplified CONWEP airblast tool. It’s clear that time of arrival, peak pressure values and impulse amplitudes are significantly affected by the presence of other structures in the facility. In this example, blast pressure amplitudes are reduced by a factor of as much as six from the simplified estimates provided by CONWEP. Although peak pressure can be a critical loading parameter, impulse is often more important for structural and equipment fragility than pressure magnitude. Impulse levels from the high fidelity CFD simulation are reduced by over a factor of 2 relative to the simplified CONWEP estimates.
(a) Locations on two buildings near blast (b) Locations on a single building further from blast Fig. 8: Output locations for pressure time histories at the center face of several buildings
Pressure Locations
1 2
3 4 5
7
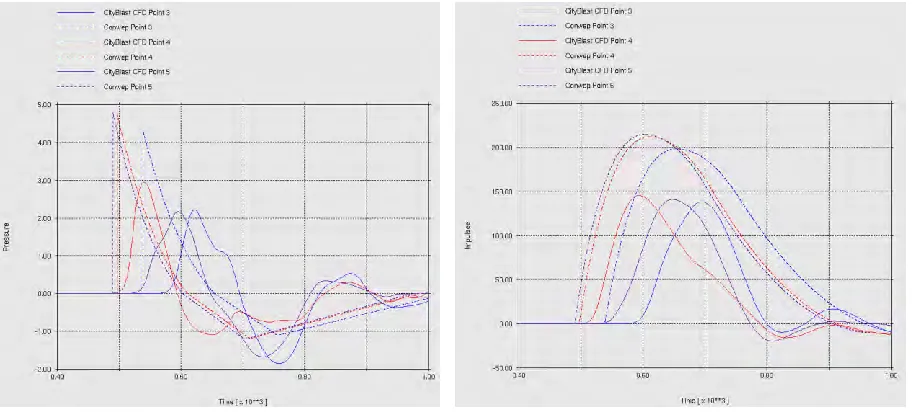
(a) Pressure time histories (b) Impulse time histories Fig. 9: Pressure and impulse time histories at output locations #1 and #2 (Fig. 8a)
Blast pressures on the face of another building located further from the blast and partially shielded by the containment buildings are presented in Fig. 10. Three locations as indicated in Fig. 8b are considered. Two locations, #3 and #5, are shielded by the presence of the containment structures and the third location, #4, is positioned midway between the containment structures, allowing a more direct path from the explosive detonation. CONWEP and CFD results are cross plotted for each location. Pressure and impulse time histories for these locations are presented in Fig. 10. The comparisons indicate that CONWEP over predicts the peak pressures by more than a factor of 2 while peak impulse, shown in Fig. 10b is over estimated by 40% to 50%.
(a) Pressure time histories (b) Impulse time histories Fig. 10: Pressure and impulse time histories at output locations #3, #4 and #5 (Fig. 8b)
FAST RUNNING TOOL APPROACH FOR HIGH FIDELITY CFD SOLUTIONS
8
locations to compute, an effective predictive tool can be developed that utilizes the resulting database of CFD results to effectively cover the range of explosive threats of interest. By calculating the airblast results for several different explosive yields at each location, the fast running model can use scaling methods to calculate results for yields that were not directly contained in the database. Simple yield scaling, curve fitting or more sophisticated scaling methods [4] can be used to produce scaled results that are highly accurate for almost any explosive threat of interest. Careful attention to software design allows the resulting software to present 3-D visual representations of the blast pressure results for any threat location or yield within three to five seconds on modern desktop computers, even for models that span large spatial extents. Additionally, accurate predictions of peak pressure and impulse on structural surfaces can be used to assess derived quantities such as window or façade damage, damage to structural support members and damage to equipment (both exterior or interior to buildings), barriers, guard shacks, and personnel that are vulnerable to blast pressure loads.
SUMMARY
Fast running airblast prediction models such as those embodied in tools such as CONWEP are fast and convenient but may not provide accurate blast pressure estimates for propagating blast waves that are significantly influenced by complex building layouts such as occur in urban settings on in structural complexes for industrial facilities like nuclear power generation plants.
This paper describes an approach using high fidelity CFD simulations to develop a fast running design and/or security planning tool that can provide accurate predictions of blast pressure loads for the range of threat locations and threat yields of interest for a specific site. Pressure and impulse fields can be generated and displayed in a few seconds. These results contain the complex interaction of the propagating blast pressure and the complex geometries of structures in the path of the blast pressures.
REFERENCES
[1] D. Tennant, D. Vaughan, P. Hassig ‘CityBlast – an Enhanced Urban AirBlast Tool”, Technical Report (to be published).
[2] C.N. Kingery and G. Bulmash, “Airblast Parameters from TNT Spherical Air Burst and Hemispherical Surface Burst”, Report ARBL-TR-02555, U.S. Army BRL, Aberdeen Proving Ground, MD, 1984.
[3] D. Hyde, “User’s Guide for Microcomputer Programs CONWEP and FUNPRO – Applications of TM 5-855-1”, U.S. Army Engineer Waterways Experimental Station, Vicksburg, 1988.