Journal of Pain Research 2018:11 83–94
Journal of Pain Research
Dove
press
submit your manuscript | www.dovepress.com 83
O R I G I N A L R E S E A R C H
open access to scientific and medical research
Open Access Full Text Article
Appropriateness of sham or placebo acupuncture
for randomized controlled trials of acupuncture
for nonspecific low back pain: a systematic review
and meta-analysis
Yan Xiang1
Jinyuan He2
Rui Li1
1Department of Teaching, School of Acupuncture and Moxibustion and
Tuina, Beijing University of Chinese
Medicine, Beijing, China; 2 Department
of Cardiothoracic Surgery, The Third
Affiliated Hospital of Sun Yat-sen
University, Guangzhou, China
Objectives: To establish whether sham acupuncture (SA) or placebo acupuncture (PA) is more efficacious for reducing low back pain (LBP) than other routine treatments and to discuss whether SA or PA is appropriate for randomized controlled trials of acupuncture for LBP.
Methods: Six databases were searched on 31 May 2017. We included only randomized
con-trolled trials of adults with LBP and lower back myofascial pain syndrome. The studies had at least two control arms: a sham-controlled acupuncture arm and a routine care or waiting list arm (people who did not receive acupuncture until the end of treatment). Trials were combined using meta-analysis methods when the data allowed statistical pooling. Pooled effect sizes were calculated by random effects models.
Results: This review identified 7 trials (1768 participants); all were included in the meta-analysis. We found statistically significant differences in pain reduction post-intervention between SA or PA and routine care or a waiting list, with a standardized mean difference of −0.36 (95% CI −0.54 to −0.18; I2 statistic=16%; participants=624; studies=6) for the Visual Analog Scale and
−0.35 (95% CI −0.49 to −0.20; I2 statistic=0%; participants=736; studies=1) for the Chronic Pain
Grade Scale; however, no significant difference was observed between SA or PA and routine care or no treatment for post-intervention function.
Conclusion: Compared with routine care or a waiting list, SA or PA was more efficacious for pain relief post-intervention. Concluding that SA or PA is appropriate for acupuncture research would be premature. Guidelines evaluating SA or PA control methods are needed to determine the specific effect of acupuncture over placebo.
Keywords: acupuncture, alternative medicine, backaches, pain management, placebos, con-trolled clinical trial, lumbago
Introduction
Nonspecific low back pain (LBP) is among the most common health complaints; it is the leading cause of years lived with disability worldwide and sixth in terms
of overall disease burden (disability-adjusted life-years).1 Although LBP is usually
a self-limiting and benign disease, a large variety of therapeutic interventions are
available to treat it.2
Acupuncture, based on the concepts of traditional Chinese medicine (TCM), is one of the oldest and most popular complementary or alternative treatment methods. Although it is one of the most commonly used interventions to treat LBP, acupuncture Correspondence: Rui Li
Department of Teaching, School of Acupuncture and Moxibustion and Tuina,
Beijing University of Chinese Medicine, No.11 Bei San Huan Dong Lu, Chaoyang
District, Beijing 100029, China Email [email protected]
Journal name: Journal of Pain Research Article Designation: ORIGINAL RESEARCH Year: 2018
Volume: 11
Running head verso: Xiang et al
Running head recto: Appropriateness of sham or placebo acupuncture for RCTs DOI: http://dx.doi.org/10.2147/JPR.S152743
Journal of Pain Research downloaded from https://www.dovepress.com/ by 118.70.13.36 on 24-Aug-2020
For personal use only.
Dovepress
Xiang et al
has mixed support. Despite a 2005 Cochrane review that reported the existence of some evidence supporting
acu-puncture for chronic LBP,3 a conclusion supported by another
systematic review,4 the National Institute for Health and Care
Excellence (NICE) in the UK removed acupuncture from their LBP guidelines in early 2016, citing a lack of evidence
to indicate that it was more effective than sham treatment.5
Sham acupuncture (SA), also called placebo acupunc-ture (PA), performed away from the acupuncacupunc-ture points established by TCM or without stimulation and manipula-tion to avoid eliciting “De Qi” sensamanipula-tions or using a non-penetrating technique, is used as control in scientific studies
to determine the efficacy of acupuncture.6,7 However, in
China, wrist-ankle acupuncture and abdomen acupuncture, both with shallow needling, are the primary treatments for LBP. It might be argued that the superficial or minimal acupuncture might stimulate C fibers in the skin to trigger
some kind of analgesic effect.8,9 Of those sham-controlled
clinical trials, several of them found no significant differ-ences between real acupuncture and SA/PA in pain relief for LBP.10–14 As a result, controversy persists regarding whether
acupuncture for LBP works primarily by the placebo effect. Meanwhile, some investigators argued that using SA/PA as a control is problematic because SA/PA might not meet the
criteria of being physiologically inert.15,16
Regardless, no systematic review and meta-analysis to date has addressed whether SA/PA has effects for LBP. We, therefore, performed a systematic review and meta-analysis of acupuncture for the treatment of LBP to determine whether SA/PA was more efficacious in reducing LBP than routine care and to discuss whether SA/PA is appropriate for use in randomized controlled trials (RCTs) of acupuncture for LBP.
Methods
Criteria for considering studies for this
review
Types of studies
We included only RCTs, which provide the highest level of evidence to assess the effects of interventions. Moreover, the studies had at least two control arms: a sham-controlled acupuncture arm and a routine care or waiting list (people who did not receive acupuncture until the end of treatment) or no treatment arm. Articles published in English or Chinese without region restriction were included.
Types of participants
We included studies which recruited adults (>18 years) with
LBP or myofascial pain syndrome in the lower back. RCTs
that included subjects with LBP caused by specific pathologi-cal entities such as infection, metastatic disease, neoplasm, osteoarthritis, rheumatoid arthritis, inflammatory processes, radicular syndrome, or fractures were excluded. Patients with LBP associated with sciatica as the major symptom, pregnancy, post-partum status, and post-operative LBP were
also excluded. Patients with acute, sub-acute (≤12 weeks),
or chronic LBP (>12 weeks) were included.
Types of interventions
We included studies in which acupuncture points were stimulated by needle insertion (with or without electroacu-puncture), accompanied by a definite sensation of De Qi. The studies in which methods of stimulating acupuncture points by acupressure, transcutaneous electrical nerve stimulation, or infrared light for verum acupuncture were excluded. Bee venom acupuncture and ear acupuncture were excluded. Tri-als comparing two techniques of acupuncture were excluded. Trials assessing the efficacy of acupuncture as an adjunct treatment to other therapies compared to SA/PA as an adjunct treatment to other therapies were included.
Types of outcome measures
RCTs were included if they used at least one of the following two outcome measures considered salient in the field of LBP:
1. Pain intensity (e.g., Visual Analog Scale [VAS]); 2. Back-specific functional status (e.g., Roland–Morris
Disability Questionnaire [RMDQ]).
The primary outcome was pain intensity. The secondary outcome measure was back-specific functional status.
Search methods for identification of
studies
Electronic searches
We searched the following databases:
1. Cochrane Central Register of Controlled Trials (CEN-TRAL; the Cochrane Library, to Issue 5 of 12 May 2017) on 31 May 2017
2. PubMed (1980 to May 2017) on 31 May 2017
3. EMBASE (Ovid SP, 1980 to May 2017) on 31 May 2017 4. China National Knowledge Infrastructure, the Wan Fang
and the Wei Pu databases up to 31 May 2017
Keywords, free words, and MeSH terms including “acupunc-ture” OR “acupuncture therapy” OR “acupuncture points” AND “low back pain” OR “lower back pain” OR “backache” OR “lumbago” were used.
Journal of Pain Research downloaded from https://www.dovepress.com/ by 118.70.13.36 on 24-Aug-2020
Dovepress Appropriateness of sham or placebo acupuncture for RCTs Searching other resources
Keywords of the references of all pertinent publications were traced, including systematic reviews and meta-analyses, to identify citations omitted by the electronic search.
Data collection and analysis
Selection of studies
For this review, one author generated the electronic search strategies in the CENTRAL, PubMed, EMBASE, and Chi-nese databases and downloaded the citations. Two authors independently applied the aforementioned inclusion criteria to identify trials. Any disagreements between them were resolved by consensus with a third review author acting as an arbiter. The authors of recent original studies were contacted to obtain more information when needed.
Data extraction and management
Two authors independently extracted data on the study characteristics, study population, duration of symptoms, treatment type, frequency and duration of the intervention, outcome measurements, and type of comparisons. A standard extraction form was used. Discrepancies were reassessed and consensus was reached by discussion. If necessary, a third author reviewed the data to reach consensus.
Assessment of risk of bias in included studies
Two authors independently assessed the risk of bias of each included trial using the criteria recommended in The Cochrane Handbook for Systematic Reviews of Interven-tions.17 Six domains of bias were assessed: selection bias,
performance bias, detection (or measurement) bias, attrition bias, reporting bias, and other bias (registered or not, ethics approval obtained or not, participants gave the informed consent or not, etc.). For each study, we scored each criterion as “high risk”, “low risk”, or “unclear”. Any disagreements were resolved by consensus and a third author was consulted if disagreements persisted. We also used the risk of bias assessment of the included trials for grading the quality of the evidence.
Measures of treatment effect
The analyses compared SA/PA to no treatment or routine care. For continuous measures, the use of weighted mean differences was preferred to analyze the results when the outcome measures were identical. Standardized mean dif-ferences (SMD) were used when different instruments were
used for the same outcome measurements.18,19
Unit of analysis time frame
We extracted data from the outcomes measured immediately following the end of the sessions for up to 1 week after the end of the sessions.
Missing data management
When data were missing, attempts were made to obtain information by contacting the study authors.
Assessment of heterogeneity
Random effects models were used for all meta-analyses. This method is recommended by the CBN Group Edito-rial Board because the assumptions underlying the random effects model are better suited to the statistical combination
of trials in this field.20
Assessment of reporting biases
Publication bias was assessed using funnel plots generated using RevMan (version: 5.3.5 [Java 7 64 bit]) Analysis
Software.21 We used the method of independent visual
inspection by two review authors. A third review author was consulted in cases of disagreement.
Data synthesis
We entered all quantitative results into RevMan (version:
5.3.5 [Java 7 64 bit]) Analyses Software.21 A meta-analysis
was considered when homogeneity existed in terms of population, comparison group, and outcome. The mag-nitude of the effect size was categorized as follows: 0.2 indicates a small effect, 0.5 a moderate effect, and 0.8 a
large effect.22
The GRADE approach was utilized to assess the qual-ity of the evidence. This grading method for each outcome considered risk of bias, inconsistency of results, indirectness
of evidence, imprecision, and publication bias.23
Subgroup analysis and assessment of heterogeneity
Assessments not planned in this review were subgroup or meta-regression analyses and sensitivity analysis.
Results
Description of studies
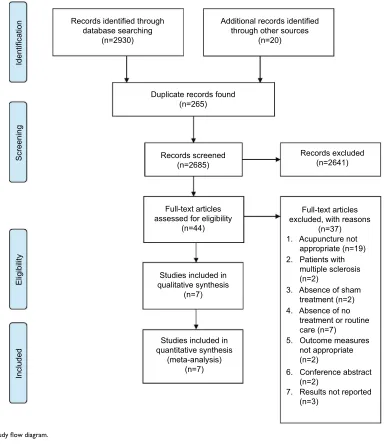
Results of the searchThe flow of studies is illustrated in Figure 1 study flow diagram. In this review, we identified seven trials for
inclusion.10,11,13,14,24
Journal of Pain Research downloaded from https://www.dovepress.com/ by 118.70.13.36 on 24-Aug-2020
Dovepress
Xiang et al
Included studies
In total, we included 7 trials (1768 participants). Four studies
were conducted in Germany (1139 participants),10,13,24,25 one
was conducted in the USA (323 participants),11 one was
con-ducted in Spain (206 participants),14 and one was conducted
in China (100 participants).26
Most patients included in these trials had chronic non-specific LBP. The control groups included conventional treatment, standard therapy, routine care, and waiting list.
The type of SA/PA varied among the included trials: four studies used a superficial insertion method at non-
acupuncture points,10,13,24,25 one used a toothpick in a needle
guide tube,11 and one penetrated at nonspecific
acupunc-ture points that were then puncacupunc-tured following the usual
procedure.14 The sham needles in the final study differed
from regular needles in that they had blunt and retractable
tips, although true acupuncture points were treated.26
Details of each included trial are presented in Table 1.
Risk of bias in included studies
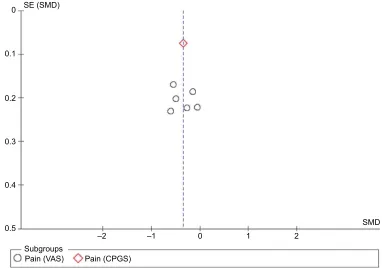
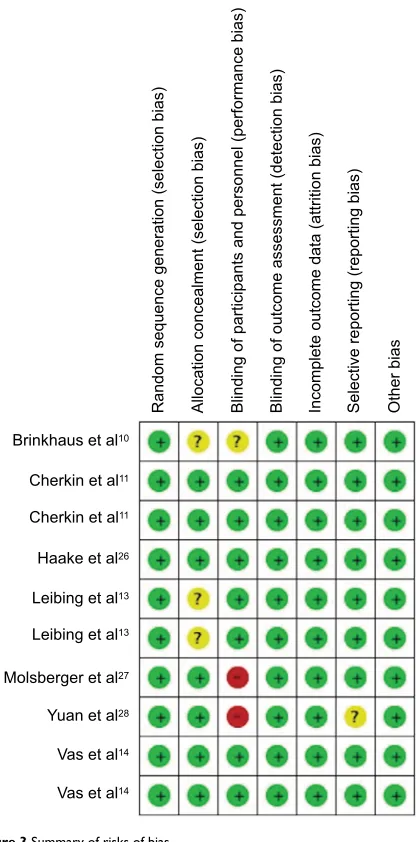
Some degree of publication bias was suggested (Figure 2), which may be attributed in part to the small number of studies. A summary of the risk of bias for each article is shown in Figure 3.
Figure 1 Study flow diagram.
Duplicate records found (n=265)
Additional records identified through other sources
(n=20) Records identified through
database searching (n=2930)
Records screened (n=2685)
Full-text articles assessed for eligibility
(n=44)
Full-text articles excluded, with reasons
(n=37) 1. Acupuncture not appropriate (n=19)
Studies included in qualitative synthesis
(n=7)
Included
Eligibility
Screening
Identification
Studies included in quantitative synthesis
(meta-analysis) (n=7)
7. Results not reported (n=3)
6. Conference abstract (n=2)
5. Outcome measures not appropriate (n=2)
4. Absence of no treatment or routine care (n=7) 2. Patients with multiple sclerosis (n=2)
3. Absence of sham treatment (n=2)
Records excluded (n=2641)
Journal of Pain Research downloaded from https://www.dovepress.com/ by 118.70.13.36 on 24-Aug-2020
Dovepress Appropriateness of sham or placebo acupuncture for RCTs
Table 1
Study design and outcome measures
Trials
Number of treatments/ Frequency/Duration per treatment Intervention group (N, Age, Sex) Type of intervention Control group (N, Age, Sex) Type of comparison Duration of pain Duration of intervention Outcome measures Adverse effects
Brinkhaus et
al
10
12 sessions, 30 min per session
a
N
=
73 (18M, 55F) Mean
age
=
58
Minimal acupuncture
N
=
79 (25M, 54F)
Mean age = 59 Waiting list > 6 months 8 weeks
VAS, FFbH-Rscore, PDI score
Reported
Cherkin et
al
11
10 sessions, 20 min per session
b
N
=
162 (102M, 60F)
Mean age
=
47
Simulated acupuncture
N
=
161 (97M, 64F)
Mean age = 46 Usual care > 3 months 7 weeks
RMDQ, symptom bothersomeness
Reported
Haake et
al
24
10 sessions, 30 min per session
N
=
387 (140M, 247F)
Mean age
=
49
Sham acupuncture
N
=
388 (165M,
223F) Mean age
= 51 Standard therapy > 6 months 6 weeks
Von Korff CPGS, HFAQ
Reported
Leibing et
al
13
20 sessions, 30 min per session
N
=
45 (18M, 27F) Mean
age
=
49
Sham acupuncture
N
=
46 (19M, 27F),
Mean age = 48 Control group > 6 months 12 weeks VAS, PDI Reported
Molsberger et al
25 12 sessions, 3 per week,
30 min per session
N
=
61 (33M, 28F) Mean
age
=
50
Sham acupuncture
N
=
60 (28M, 32F),
Mean age = 49 COT alone ≥ 6 weeks 4 weeks VAS No Yuan et al 26
21 sessions, 20 min per session
N
=
50 (15M, 35F) Mean
age
=
46
Sham acupuncture
N
=
50 (16M, 34F)
Mean age = 44 Waiting list < 2 weeks 6 weeks VAS, ODI Reported Vas et al 14
5 sessions, 20 min per session
N
=
68 (29M, 39F)
Mean age = 44; N = 69
(35M, 34F) Mean age
=
44
Sham acupuncture; placebo acupuncture
N
=
70 (25M, 45F),
Mean age
=
41
Conventional treatment
< 2 weeks 2 weeks VAS, RMDQ No Notes:
aUsually two sessions in each of the first 4 weeks, followed by one session per we
ek in the remaining 4 weeks.
bTwice weekly for 3 weeks and then once weekly for 4 weeks.
Abbreviations: COT, conventional orthopedic therapy; CPGS, Chronic Pain Grade Scale; F, female; FFbH-R, Funktionsfragebogen Hannover-Rücken (back function questionnaire); HFAQ, Hanover Functional Ability Questionnaire; M,
male; ODI, Oswestry Disability Index; PDI, Pain Disability Index; RMDQ, Roland-Morris Disability Questionnaire; VAS, Visual Analog Scale.
Journal of Pain Research downloaded from https://www.dovepress.com/ by 118.70.13.36 on 24-Aug-2020
Dovepress
Xiang et al
Figure 3 provides an overview of the methodological quality assessment of the included studies. Three of the
tri-als had a low risk of bias.11,14,24 Two studies had a high risk
of bias.25,26 The remaining two studies had an unclear risk of
bias.10,13 All studies fully or partially fulfilled the categories
of allocation concealment, selective outcome, incomplete outcome data, and other sources of bias. The two trials at high risk of bias were deemed as such because of the lack of blinding of participants and personnel.
Effects of interventions
The studies compared SA/PA to routine care or waiting list. Based on the current evidence, SA/PA was clearly more effective than routine care or waiting list for pain relief post-intervention, with an SMD of −0.36 (95% CI −0.54 to −0.18;
I2 statistic=16%) in VAS and −0.35 (95% CI −0.49 to −0.20; I2
statistic=0%) in Chronic Pain Grade Scale (CPGS; Figure 4).
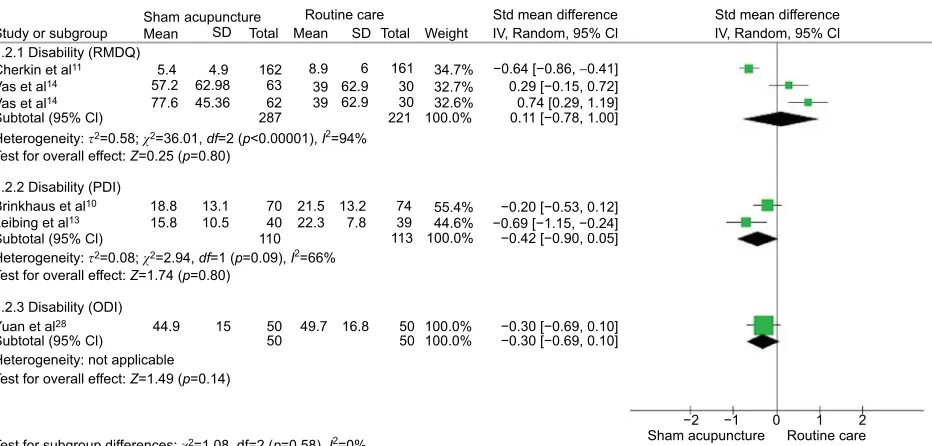
Five of the seven included trials measured functional dis-ability outcomes, with two using the RMDQ, two using the Pain Disability Index (PDI), and one using the Oswestry Dis-ability Index (ODI). No significant difference was observed between SA/PA and routine care or no treatment as measured immediately after the end of the sessions (RMDQ: SMD of
0.11; 95% CI −0.78 to 1.00; I2 statistic=94%; PDI: SMD of
−0.42; 95% CI −0.90 to 0.05; I2 statistic=66%; ODI: SMD
of −0.30; 95% CI −0.69 to 0.10; Figure 5).
A summary of the findings for the main comparison is presented in Table 2.
Subgroup analysis
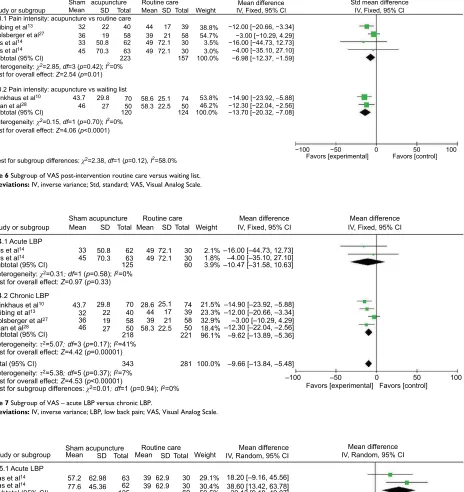
We added the subgroup analysis of VAS post-intervention, though we did not plan it in the protocol, because control groups in the included studies contained routine care and waiting list. Thus, we made the subgroup routine care versus waiting list. The results are consistent with pain differences in favor of SA/PA in both the routine care (mean difference [MD] −6.98 [95% CI −12.37, −1.59]) and waiting list sub-groups (MD −13.70 [95% CI −20.32, −7.08]; Figure 6). The total MD and 95% CI were −9.66 (−13.84, −5.84) in favor of SA/PA. A similar finding was shown in chronic LBP sub-group for VAS (Figure 7). But there were no differences found in acute and chronic LBP subgroups for RMDQ (Figure 8).
Discussion
Summary of main results
Seven RCTs comprising a total of 1768 patients were included in this systematic review and meta-analysis. Moderately significant evidence was obtained for the
Figure 2 Funnel plot of comparison between SA/PA and routine care for LBP. Outcome: pain intensity (higher score signifies greater pain).
Abbreviations: CPGS, Chronic Pain Grade Scale; LBP, low back pain; PA, placebo acupuncture; SA, sham acupuncture; SE, standard error; SMD, standardized mean differences; VAS, Visual Analog Scale.
0.5
Subgroups
Pain (VAS) Pain (CPGS)
–2 –1 0 1 2
SMD 0.4
0.3 0.2 0.1
0 SE (SMD)
Journal of Pain Research downloaded from https://www.dovepress.com/ by 118.70.13.36 on 24-Aug-2020
Dovepress Appropriateness of sham or placebo acupuncture for RCTs effectiveness of SA/PA for pain intensity as measured at the end of the treatments for LBP management. However, the review demonstrates scant support for the superior effectiveness of SA/PA compared with routine care or waiting list for back-specific functional status at the end of the treatments.
Overall completeness and applicability of
evidence
We did not find a large effect size in the meta-analysis of continuous outcomes for pain intensity. All meta-analyses of continuous outcomes were performed using SMD values because the included trials used different measurement instruments for the outcomes of interest (pain and function). The disadvantage of using SMD values is that clinicians and patients are unlikely to relate to this way of presenting results. No serious adverse events were observed in these trials; the most common adverse event was increased pain after the massage sessions.
Quality of the evidence
In this review, we found two trials with unclear allocation of concealment bias and one trial with unclear selective report-ing bias, suggestreport-ing that some studies may have exaggerated estimates of the intervention effect size compared with large trials. Two trials did not blind participants and personnel, suggesting that blinding patients and health-care providers was the most challenging methodological step in clinical trials of acupuncture, notwithstanding the recently improved methodological quality of the included RCTs.
Figure 3 Summary of risks of bias.
Note: +, yes; -, no; ?, unclear.
Brinkhaus et al10
Random sequence generation (selection bias
)
Allocation concealment (selection bias
)
Blinding of participants and personnel (performance bias
)
Blinding of outcome assessment (detection bias
)
Incomplete outcome data (attrition bias
)
Selective reporting (reporting bias
)
Other bias
Cherkin et al11
Cherkin et al11
Haake et al26
Leibing et al13
Leibing et al13
Molsberger et al27
Yuan et al28
Vas et al14
Vas et al14
Figure 4 Forest plot of comparison between SA/PA and routine care or waiting list for LBP. Outcome: pain intensity – VAS and CPGS.
Abbreviations: CPGS, Chronic Pain Grade Scale; IV, inverse variance; LBP, low back pain; PA, placebo acupuncture; SA, sham acupuncture; Std, standard; VAS, Visual Analog Scale.
Study or subgroup 1.1.1 Pain (VAS)
Brinkhaus et al10 43.7
32 36 46 33 45
29.8 22 19 27 50.8 70.3
70 40 58 50 62 63
58.6 44 39 58.3 49 49
25.1 17 21 22.5 72.1 72.1
57.1 16.5 361
361 74 39 58 50 30 30 281
10.6% 5.7% 8.8% 7.4% 6.1% 6.2% 44.8%
−0.54 [−0.87, −0.21]
−0.60 [−1.05, −0.15] −0.15 [−0.51, 0.22] −0.49 [−0.89, −0.09] −0.27 [−0.71, 0.17] −0.06 [−0.49, 0.38]
−2 −1 0 1 2
−0.36 [−0.52, −0.20]
55.2%
55.2% −0.35 [−0.49, −0.20]−0.35 [−0.49, −0.20]
343
51 18.7
375
642 100.0% −0.35 [−0.46, −0.24] 718
375
Leibing et al13
Molsberger et al27
Yuan et al28
Vas et al14
Vas et al14
Haake et al26
Heterogeneity: c2=5.97, df=5(p=0.31); I2=16%
Test for overall effect: Z=4.36 (p<0.0001)
Heterogeneity: c2=5.99, df=6 (p=0.42); I2=0%
Test for subgroup differences: c2=0.02, df=1 (p=0.90), I2=0%
Test for overall effect: Z=6.37 (p<0.00001)
Heterogeneity: not applicable
Test for overall effect: Z=4.65 (p<0.00001)
Subtotal (95% Cl)
Subtotal (95% Cl)
Total (95% Cl) 1.1.2 Pain (CPGS)
Sham
Mean acupuncture Routine care
Sham acupuncture Routine care
Std mean difference Std mean difference
IV, Fixed, 95% Cl IV, Fixed, 95% Cl
SD Total Mean SD Total Weight
Journal of Pain Research downloaded from https://www.dovepress.com/ by 118.70.13.36 on 24-Aug-2020
Dovepress
Xiang et al
Potential biases in the review process
Acupuncture is not a standardized therapy, and many vari-ables may affect its potential effect on LBP, such as the needling technique, duration, frequency and number of sessions, points treated, manipulation, stimulus intensity, acupuncturists’ experience, patient heterogeneity, and con-founding variables, such as co-interventions or the emotional effect of counseling by the acupuncturists.SA/PA includes several forms. In this review, one type is a superficial insertion into non-acupuncture points and
nonspecific acupuncture points.10,13,14,24–26 Another type uses
a non-penetration method, with sham needles having blunt
and retractable tips.11
For the points treated, some studies used a fixed proto-col for all patients while others used a flexible set of points selected for each patient. Since both the methods are con-sidered valid, this systematic review analyzed them together. Limitations of this meta-analysis include the heterogeneity of the participants, because we included people with both acute and chronic nonspecific LBP, though we had subgroups. If there had been more literature, the evidence of the results would be more convincing with analyzing the types of LBP (acute, sub-acute, and chronic) separately, as they have different clinical approaches and disease trajectories. Additionally, the small num-ber of studies for each SA/PA technique is another limitation. Furthermore, while no regions were excluded, the number of non-English-language journals indexed in electronic databases such as MEDLINE and EMBASE is limited. Should additional relevant trials be identified, this review will be updated.
Conclusion
Implications for practice
Notably, SA/PA was originally developed for use in acu-puncture trials to determine the specific effects of needling. In clinical trials, procedures similar to real acupuncture may
bias the results,27 and the sham or placebo control should be
indistinguishable from the active treatment and yet be physi-ologically inert. Without meeting both criteria, it may not be appropriate to regard some procedures as sham or placebo controls within systematic reviews. While this review found evidence that SA/PA is more efficacious than routine care or waiting list in terms of pain relief at the end of the treatments, no evidence existed for improved function.
Additionally, variations of acupuncture must be consid-ered. Based on TCM theory, all acupuncture procedures (e.g., points used, method of stimulation, and number of treatment sessions) must be performed according to individual dif-ferences; thus, acupuncture modalities vary among studies
and are difficult to master and unify.28 Therefore, studies
that examine the specific sham or placebo techniques used, including needle placement, needle insertion, acupuncture points or non-acupuncture points or nonspecific acupuncture points, and the acupuncturists’ experience are required, so as to differ distinguish from the real acupuncture. Furthermore, future research should focus on the standardization of out-come measures and the duration and frequency of sessions. Besides, because acupuncture functions as a somato-sensory-guided mind-body therapy, SA/PA could similarly enhance bodily sensations around the treatment site and
Figure 5 Forest plot of comparison between SA/PA and routine care or waiting list for LBP. Outcome: functional disability – RMDQ, PDI, and ODI.
Abbreviations: IV, inverse variance; LBP, low back pain; ODI, Oswestry Disability Index; PA, placebo acupuncture; PDI, Pain Disability Index; RMDQ, Roland–Morris Disability Questionnaire; SA, sham acupuncture; Std, standard.
Study or subgroup 1.2.1 Disability (RMDQ)
Cherkin et al11 5.4
57.2 77.6
4.9 62.98 45.36
162 63 62
8.9 39 39
6 62.9 62.9
161 30 30
34.7% 32.7% 32.6%
−0.64 [−0.86, −0.41]
0.29 [−0.15, 0.72] 0.74 [0.29, 1.19] 0.11 [−0.78, 1.00]
−0.20 [−0.53, 0.12] −0.69 [−1.15, −0.24] −0.42 [−0.90, 0.05]
−2 −1 0 1 2
287 221
113 110
100.0%
55.4% 44.6% 100.0% 18.8
15.8 13.110.5 70 21.522.3 13.27.8 7439
−0.30 [−0.69, 0.10] 100.0%
44.9 15 50 49.7 16.8 50
−0.30 [−0.69, 0.10] 100.0%
50 50
40
Vas et al14
Vas et al14
Brinkhaus et al10
Leibing et al13
Yuan et al28
Heterogeneity: t2=0.58; c2=36.01, df=2 (p<0.00001), I2=94%
Test for overall effect: Z=0.25 (p=0.80)
Heterogeneity: t2=0.08; c2=2.94, df=1 (p=0.09), I2=66%
Test for overall effect: Z=1.74 (p=0.80)
Test for subgroup differences: c2=1.08, df=2 (p=0.58), I2=0%
Heterogeneity: not applicable
Test for overall effect: Z=1.49 (p=0.14)
Subtotal (95% Cl)
Subtotal (95% Cl)
Subtotal (95% Cl) 1.2.2 Disability (PDI)
1.2.3 Disability (ODI) Sham
Meanacupuncture Routine care
Sham acupuncture Routine care
Std mean difference Std mean difference
IV, Random, 95% Cl IV, Random, 95% Cl
SD Total Mean SD Total Weight
Journal of Pain Research downloaded from https://www.dovepress.com/ by 118.70.13.36 on 24-Aug-2020
Dovepress Appropriateness of sham or placebo acupuncture for RCTs
Table 2
Summary of findings for the main comparison
Sham or placebo acupuncture versus routine care or no treatment for nonspecific low back pain Outcomes
Illustrative comparative risks
a (95% CI)
Relative effect (95% CI) Number of participants (studies) Quality of the evidence (GRADE)
Comments
Assumed risk
Corresponding risk
Control
Sham or placebo acupuncture versus routine care or no treatment
Pain intensity immediately after the treatment – Pain
(VAS)
The mean pain intensity immediately after the treatment – pain (VAS) ranged across control groups from 39 to 58.6 mm The mean pain intensity immediately after the treatment – pain (VAS) in the intervention groups was 0.36 SD lower (0.54 to 0.18 lower) 624 (6 studies)
⊕⊕⊕⊝ moderate b SMD − 0.36 ( − 0.54 to − 0.18)
Pain intensity immediately after the treatment – Pain
(CPGS)
The mean pain intensity immediately after the treatment – pain (CPGS) across control groups is 57.1 The mean pain intensity immediately after the treatment – pain (CPGS) in the intervention groups was 0.35 SD lower (0.49 to 0.2 lower)
736 (1 study)
⊕⊕⊕⊕ high SMD − 0.35 ( − 0.49 to − 0.2)
Disability immediately after the treatment – Disability (RMDQ) The mean disability immediately after the treatment – disability (RMDQ) ranged across control groups from 8.9 to 39 The mean disability immediately after the treatment
– disability (RMDQ) in the intervention
groups was 0.11 SD higher (0.78 lower to 1 higher) 508 (3 studies)
⊕⊕⊕⊝ moderate SMD 0.11 (−0.78 to 1)
Disability immediately after the treatment – Disability (PDI) The mean disability immediately after the treatment – disability (PDI) ranged across control groups from 21.5 to 22.3 The mean disability immediately after the treatment – disability (PDI) in the intervention groups was 0.42 SD lower (0.9 lower to 0.05 higher) 223 (2 studies)
⊕⊕⊝⊝ low c SMD − 0.42 ( −
0.9 to 0.05)
Disability immediately after the treatment – Disability (ODI) The mean disability immediately after the treatment – disability (ODI) across control groups is 49.7 The mean disability immediately after the treatment – disability (ODI) in the intervention groups was 0.3 SD lower (0.69 lower to 0.1 higher)
100 (1 study)
⊕⊕⊝⊝ low c SMD − 0.3 ( −
0.69 to 0.1)
Notes: aThe basis for the assumed risk (e.g., the median control group risk across studies). The corresponding risk (and its 95% CI) is based on the assumed risk in the comparison group and the relative effect of the intervention (and its 95% CI). GRADE Working Group grades of evidence. High quality ( ⊕⊕⊕⊕ ): further resea rch is very unlikely to change our confidence in the estimate of effect. Moderate quality ( ⊕⊕⊕⊝ ): further research is likely to have an important impact on our confidence in the estimate of effect and may change the estimate. Low quality ( ⊕⊕⊝⊝ ): further research is very likely to have an important impact on our confidence in the estimate of effect and is likely to change the
estimate. Very low quality (
⊕⊝⊝⊝
): we are very uncertain about the estimate.
bTwo articles lack blinding of participants and personnel. c95% CI includes no effect.
Abbreviations:
CPGS, Chronic Pain Grade Scale; ODI, Oswestry Disability Index; PDI, Pain Disability Index; RMDQ, Roland-Morris Disability Questionnaire; SMD, standard mean difference; VAS, Visual Analog Scale.
Journal of Pain Research downloaded from https://www.dovepress.com/ by 118.70.13.36 on 24-Aug-2020
Dovepress
Xiang et al
Figure 6 Subgroup of VAS post-intervention routine care versus waiting list.
Abbreviations: IV, inverse variance; Std, standard; VAS, Visual Analog Scale. Study or subgroup
1.3.1 Pain intensity: acupuncture vs routine care
Brinkhaus et al10 43.7 32 36 46 33 45 29.8 22 19 27 50.8 70.3 70 40 58 50 62 63
223 157 100.0%
58.6 44 39 58.3 49 49 25.1 17 21 22.5 72.1 72.1 74 39 58 50 30 30 53.8% 38.8% 54.7% 46.2% 3.5% 3.0%
−14.90 [−23.92, −5.88] −12.00 [−20.66, −3.34] −3.00 [−10.29, 4.29]
−12.30 [−22.04, −2.56] 124
120 100.0% −13.70 [−20.32, −7.08] −16.00 [−44.73, 12.73] −4.00 [−35.10, 27.10] −6.98 [−12.37, −1.59]
−100 −50 0 50 100
Leibing et al13 Molsberger et al27
Yuan et al28 Vas et al14 Vas et al14
Heterogeneity: c2=2.85, df=3 (p=0.42); I2=0%
Test for overall effect: Z=2.54 (p=0.01)
Heterogeneity: c2=0.15, df=1 (p=0.70); I2=0%
Test for subgroup differences: c2=2.38, df=1 (p=0.12), I2=58.0%
Test for overall effect: Z=4.06 (p<0.0001) Subtotal (95% Cl)
Subtotal (95% Cl)
1.3.2 Pain intensity: acupuncture vs waiting list Sham
Mean acupuncture Routine care
Favors [experimental] Favors [control] Mean difference Std mean difference IV, Fixed, 95% Cl IV, Fixed, 95% Cl SD Total Mean SD Total Weight
Figure 7 Subgroup of VAS – acute LBP versus chronic LBP.
Abbreviations: IV, inverse variance;LBP, low back pain; VAS, Visual Analog Scale. Study or subgroup
Subtotal (95% CI)
Subtotal (95% CI)
Total (95% CI) 1.4.1 Acute LBP
33 45
43.7 29.8 70 28.6 25.1
17 74 21.5% –14.90 [–23.92, –5.88]–12.00 [–20.66, –3.34]
–3.00 [–10.29, 4.29] –12.30 [–22.04, –2.56] –9.62 [–13.89, –5.36]
–100 –50
Favors [experimental] Favors [control]0 50 100
–9.66 [–13.84, –5.48] 23.3% 32.9% 18.4% 96.1% 100.0% 39 58 50 221 281 21 22.5 44 39 58.3 40 58 50 218 343 22 19 27 32 36 46
50.8 62 49 72.1 30 2.1% –16.00 [–44.73, 12.73]
–4.00 [–35.10, 27.10] –10.47 [–31.58, 10.63] 1.8% 3.9% 30 60 72.1 63 49 125 70.3
1.4.2 Chronic LBP
Vas et al14
Brinkhaus et al10
Leibing et al13
Molsberger et al27
Yuan et al28
Vas et al14
Sham acupuncture Routine care Mean difference
IV, Fixed, 95% CI IV, Fixed, 95% CIMean difference
Mean SD Total Mean SD Total Weight
Test for overall effect: Z=0.97 (p=0.33)
Heterogeneity: c2=0.31;df=1 (p=0.58); I2=0%
Test for overall effect: Z=4.42 (p=0.00001)
Test for overall effect: Z=4.53 (p<0.00001)
Test for subgroup differences: c2=0.01;df=1 (p=0.94); I2=0%
Heterogeneity: t2=5.07;df=3 (p=0.17); I2=41%
Heterogeneity: t2=5.38;df=5 (p=0.37); I2=7%
Figure 8 Subgroup of RMDQ – acute LBP versus chronic LBP.
Abbreviations: IV, inverse variance; LBP, low back pain; RMDQ, Roland–Morris Disability Questionnaire.
Study or subgroup Sham acupunctureMean Routine care IV, Random, 95% CIMean difference IV, Random, 95% CIMean difference
57.2 62.98 63 39 62.9 30 29.1% 18.20 [–9.16, 45.56]
38.60 [13.42, 63.78] 29.13 [9.19, 49.07] 30.4% 59.5% 30 60 62.9 39 62 125 45.36 77.6
5.4 4.9 162
162
287 221 100.0%
–100 –50 0 50 100
15.62 [–12.21, 43.45]
8.9 6 161
161 40.5%40.5% –3.50 [–4.70, –2.30]–3.50 [–4.70, –2.30]
SD Total Mean SD Total Weight
Subtotal (95% CI)
Subtotal (95% CI)
Total (95% CI) 1.5.1 Acute LBP
1.5.2 Chronic LBP
Cherkin et al11
Vas et al14
Vas et al14
Test for overall effect: Z=2.86 (p=0.004)
Test for overall effect: Z=5.74 (p=0.00001)
Test for overall effect: Z=1.10 (p=0.27)
Heterogeneity: t2=28.13;c2=1.16 df=1 (p=0.28); I2=14%
Test for subgroup differnces: c2=10.25;df=1 (p=0.001); I2=90.2%
Heterogeneity: t2=497.71;c2=13.10 df=2 (p=0.001); I2=85%
Heterogeneity: not applicable
Favors [experimental] Favors [control]
Journal of Pain Research downloaded from https://www.dovepress.com/ by 118.70.13.36 on 24-Aug-2020
Dovepress Appropriateness of sham or placebo acupuncture for RCTs induce potential effects related to endogenous pain
modula-tion in the brain.27–29
Thus, we should avoid prematurely concluding that SA/PA is appropriate for acupuncture research. Moreover, guidelines should be developed to assess acupuncture sham– placebo control methods to address the specific effect of acupuncture over placebo.
Implications for research
To provide homogeneous information for future reviews, trial authors are encouraged to use the Consolidated Standards of Reporting Trials (CONSORT) statement as a model for
reporting their trials (www.consort-statement.org) and the
Standards for Reporting Interventions in Clinical Trials of
Acupuncture (STRICTA) criteria30 to report the interventions.
From the available trials we included in this meta-analysis, superficial stimulation appears a more promising treatment for LBP than routine care in relieving pain post-intervention. Further studies to assess the superiority of SA/PA are required, as are those with larger sample sizes and those that assess the role of session length by including two (or more) levels of this variable; moreover, the experience of the therapist should also be considered by including practitioners with different levels of experience and training.
Acknowledgment
Prospero registration number: CRD42017070122.
Disclosure
The authors report no conflicts of interest in this work.
References
1. Maher C, Underwood M, Buchbinder R. Non-specific low back pain.
Lancet. 2017;389(10070):736–747.
2. Furlan AD, Yazdi F, Tsertsvadze A, et al. Acupuncture for (sub)acute non-specific low-back pain(Protocol). Cochrane Database Syst Rev.
2011(8):CD009265.
3. Furlan AD, Van Tulder MW, Cherkin D, et al. Acupuncture and dry-needling for low back pain. Cochrane Database Syst Rev. 2005(1): CD001351.
4. Liu L, Skinner M, McDonough S, Mabire L, Baxter GD. Acupuncture for low back pain: an overview of systematic reviews. EvidBased ComplementAlternatMed. 2015;2015:328196.
5. Wise J. NICE recommends exercise and not acupuncture for low back pain. BMJ. 2016;352:i1765.
6. Carlos Lopes-Júnior L, Cruz LA, Leopoldo VC, Campos FR, Almeida AM, Silveira RC. Effectiveness of traditional Chinese acupuncture versus sham acupuncture: a systematic review. Rev Latino-Americana de Enfermagem. 2016;24:1–12.
7. Zhang LL, Chu Q, Wang S, Lai H, Xie BB. Is sham acupuncture as effective as traditional Chinese acupuncture? It’s too early to say. Chin J Integ Med. 2016;22(7):483–489.
8. Price DD, Staud R, Robinson ME, Mauderli AP, Cannon R, Vierck CJ. Enhanced temporal summation of second pain and its central modula-tion in fibromyalgia patients. Pain. 2002;99(1–2):49–59.
9. Staud R, Cannon RC, Mauderli AP, Robinson ME, Price DD, Vierck CJ Jr. Temporal summation of pain from mechanical stimulation of muscle tissue in normal controls and subjects with fibromyalgia syndrome.
Pain. 2003;102(1–2):87–95.
10. Brinkhaus B, Witt CM, Jena S, et al. Acupuncture in patients with chronic low back pain: a randomized controlled trial. ArchInternMed.
2006;166(4):450–457.
11. Cherkin DC, Sherman KJ, Avins AL, et al. A randomized trial compar-ing acupuncture, simulated acupuncture, and usual care for chronic low back pain. ArchInternMed. 2009;169(9):858–866.
12. Cho YJ, Song YK, Cha YY, et al. Acupuncture for chronic low back pain: a multicenter, randomized, patient-assessor blind, sham-controlled clinical trial. Spine. 2013;38(7):549–557.
13. Leibing E, Leonhardt U, Köster G, et al. Acupuncture treatment of chronic low-back pain – A randomized, blinded, placebo-controlled trial with 9-month follow-up. Pain. 2002;96(1–2):189–196.
14. Vas J, Aranda JM, Modesto M, et al. Acupuncture in patients with acute low back pain: A multicentre randomized controlled clinical trial. Pain.
2012;153(9):1883–1889.
15. Tough EA, White AR, Richards SH, Lord B, Campbell JL. Devel-oping and validating a sham acupuncture needle. Acupunct Med.
2009;27(3):118–122.
16. Madsen MV, Gotzsche PC, Hrobjartsson A. Acupuncture treatment for pain: systematic review of randomized clinical trials with acupuncture, placebo acupuncture, and no acupuncture groups. BMJ. 2009;338:a3115. 17. Higgins JP, Altman DG, Gøtzsche PC, et al; Cochrane Bias Methods
Group; Cochrane Statistical Methods Group. The cochrane collaboration’s tool for assessing risk of bias in randomized trials. BMJ. 2011;343:d5928. 18. Whitehead A, Whitehead J. A general parametric approach to the
meta-analysis of randomized clinical trials. Stat Med. 1991;10(11): 1665–1677.
19. Normand SL. Meta-analysis: formulating, evaluating, combining,and reporting. Stat Med. 1999;18(3):321–359.
20. Furlan AD, Malmivaara A, Chou R, et al; Editorial Board of the Cochrane Back, Neck Group. 2015 updated method guideline for systematic reviews in the cochrane back and neck group. Spine (Phila Pa 1976). 2015;40(21):1660–1673.
21. Review Manager (RevMan) [Computer program]. Version 5.3. Copen-hagen: The Nordic Cochrane Center TCC; 2014.
22. Cohen J, Cohen J, Cohen D ea. Statistical power analysis for the behav-ioral science. J Am Stat Assoc. 1988;84(363):19–74.
23. Schünemann H, Brożek J, Guyatt G, Oxman A. Handbook for grad-ing the quality of evidence and the strength of recommendations using the GRADE approach. Updated October 2013. The Cochrane Collaboration;2013.
24. Haake M, Müller HH, Schade-Brittinger C, et al. German Acupunc-ture Trials (GERAC) for chronic low back pain: Randomized, multi-center, blinded, parallel-group trial with 3 groups. Arch Intern Med.
2007;167(17):1892–1898.
25. Molsberger AF, Mau J, Pawelec DB, Winkler J. Does acupuncture improve the orthopedic management of chronic low back pain–a random-ized, blinded, controlled trial with 3 months follow up. Pain. 2002;99(3): 579–587.
26. Yuan Q, Liu L, Ma J, Wu W, Ye M, Zhang Y. A clinical study of acu-puncture therapy for treatment of chronic nonspecific low back pain.
J Trad Chin Orthop Trauma. 2016;28(6):12–17.
27. Appleyard I, Lundeberg T, Robinson N. Should systematic reviews assess the risk of bias from sham–placebo acupuncture control proce-dures? Eur J Integ Med. 2014;6(2):234–243.
28. Ji M, Wang X, Chen M, Shen Y, Zhang X, Yang J. The efficacy of acupuncture for the treatment of sciatica: asystematic review and meta-analysis. EvidBased ComplementAlternMed. 2015;2015:192808. 29. Lund I, Lundeberg T. Are minimal, superficial or sham acupuncture
procedures acceptable as inert placebo controls? Acupunct Med.
2006;24(1):13–15.
30. Dorsher PT. The 2001 STRICTA recommendations for reporting acu-puncture research: a review with implications for improving controlled clinical trial design. J Alternat Complem Med. 2009;15(2):147–151.
Journal of Pain Research downloaded from https://www.dovepress.com/ by 118.70.13.36 on 24-Aug-2020
Dovepress
Journal of Pain Research
Publish your work in this journal
Submit your manuscript here: https://www.dovepress.com/journal-of-pain-research-journal
The Journal of Pain Research is an international, peer reviewed, open access, online journal that welcomes laboratory and clinical findings in the fields of pain research and the prevention and management of pain. Original research, reviews, symposium reports, hypoth-esis formation and commentaries are all considered for publication.
The manuscript management system is completely online and includes a very quick and fair peer-review system, which is all easy to use. Visit http://www.dovepress.com/testimonials.php to read real quotes from published authors.
Dove
press
Xiang et al
Journal of Pain Research downloaded from https://www.dovepress.com/ by 118.70.13.36 on 24-Aug-2020