P R O C E E D I N G S
Open Access
QTLMAS 2009: simulated dataset
Albart Coster
1*, John W M Bastiaansen
1, Mario P L Calus
2, Chris Maliepaard
3, Marco C A M Bink
4From
13th European workshop on QTL mapping and marker assisted selection
Wageningen, The Netherlands. 20-21 April 2009
Abstract
Background:The simulation of the data for the QTLMAS 2009 Workshop is described. Objective was to simulate observations from a growth curve which was influenced by a number of QTL.
Results:The data consisted of markers, phenotypes and pedigree. Genotypes of 453 markers, distributed over 5 chromosomes of 1 Morgan each, were simulated for 2,025 individuals. From those, 25 individuals were parents of the other 2,000 individuals. The 25 parents were genetically related. Phenotypes were simulated according to a logistic growth curve and were made available for 1,000 of the 2,000 offspring individuals. The logistic growth curve was specified by three parameters. Each parameter was influenced by six Quantitative Trait Loci (QTL), positioned at the five chromosomes. For each parameter, one QTL had a large effect and five QTL had small effects. Variance of large QTL was five times the variance of small QTL. Simulated data was made available at http://www.qtlmas2009.wur.nl/UK/Dataset/.
Background
In this article, we describe the simulation and the result-ing data for the QTLMAS (Quantitative Trait Loci map-ping and Marker Assisted Selection) Workshop 2009. An objective of the Workshop was to compare methods for detection of Quantitative Trait Loci (QTL) and methods for calculating breeding values with markers distributed over the whole genome, MEBV. The data represented measurements of a time-dependent trait, influenced by QTL, which could represent body mass of growing animals or biomass accumulated during growth of a crop.
The data consisted of phenotypes, biallelic single nucleotide polymorphism (SNP) genotypes, and family information. Phenotypes were simulated and made avail-able for a subset of the simulated individuals at five dif-ferent time points along the growth trajectory. SNP were distributed over the whole simulated genome. Some SNP were in linkage disequilibrium (LD) with QTL, but QTL information was not provided in the dataset. SNP genotypes were made available for the phe-notyped and for the non phephe-notyped individuals.
Simulated individuals were genetically related due to the small number of parents used. Data was made available at http://www.qtlmas2009.wur.nl/UK/Dataset/. The simulated dataset is available to be used as benchmark for methods that attempt to model QTL or breeding values related to growth functions.
Simulation method
Simulated genomes consisted of five chromosomes of 1 Morgan each. At each Morgan, 10,000 loci were simu-lated. In the base population, allele frequency of 2,000 loci, equally distributed over the five chromosomes, was set at 0.5 and the remaining 48,000 loci were mono-morphic in the base population. Fifty gametes were simulated for the base population according to these allele frequencies and these gametes were randomly combined into 25 genotypes.
Then, a thousand generations were simulated to create Linkage Disequilibrium (LD) between loci and to achieve a situation of mutation drift equilibrium. Two meioses were simulated for each genotype in a previous generation to maintain an effective population size of 49 [1]. Genotypes for the next generation were formed by combining random pairs of these gametes, while avoid-ing selfavoid-ing.
* Correspondence: [email protected]
1Animal Breeding and Genomics Centre, Wageningen University, Wageningen, The Netherlands
The total number of recombinations in each meiosis event was drawn from a Poisson(5) distribution and recombination positions were distributed over the whole genome without interference. Throughout the 1,000 generations, mutation rate for all loci was 1 · 10-5, regardless of whether a mutation had occurred pre-viously at this locus or not. A mutation did always reverse the allele: mutation of a 1 allele produced a 0 allele and mutation of a 0 allele produced a 1 allele.
Gametes in generation 1,001 were combined into 25 genotypes (combinations were random, selfing was avoided). From these 25 genotypes, 20 genotypes were regarded asfemales and 5 genotypes were regarded as males. For generation 1,002, a hundred full sib families were simulated by combining each female with each male. Each full sib family consisted of 20 offspring in generation 1,002. Figure 1 is a graphical representation of the mating structure used for simulating this last gen-eration. Mutation rate was set at 0 during simulation of this last generation to avoid a large number of markers with very low Minor Allele Frequency (MAF).
Eighteen QTL were assigned to loci with MAF above 0.10 in generation 1,001. Additive effects for each QTL were calculated according to the variance required for that QTL and the allele frequency of that locus [2]. Var-iance of three QTL was set five times larger than var-iance of the remaining 15 QTL. Loci polymorphic in generation 1,001 to which no QTL was assigned became biallelic markers.
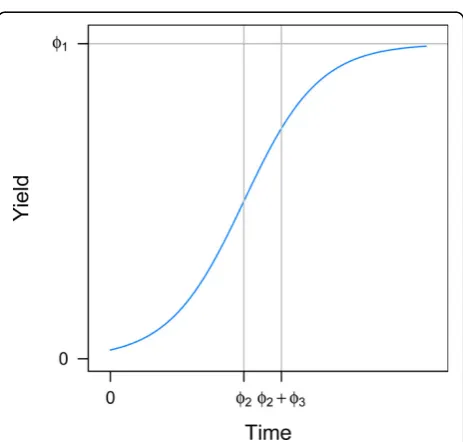
The simulated phenotype was yield (y), measured at five moments (t). Yield could represent weight during the growth of an animal or biomass during the growth of a crop. Yield at time t, y(t),was simulated according to a logistic growth curve:
y t
t
( )
( ) / ,
13 3
1 exp (1)
whereØ1 is the asymptotic yield,Ø2 is the inflection
point of the curve and Ø3 is the slope of the curve.
Figure 2 displays a growth curve and includes a graphi-cal interpretation of the three parameters.
One large and five small QTL were assigned to each of the threeØparameters. Simulated genetic value for each parameter was calculated as the sum of the additive effects of the QTL contributing to that parameter in each indivi-dual and2 was the additive genetic variance of parameter Ø. Random normal deviates from a N(0,2) distribution were added to genetic values of each parameterØ. to simulate a heritability of 50%. Phenotypic observations at five moments in time were simulated and made available for participants of the Workshop. Phenotypes were calcu-lated using the simucalcu-lated phenotypic values for parameters Ø1,2,3of each individual. A random normal deviate from a
N(0,10-4yi(t)) distribution was added to observationyi(t) to simulate a small observation error.
simulated. Each full sib family consisted of 20 individuals.
Simulations were performed with HaploSim [3], a package forR[4].
Simulation results
There were 453 polymorphic markers in the data, dis-tributed over the genome. Average MAF of these poly-morphic markers was 0.14 and average LD between flanking markers measured as r2was 0.14. The fraction of QTL variance explained by the 10 markers in highest LD with each QTL was 0.83.
The three large QTL for parametersØ1,2,3,explaining
approximately 50% of the additive genetic variance of each parameter, were located on chromosome 1. The remaining five small QTL for the parameters, explaining approxi-mately 10% of the additive genetic variance of each para-meter, were located on the other four chromosomes (Figure 3).
Simulated heritability of the parameters Ø1,2,3 was
0.50, implying a correlation of 0 5. between breeding values and the phenotypic parameter. Correlation between breeding values for the parameters and yield
was lower than 0 5. and changed over time because
yield was calculated with the logistic growth function, were the simulated parameters were used as parameters of the growth function (Figure 4). This has implications for the effectiveness of methods that attempt to estimate QTL or breeding values if the time dependency of the observations is not taken into account. Without taking the time dependency into account, the optimal moment for estimating QTL or breeding values for parameters Ø1 andØ2 is at the end of the growing period whereas
the optimal moment for estimating QTL or breeding
values for parameterØ3is at the beginning of the
grow-ing period.
Discussion
Objective of this simulation was to provide time-depen-dent phenotypes and marker data to the participants of the QTLMAS 2009 Workshop. Population size of 50 was used to fit with estimated population sizes of some common crop species. The density of polymorphic mar-kers was much lower than currently assumed appropri-ate for genomic selection purposes [5,6], and was aimed not to impede other types of analysis. Simulations were performed in Rusing packageHaploSim. Integration
of simulations in a computation environment as R
Figure 3Variance of QTLfor the three parameters at specific locations on the genome q2, expressed as fraction of the total genetic variance
G2.
allele frequency of 2,000 loci was set at 0.5 in the base population. The number of generations of random mat-ing required before reachmat-ing mutation drift equilibrium would be importantly higher if all loci were mono-morphic in the base generation. On the other hand, set-ting allele frequency of all loci at 0.5 was not practical because computation time ofHaploSim increases with the number of polymorphic loci.
Mutation rate was 1 · 10-5throughout the generations of random mating and this was justified as follows. In our simulations, loci correspond to base pairs. As an approximation, one centimorgan corresponds to 1 · 106 base pairs [7]; one locus in our simulations thus corre-sponds to 1 · 104base pairs. Estimates for mutation rates in human are in the range 1 · 10-8- 1 · 10-7[8,9]. Mutation rate in our simulations was therefore a factor 10 to 100 lower than base pair mutation rate estimated in human, with the objective to maintain a relatively low number of heterozygous SNP loci (equation 7.2.4, page 323, [1]). Mutation rate was set to 0 after generation 1,001 to avoid a large number of SNP with MAF equal to 1/4,000 (4,000 haplotypes were simulated for generation 1,002).
Phenotype data were calculated according to a logistic growth curve. A correct identification of this growth curve is expected to be crucial for successful identifica-tion of QTL involved in the simulated phenotypes. Con-clusions about QTL position and QTL effect can be expected to be dependent upon this identification method [10]. This issue is further discussed in [11], in this issue.
Only additive QTL effects were simulated because methodology for QTL analyses with response curves is still limited (e.g. [10,12-18]). Simulations could easily be extended to scenarios involving dominance or epistatic interactions, however the objective of this Workshop was to look at the impact of having a time dependent trait on QTL mapping and estimation of breeding values and we did not want to mix complications of variable nature.
Remarks
The code used to simulate the data can be obtained
from the authors. Package HaploSim can be
down-loaded from the repository of R packages CRAN,
Animal Breeding and Genomics Centre, Wageningen University, Wageningen, The Netherlands.2Animal Breeding and Genomics Centre, Wageningen UR Livestock Research, Lelystad, The Netherlands.3Plant Breeding, Wageningen University, Wageningen, The Netherlands.4Biometris, Plant Research International, Wageningen, The Netherlands.
Authors’contributions
AC programmed the simulation, performed the analyses and wrote the manuscript. AC and JB wrote the simulation packageHaploSim. CM, JB, MB, and MC were involved in the design of the simulation, in the evaluations of the results and in critically commenting the manuscript.
Competing interests
Authors declare no competing interests.
Published: 31 March 2010
References
1. Crow JF, Kimura M:AN INTRODUCTION TO POPULATION GENETICS THEORY.Alpha Editions1970.
2. Falconer DS, Mackay TFC:Quantitative Genetics.Pearson Education Limited 1996.
3. Coster A, Bastiaansen J:HaploSim:HaploSim.2009, [R package version 1.8].
4. R Development Core Team:R: A Language and Environment for Statistical Computing.R Foundation for Statistical Computing 3-900051-07-0 2009.
5. Calus MPL, Meuwissen THE, de Roos APW, Veerkamp RF:Accuracy of Genomic Selection Using Different Methods to Define Haplotypes.
Genetics2008,178:553-561.
6. Goddard M, Hayes B:Mapping genes for complex traits in domestic animals and their use in breeding programmes.Nat Rev Genet2009,
10(6):381-391.
7. Kong A, Gudbjartsson D, Sainz J, Jonsdottir G, Gudjonsson S, Richardsson B, Sigurdardottir S, Barnard J, Hallbeck B, Masson G, Palsson ST, Frigge ML, Thorgeirsson TE, Gulcher JR, Stefansson K:A high-resolution recombination map of the human genome.Nat Genet2002,
31(3):241-247.
8. Nachman M, Crowell S:Estimate of the mutation rate per nucleotide in humans. Genetics2000,156:297-304.
9. Drake J, Charlesworth B, Charlesworth D, Crow J:Rates of spontaneous mutation.Genetics1998,148(4):1667-1686.
10. Malosetti M, Visser R, Celis-Gamboa C, van Eeuwijk F:QTL methodology for response curves on the basis of non-linear mixed models, with an illustration to senescence in potato.Theor Appl Genet2006,
113(2):288-300.
11. Maliepaard C, Bastiaansen J, Calus M, Coster A, Bink M:Comparison of analyses of the QTLMAS XIII common dataset. II: QTL analysis.BMC Proceedings2010,4(Suppl 1):S2.
12. Ma C, Casella G, Wu R:Functional Mapping of Quantitative Trait Loci Underlying the Character Process A Theoretical Framework.Genetics 2002,161(4):1751-1762.
13. Wu R, Ma C, Chang M, Littell R, Wu S, Yin T, Huang M, Wang M, Casella G:
A logistic mixture model for characterizing genetic determinants causing differentiation in growth trajectories.Genet Res2002,
79(03):235-245.
15. Wu R, Ma C, Yang M, Chang M, Littell R, Santra U, Wu S, Yin T, Huang M, Wang M,et al:Quantitative trait loci for growth trajectories in Populus.
Genet Res2003,81(01):51-64.
16. Wu R, Ma C, Zhao W, Casella G:Functional mapping for quantitative trait loci governing growth rates: a parametric model.Physiol Genomics2003,
14(3):241.
17. Macgregor S, Knott SA, White I, Visscher PM:Quantitative Trait Locus Analysis of Longitudinal Quantitative Trait Data in Complex Pedigrees.
Genetics2005,171(3):1365-1376.
18. Wu R, Ma CX, Hou W, Corva P, Medrano JF:Functional Mapping of Quantitative Trait Loci That Interact With the hg Mutation to Regulate Growth Trajectories in Mice.Genetics2005,171:239-249.
doi:10.1186/1753-6561-4-S1-S3
Cite this article as:Costeret al.:QTLMAS 2009: simulated dataset.BMC Proceedings20104(Suppl 1):S3.
Submit your next manuscript to BioMed Central and take full advantage of:
• Convenient online submission
• Thorough peer review
• No space constraints or color figure charges
• Immediate publication on acceptance
• Inclusion in PubMed, CAS, Scopus and Google Scholar
• Research which is freely available for redistribution