441 |
P a g e
MORPHOMETRIC ANALYSIS OF KOSI RIVER SUB
WATERSHED IN RAMNAGAR, UTTARAKHAND
USING GIS AND REMOTE SENSING TECHNIQUES
Saif Said
Associate Professor, Civil Engineering Department, Aligarh Muslim University, Aligarh (UP)
ABSTRACT
Evaluation of morphometric characteristics of watershed is the fundamental requirement for sustainable planning and development of its resources. Quantitative morphometric characteristics (viz. linear, relief and aerial) of Kosi river sub watershed in Ramnagar, Uttarakhand are evaluated by utilizing Cartosat-1 Digital Elevation Model (Carto DEM) with 30 meter resolution downloaded from BHUVAN (ISRO’S GEOPORTAL) using Arc Hydro tools in Arc GIS 9.3 software. Drainage map of the study area prepared reveals a dendritic drainage pattern with sixth order stream network comprising of a total of 315 numbers of streams. The length of the major sixth order stream of the sub watershed is 4.78 km. The average bifurcation ratio of the basin is 3.2 which is indicative of the fact that the drainage pattern is not influenced by the geological evolutions and disturbances in the recent past. The drainage density of 1.15 km/km2 indicates impermeable subsoil material with dense vegetative cover and moderate mountainous relief with low infiltration. The elongation ratio of 0.62 infers that the basin is closer to a circular shape. In all, a total of 21 morphometric parameters including all
aspects of the sub watershed have been evaluated and discussed in the present study. Hence, the study concludes
that GIS techniques prove to be a competent tool in morphometric analysis which is further useful for planning rainwater harvesting and watershed management.
Keywords: Morphometric analysis, Drainage characteristics, GIS and Remote Sensing, Aerial, Linear, Relief aspects
I. INTRODUCTION
Watershed morphometric analysis provides the necessary parameters for the assessment of the ground water
potential zones, identification of areas for implementation of water harvesting structures, water resource
planning and management, surface runoff characteristics of the drainage system etc. In other words,
morphometric analysis of a watershed provides a quantitative description of the drainage system, which is an
important aspect for the characterization of watersheds through the measurement and mathematical analysis of
the configuration of the earth's surface, shape, dimension of its landforms ([1],[2]). Morphometric analysis
requires measurement of linear features, aerial aspects and gradient of channel network of the drainage basin
442 |
P a g e
Watershed characterisation for drainage networks can be achieved using traditional methods such as field
observations and topographic maps or alternatively with advanced techniques using remote sensing and GIS
([4], [5]). In conventional methods, it is very tedious to evaluate the entire drainage network of the watershed
from field observations due to their extent throughout the undulating terrain dispersed over vast areas.
Morphometric analysis of many river basins and sub basins in different parts of the globe has been studied using
conventional methods ([6]). However GIS technique has emerged as a potential tool in recent years for
conveniently evaluating drainage characteristics. In Indian perspective, some of the recent studies on
morphometric analysis using remote sensing and GIS technique have been carried out by Nautiyal ([3]),
Srivastava ([7]), Nag ([8]), Kumar et al. ([9]), Mittal ([10]), Pareta ([11]), Srinivasa et al. ([12]) and Chopra et al. ([13]). More recently, Sharma et al. ([14]), Shakil ([15]), Magesh et al. ([16]) to name a few. Evaluation of morphometric parameters necessitates the analysis of various drainage parameters such as ordering of various
streams, measurement of basin area and perimeter, length of drainage channels, drainage density, stream
frequency, bifurcation ratio, basin relief and ruggedness number. In the present study, the remote sensing and
GIS techniques have been implemented to work out the detailed quantitative analysis of morphometric
parameters of Kosi river basin in the Ramnagar district, Uttarakhand and inferences are drawn to assess the
behaviour of the study region towards varying climatic, hydrologic and lithological conditions.
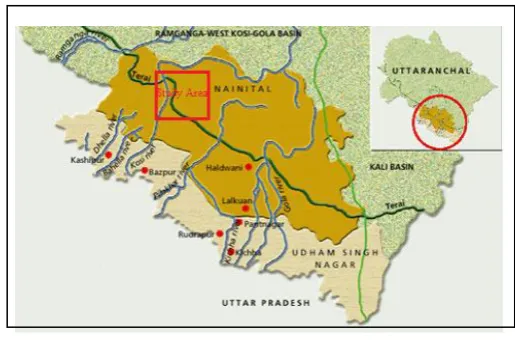
II. STUDY AREA
The kosi river catchment flowing through Ramnagar district of Uttarakhand state having an area of 1050 sq km
and partially covering the forest area of Jim Corbet National Park has been selected as the study area as shown
in Fig 1.
Fig. 1 Location of the Kosi river catchment with square box indicating the study area.
Kosi river originates from village Budha Peenath of Kausani region of district Almora, Uttarakhand. After
traveling a distance of about 100 km in lower Himalayas with higher velocity, it emerges at Ramnagar district
443 |
P a g e
famous rice-belt area of Kashipur, where a number of polluting industries discharge their highly polluted
effluent into it. The study area is located between the longitude 79°10' to 79°38' N and latitude 29°32’ to 29°50’
E. Despite several geo-environmental constraints, the catchment has not escaped anthropogenic impacts, which
continue to multiply with increasing pressure of population. The environmental impacts of the resource
development process are therefore, of special significance in this ecologically sensitive mountain region where
the steepness of slope and high rainfall, increases the susceptibility of the region to a variety of environmental
hazards and natural risks. The terrain of the study area is hilly and undulating consisting of a number of ridges
and valleys. The general climate of the area is tropical with four distinct seasons i.e. summer, monsoon
post-monsoon and winter. May and June are the hottest months with day temperature rising as high as 430 C. The
average annual rainfall in the area is 250 mm but, there is very high variability of rainfall within the area. The
altitude of study area ranges from 300 m in southern part to 1205 m in north-eastern part.
III. METHODOLOGY
Quantitative morphometric analysis has been carried out by integrating remote Sensing data and GIS tools and
correlating the basin characteristics with basin hydrology. Cartosat-1 Digital Elevation Model (Carto DEM) of
October 2012 with 30 meter resolution downloaded in four tiles from BHUVAN (ISRO’S web GEOPORTAL)
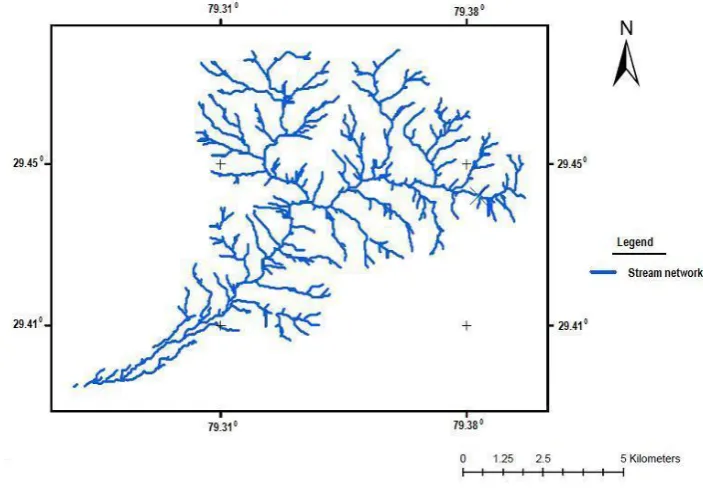
has been processed using Arc Hydro tools in Arc GIS 9.3 software. Subset image or sub watershed pertaining to
the study area has been delineated which is then processed for the generation of flow direction, flow
accumulation and finally drainage network map (Fig. 2) for evaluation and interpretation of the basin as well as
stream characteristics. Basin perimeter and area are calculated and cross checked from the online measurement
tool and satellite imagery available on Bhuvan webpage by overlaying the shape file of the study area.
444 |
P a g e
IV. RESULTS AND DISCUSSION
The first step in the quantitative analysis of drainage basin is the designation of stream order to the drainage
network. The term “stream order” is a measure of the position of a stream in the hierarchy of tributaries. In the
present study, the channel segments are being ranked according to Strahler’s stream ordering system i.e. the 1st
order streams are the one having no tributaries. The 2nd order streams have tributaries only of 1st order streams,
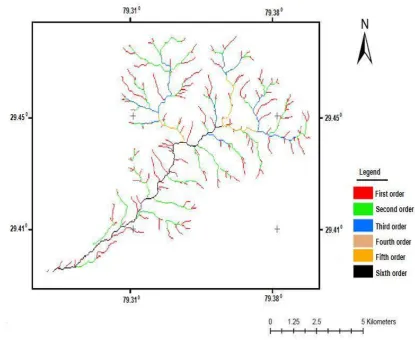
where two 2nd order channels join a segment of 3rd order and so on. From the drainage map of the study area, a
dendritic drainage pattern is identified with sixth order stream network as shown in Fig. 3.
Fig. 3 Pattern of stream ordering of the study area (Kosi river sub watershed).
In all 21 morphometric parameters are computed in the present study which include linear, aerial and relief
parameters such as stream order, stream length, bifurcation ratio, drainage density, stream frequency, form
factor, circulatory ratio, elongation ratio, relief ratio and ruggedness number etc . The input parameters for the
present study such as area, perimeter, elevation, stream length etc. are obtained from digitized coverage of
445 |
P a g e
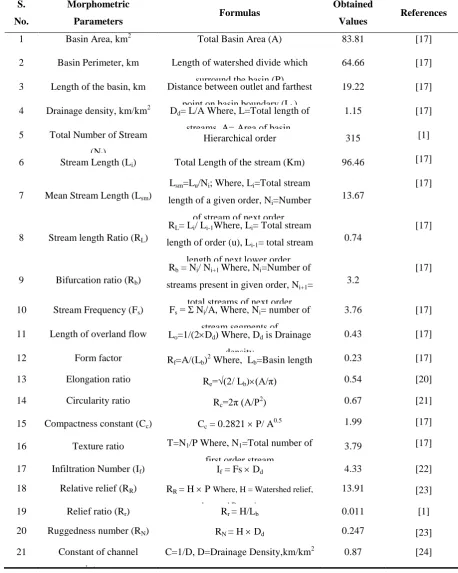
Table 1. Morphometric parameters of Kosi river basin
S.
No.
Morphometric
Parameters Formulas
Obtained
Values References
1 Basin Area, km2 Total Basin Area (A) 83.81 [17]
2 Basin Perimeter, km Length of watershed divide which
surround the basin (P)
64.66 [17]
3 Length of the basin, km Distance between outlet and farthest
point on basin boundary (Lb)
19.22 [17]
4 Drainage density, km/km2 Dd= L/A Where, L=Total length of
streams, A= Area of basin.
1.15 [17]
5 Total Number of Stream
(Ni)
Hierarchical order 315 [1]
6 Stream Length (Li) Total Length of the stream (Km) 96.46 [17]
7 Mean Stream Length (Lsm)
Lsm=Lu/Ni; Where, Li=Total stream
length of a given order, Ni=Number
of stream of next order.
13.67
[17]
8 Stream length Ratio (RL)
RL= Li/ Li-1Where, Li= Total stream
length of order (u), Li-1= total stream
length of next lower order.
0.74
[17]
9 Bifurcation ratio (Rb)
Rb = Ni/ Ni+1 Where, Ni=Number of
streams present in given order, Ni+1=
total streams of next order
3.2
[17]
10 Stream Frequency (Fs) Fs = Σ Ni/A, Where, Ni= number of
stream segments of
all order
3.76 [17]
11 Length of overland flow Lo=1/(2Dd) Where, Dd is Drainage
density
0.43 [17]
12 Form factor Rf=A/(Lb)2 Where, L
b=Basin length 0.23 [17]
13 Elongation ratio Re=√(2/ Lb)(A/π) 0.54 [20]
14 Circularity ratio Rc=2π (A/P2) 0.67 [21]
15 Compactness constant (Cc) Cc = 0.2821 P/ A0.5 1.99 [17]
16 Texture ratio T=N1/P Where, N1=Total number of
first order stream
3.79 [17]
17 Infiltration Number (If) If = Fs Dd 4.33 [22]
18 Relative relief (RR) RR = H P Where, H = Watershed relief,
km; and P= perimeter.
13.91 [23]
19 Relief ratio (Rr) Rr = H/Lb 0.011 [1]
20 Ruggedness number (RN) RN = H Dd 0.247 [23]
21 Constant of channel
maintenance
C=1/D, D=Drainage Density,km/km2 0.87 [24]
446 |
P a g e
4.1 Linear aspects of the study area
The linear aspects of a channel system deal with the quantitative analysis of landform in a watershed area, where
the surface runoff flowing over a long period of time tends to modify the surface geometry of the area (Horton,
[17]). Linear aspects of channel system include plani-metric measurements that are projected upon a horizontal
datum plane and are discussed in the subsequent sections.
Stream ordering in accordance to Strahler ([1]) is allocated to the drainage network map which revealed the
stream network of the study area to be of sixth order. The total number of first order streams are evaluated as
245, 49 second order streams, 14 third order streams, 4 fourth order streams, 2 fifth order and 1 sixth order
stream. The computed value of the mean bifurcation ratio for the present basin is found to be 3.2 which is fairly
high and indicates that the drainage pattern is not influenced by the geological conditions.
To obtain the mean length of channel Li of order i, the total length of streams of that order is divided by the
number of streams Ni of the same order. The total length tends to decrease with the increase of stream order,
while the mean length tends to increase with the increase in stream order. The total length of the first, second,
third, fourth, fifth and sixth order streams are 49.57 km, 12.68 km, 7.91 km, 11.61 km, 9.91 km and 4.78 km,
respectively. The mean length of the streams from lower to higher order is obtained as 0.202 km, 0.259 km,
0.565 km, 2.91 km, 4.955 km and 4,781 km, respectively. Results indicate that the total length of stream
increases with decrease of the stream order and average length of the stream increases with increase in the
stream order.
The length of overland flow affects both the hydrologic and physiographic development of drainage basins
(Horton, [17]). During the evolution of the drainage system, length of overland flow is adjusted to a magnitude
appropriate to the scale of the first order drainage basins and is approximately equal to one half the reciprocal of
the drainage density. The shorter the length of overland flow, the quicker the surface runoff from the streams.
The length of overland flow for the present study area is 0.43 km and is associated with moderate runoff and
fairly high infiltration.
4.2 Areal aspects of the study area
Areal aspects of drainage basin include measurement of areal elements such as basin, area, basin length, basin
perimeter, shape, drainage density, constant of channel maintenance, stream frequency, form factor, circulatory
ratio, elongation ratio, compactness constant, Infiltration Number, and texture ratio in a systematic way and are
illustrated in Table 1. The total area of the basin selected under the present study is 83.81 km2, whereas the basin
perimeter computed is 64.66 km. The values of form factor (Rf), circulatory ratio (Rc) and elongation ratio (Re)
are 0.23, 0.67 and 0.54 respectively. The high value of circulatory ratio as compared to the elongation ratio
indicates that the study area is approaching towards the circulatory shape (Singh et al., [18]). Also, the low value of form factor signifies that the watershed has a shorter lag time and a higher peak flow. Flood peaks of
447 |
P a g e
The drainage density is an indicator of quantitative measure of the average length of stream channel to the area
of the watershed and therefore, provides at least some indication of the drainage efficiency of the basin. Further,
it gives an idea about the physiographical properties of the underlying soils. Low value of drainage density Dd is
an indication of the region having permeable subsoil material under vegetative cover and it also indicates the
watershed has low relief (Strahler, [1]). The drainage density of the study basin is 1.15 km/km2 which is low and
indicates that the area has highly resistant or highly permeable sub-soil material. The constant of channel
maintenance which is indicative area of the basin surface needed to sustain unit length of stream channel was
found to be 0.87 sq km/ km for the study area which is an indication of the number of square km of basin area
required to sustain one linear kilometre of channel.
Horton ([17]) defines drainage texture or texture ratio as the total number of segments of all order per perimeter
of that area. Schumm ([20]) classified drainage density into five different textures. The drainage density less
than 2 indicates very coarse, between 2 and 4 is related to coarse, between 4 and 6 is moderate, between 6 and 8
is fine and greater than 8 is very fine drainage. On the basis of this classification, the texture ratio (Rt) for Kosi
basin study area is computed as 3.79, which falls under coarse to very coarse drainage texture. The compactness
coefficient is independent of size of watershed and dependent only on the slope. The compactness coefficient of
the study area is 1.99.
4.3 Relief aspects of the study area
Relief aspects are an important factor in understanding the extent of denudational process undergone within the
watershed and an indicator of flow direction of runoff. The relief (H) of the study area is 215 m from which
Relative relief (RR), Relief ratio (Rr) and Ruggedness number (RN) are calculated as 13.91, 0.011 and 0.247
respectively, thereby indicating the relief of the study area having moderate slope. Also, the low ruggedness
value of the area reflects that it is less prone to soil erosion and comprises of moderate to thick vegetal cover.
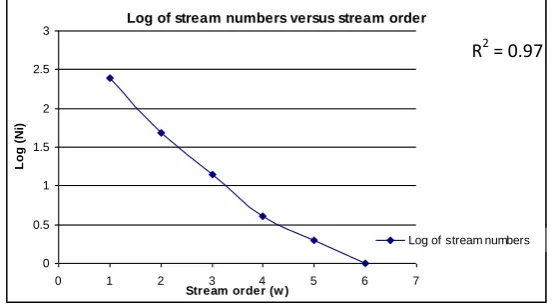
Plot of logarithm of number of streams against stream order is plotted as shown in Fig. 4, which reveals a linear
relationship having R2 = 0.974, satisfying the Horton’s law i.e. the number of streams decreases in geometric
progression as the stream order increases.
Log of stream numbers versus stream order
0 0.5 1 1.5 2 2.5 3
0 1 2 3 4 5 6 7
Stream order (w )
L
o
g
(
N
i)
Log of stream numbers
Fig. 4 Plot between stream order and logarithm of stream number.
448 |
P a g e
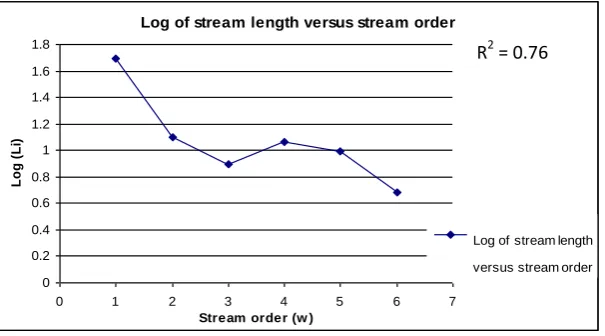
Also, a plot of logarithm of stream length versus stream order is plotted which again reveals a linear relationship
as shown in Fig. 5, with R2 = 0.76, thereby indicating the existence of geometric progression between stream
length and stream order as per Horton ([17]).
Log of stream length versus stream order
0 0.2 0.4 0.6 0.8 1 1.2 1.4 1.6 1.8
0 1 2 3 4 5 6 7
Stream order (w )
L
o
g
(
L
i)
Log of stream length
versus stream order
Fig. 5 Plot between stream order and logarithm of stream length
.
V. CONCLUSIONS
Quantitative analysis of morphometric parameters of Kosi river sub watershed has been car ried out using
CartoSat-1 DEM in GIS framework. Results from the analysis indicates that the shape of the sub watershed
approaches towards circulatory and having low drainage density, moderate relief ratio and fairly high infiltration
rate. The bifurcation ratio lying within the range of 3.0 to 6.0 (i.e. Rb = 3.2 for the present study) infers that the
study area has suffered less geological disturbance. Also, the low ruggedness value of the area (viz. 0.247)
reflects that it is less prone to soil erosion and comprises of moderate to thick vegetal cover with moderate land
gradient. Plots of stream order versus stream number and stream length indicates the existence of geometric
progression thereby satisfying Horton’s law of stream numbers and lengths respectively. Results reported in the
study shall further be useful in developing functional relationships between morphometric parameters and
hydrological variables. Similar studies in conjunction with high resolution satellite data help in better
understanding the landforms and their processes and drainage pattern demarcations for watershed level planning
and management and efficiently installing rain water harvesting systems.
REFERENCES
[1] Strahler, A. N. (1964). Quantitative geomorphology of drainage basin and Channel networks. Hand book of applied hydrology, McGraw Hill, New York, section 4 -11.
[2] Clarke J. J. (1966). Morphometry from map, Essays in geomorphology. Elsevier Publishing Company, New York, 235-274.
449 |
P a g e
[3] Nautiyal, M. D. (1994). Morphometric analysis of drainage basin using aerial photographs, a case study
of Khairkuli basin, District Dehradun.U.P. J. Indian Soc. Remote Sensing, 22(4), 251-261.
[4] Macka, Z. (2001). Determination of texture of topography from large scale contour maps. Geografski Vestnik, 73(2), 53–62.
[5] Sreedevi, P. D., Owais, S., Khan, H. H. and Ahmed, S. (2009). Morphometric Analysis of a Watershed
of South India Using SRTM Data and GIS. J. Geol. Soc. India, 73, 543-552.
[6] Krishnamurthy, J., Srinivas, G., Jayaram, V., Chandrasekhar, M. G., (1996). Influence of rock types
and structures in the development of drainage networks in typical hardrock terrain. ITC J.,3(4), 252– 259.
[7] Srivastava, V. K. (1997). Study of drainage pattern of Jharia coal field (Bihar), India, through remote
sensing technology. J. IndianSoc. Remote Sensing, 25(1), 41–46.
[8] Nag, S. K., (1998). Morphometric analysis using remote sensing techniques in the Chaka sub-basin,
Purulia district, West Bengal. J Indian Soc. Remote Sensing, 26(1&2), 69–76.
[9] Kumar, R., Kumar, S., Lohni, A.K., Neema, R.K. and Singh, A.D., (2000). Evaluation of
geomorphological characteristics of a catchment using GIS. GIS India, 9 (3), 13-17.
[10] Mittal, H. K., (2002). An evaluatory study on morphological characteristics and groundwater status in
selected treated watersheds. Unpublished Ph.D Thesis, Maharanapratap University of Agriculture Technology, Udaipur, (India).
[11] Pareta, K. (2004). Hydro-Geomorphology of Sagar District (M.P.): A Study through Remote Sensing
Technique. Proceeding in XIX M. P. Young Scientist Congress, Madhya Pradesh Council of Science & Technology (MAPCOST), Bhopal.
[12] Srinivasa, V. S., Govindainah, S. and Home Gowda H., (2004). Morphometric analysis of
sub-watersheds in the Pavagada area of Tumkur district South India using remote sensing and GIS
techniques. J. Indian Soc. Remote Sensing, 32(4), 351–362.
[13] Chopra, R., Raman Deep Dhiman and Sharma, P. K., (2005). Morphometric analysis of
sub-watersheds in Gurudaspur district, Punjab using remote sensing and GIS techniques. J. Indian Soc. Remote Sensing, 33(4), 531–539.
[14] Sharma, S.K., Rajput,G.S., Tignath, S. and Pandey, R. P., (2010). Morphometric analysis and
prioritization of a watershed using GIS. J. Indian Water Resources Soc., 30 (2), 33-39.
[15] Shakil A. (2012). Geoinformatics for assessing the morphometric control on hydrological response at
watershed scale in the Upper Indus Basin. Journal of Earth Syst. Sci., 121(3), 659–686.
[16] Magesh N S, Jitheshlal K V and Chandrasekar N. (2013). Geographical information system-based
450 |
P a g e
[17] Horton R E. (1945). Erosional development of streams and their drainage basins: Quantitative
Morphology, Bull Geological Society of America,56, 275 361.
[18] Singh, R. K., Bhatt, C. M. and Hari Prasad, V., (2003). Morphological study of a watershed using
remote sensing and GIS techniques. Journal of Hydrology, 26(1-2), 55-66.
[19] Pandey, A., Chowdary, V. M. and Mal, B. C., (2004). Morphological analysis and watershed
management using GIS. Journal of Hydrology, 27(3-4), 71-84.
[20] Schumm, S. A., (1954). Evoluation of Drainage Systems and Slopes in ad Lands at Parth Ambo, New
Jersy, Bull. Geol. Soc. Am., 67, 597-646.
[21] Miller, V. C. (1953). A Quantitative Geomorphic Study of Drainage Basin Characteristics in the
Clinch Mountain area, Virginia and Tennessee, Project NR 389-402, Tech Rep 3, Columbia University,
Department of Geology, ONR, New York.
[22] Faniran, A (1968). The Index of Drainage Intensity - A Provisional New Drainage Factor. Australian Journal of Science, 31, 328-330.
[23] Melton M. A. (1957). An analysis of the relations among Elements of Climate, Surface Properties and
Geomorphology, Project NR 389042, Tech. Rep. 11, Columbia University.