Journal of
RANGE
MANAGEM
Volume 10, Number 5 September, 1957
ENT
Reproduction and Life Span of Some
Perennial Grasses of Southern Arizona
R. H. CANFIELD’
Ramp Conservatiolaist, Rocky Mountain. Forest and Range Ezpperiment Station, Forest Seruice, U. S. Department of Aoricultwe, Colorado A alld M College, Fort Collilzs,
Reproduction and longevity are important measures of the depend- ability of a range forage grass. In- formation on these characteristics of the principal forage grasses helps in planning management for native perennial grass ranges.
An unusual opportunity for eval- uating some life history character- istics of several important peren- nial grasses of the semi-desert grassland type of southern Arizona was offered by a 17-year eharto- graph record on the Santa Rita Experimental Range, a unit of the Rocky Mountain Forest and Range Experiment Station, located about 35 miles south of Tucson, Arizona. Detailed measurements and chart records were kept of individual plants, which permitted the deter- mination of longevity and repro- dnctive rate.
Procedure and Methods Meter-square quadrats u~re es- tablished at numerous sites on rangelands subject to yearlong grazing. Quadrat locations were representative of a great variety
of soils and plant compositions. Approximately half of the quad- rats were protected from grazing by permanent panel exclosures. The grazed quadrats were subjected to wide differences in utilization be- cause they raried in distance to
water, slope, accessibility, and other factors. No record of the grazing history of individual quadrats was maintained.
Early ehartings of quadrats were made by hand tracings. Later the “Hill Chartograph” was used to save time, to increase accuracy of mapping, and to establish the loea- tion of individual plants. This in- strument traces the perimeters of individual grass clumps and is based on the principle of the pan- tograph commonly used by drafts- men in duplicating maps.
200
studied until they disappeared. Only those plants that began and completed their lives during the period of charting were included in the calculations of life span and mortality. In spite of the elimina- tion of many plants with incom- plete records, about 48,000 plants with complete records remained for analysis.
The perennial grasses studied in- cluded black grama (Bouteloua etiopoda), hairy grama (B. hir- suta), side-oats grama (B. curti- pendula), A r i z o n a cottongrass (Trichachae californica) , m e s a threeawn (Aristida hamulosa) , tanglehead (HeteropogoN contort- us), Texas timothy (Lyczcrus phle- oides), Rothrock grama (B. roth- rockii), slender grama (B. j&for- mis), sprucetop grama (B. chon- drosbides) , and curlymesquite
(Hilatia belangeri).
Each species did not occur on every quadrat, and the interaction between species was not segregated. However, the data are representa- tive of wide variety of species’ in- teractions. Reactions of individual species must be considered in ref- ence to the general plant composi- tion. Responses of species growing in pure stands might be quite dif- f erent. Range managers of the desert grassland seek to maintain a diversity of perennial grasses; therefore, conclusion referred to the general plant composition are applicable.
The II grasses studied can be di- vided roughly into two groups des- ignated as “primary grasses” and “secondary g r a s s e s.” Primary grasses tend to predominate on lands that have been protected from grazing for a long period or that have been maintained in good condition by proper management. Species included in this group are black, hairy, and side-oats gramas, Arizona cottongrass, mesa three- awn, tanglehead, and Texas timo- thy. Secondary grasses are those that usually are more abundant on ranges or protected areas. This group includes Rothrock, slender, and sprucetop gramas, and curly- mesquite.
R. H. CANFIELD
Seedling Production
Seedling or set production is es- sential to the maintenance or in- crease of a species on the range. TO maintain a grass population, seed- ling ‘or set establishment must equal plant losses. Improvement in range condition is likewise de- pendent upon a favorable rate of seedling establishment of the bet- ter forage plants. Black grama and curlymesquite reproduce by sets from stolons; all other species re- produce from seed.
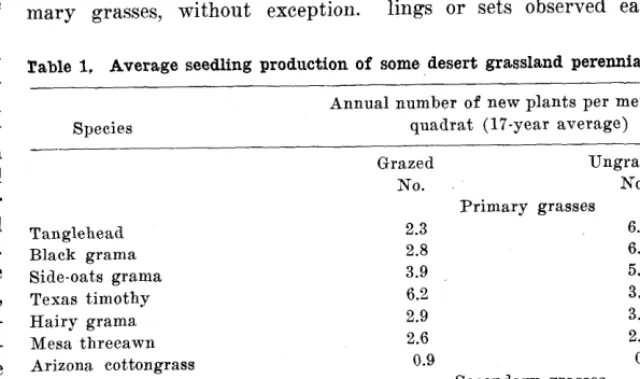
Some seedlings or sets of <every species studied were found each year. For example, average pro- duction on ungrazed black grama quadrats varied from 0.4 new plants per quadrat in the poorest year to 8.0 in the best year. Slen- der grama varied from 1.0 to 32.7 seedlings per quadrat under the poorest and best growing condi- tions, respectively. The number of seedlings produced, however, dif- fered by species. Secondary grass- es usually produced more seedlings than the primary grasses (Table 1). Rothrock grama, a heavy seed producer, produced the most seed- lings of any grass on both the grazed and ungrazed plots, fol- lowed closely by curlymesquite.
On grazed range, the average number of new plants per meter- square quadrat produced annually by secondary grasses exceeded pri- mary grasses, without exception.
In fact, the most prolific producer of the primary grasses, Texas tim- othy, produced an average annual number of seedlings which was only about one-half that of the least prolific secondary species, slender grama.
On ungrazed range there were some species exceptions to the gen- eral superiority of seedling pro- duction of the secondary grasses. Tanglehead and black grama both produced a slightly greater num- ber of new plants per unit area than did slender grama.
Arizona cottongrass produced the fewest seedlings of all species studied.
All secondary grasses studied produced more seedlings on grazed range than on ungrazed range. In contrast, primary grasses showed a variable response to grazing but tended to produce the most seed- lings when ungrazed. The average numbers of seedlings or sets per quadrat of hairy grama, tangle- head, black grama, and side-oats grama were all greater on ungrazed plots than on grazed range. Mesa threeawn and Arizona cottongrass produced a slightly greater num- ber of seedlings when grazed. Seed- ling production of Texas timothy was markedly greater under graz- ing. In this respect, the species tended to exhibit the characteris- tics of the secondary grasses.
Based on the number of seed- lings or sets observed each year,
Table 1, Average seedling production of some desert grassland perennial grasses. Annual number of new plants per meter-square
Species quadrat (17-year average)
Grazed Ungrazed
NO. No.
Primary grasses
Tanglehead 2.3 6.9
Black grama 2.8 6.4
Side-oats grama 3.9 5.0
Texas timothy 6.2 3.1
Hairy grama 2.9 3.1
Mesa threeawn 2.6 2.4
Arizona cottongrass 0.9 0.5
Secondary grasses
Rothrock grama 29.0 15.7
Curlymesquite 23.6 11.2
Sprucetop grama 12.6 7.8
REPRODUCTION AND LIFE SPAN OF PEREKNIAT, GRASSES 201
the reproduction potential of all the perennial grasses st,udied ap- pears adequate. Populations of these particular perennial grasses are apparently limited mostly by snrvival and longevity.
Seedling Survival
Mortality of seedlings and sets was highest before plants reached 1 year (Table 2). Of all species 011 811
quaam,
Bn average
of ollly about one-third survived the first grming season. Young plants were especially susceptible to dr?. ing winds and drought. Clipping of the tops by livestock or roots b? rodents killed many seedlings. Competition apparently was severe both with other seedlings and with stronger, more mature plants.Average percentage survival of seedlings was about the sam for primary and secondary species. However, there was considerable variation among different species, irrespective of group.
Among the secondary species, about the same proportion of Roth. rock grama and a greater percent- age of eurlymesquitc and
dellaer
grama
seedlings survived on grazed areas than on ungrazed areas. The reverse was true of sprucetop grama.With the exception of side-oats grama, seedling survival of prima- ry grasses was higher on ungrazed quadrats than on those open to
:razing. Mesa threeawn exhibited the greatest differential in seedling survival between grazed and nn- grawd conditions. Next in rank was hairy yrama, with about twice as many seedlings surviving under ungrazed conditions. Tanglehead had the lmwst rate of seedling SUI‘. +a1 and exhibited the least dif- frrrntial betmen grazed and um grazed conditions. This charaeter- istie combined with the low rate of
seedling production gives tangle- head the lowest reproductive po- tential among the perrnnial grasses studied. Although Arizona cotton- grass produced only few seedlings, its survival rate was relatively high, even under grazing.
Longevity
All the perennial grasses proved to be relatively short lived on the awragr, although individual spe- cies varied greatly RS to longevity
(Table 3). Black grama, Arizona cottongrass, mesa threeawn, and sprucetop g-rams. were among the most long lived. Some plants of black grama lived 14 years. Roth- rock grnma ras the shortest lived; no plant of this species lived longer than 3 years, where protected, or longer than 4 years, where grazed. Texas timothy, hairy grama, tan- glehead, and side-oats grama of the primary grass group and curly- mesquite of the secondary group also appear to be relatively short- lived.
t
202 R. H. CANFIELD
second growing seasons was very high. Exceptions were Arizona cottongrass, sprucetop grama, tan- glehead, and mesa threeawn. After the third year, mortality was fair- ly constant among all species until maximum age was reached. The primary grasses tended to be longer lived where protected from grazing than where grazed; whereas the opposite was true of the secondary grasses. An exception was Arizona cottongrass. This opposite reaction to grazing can be accounted for by differences in growth characteris- tics of the contrasted groups. The primary grasses are taller and have a greater percentage of leafage easily accessible for grazing by cat- tle. Moreover, they are ordinarily
intensively utilized. This higher percentage of utilization leads to less plant survival. On the other hand, most of the secondary grasses have short leaves and much of their foliage is at the base of the plant. As a result, a smaller proportion of the leafage can be readily grazed. All secondary grasses, except sprucetop grama, had a higher sur- vival rate throughout their life spans when grazed than when pro- tected from grazing. At 5 years of age, on the average, even this species falls into conformity with the other se?ondary grasses. With Rothrock grama, an extremely short-lived species for which sur- vival was only slightly greater for grazed plants in the seedling stage,
the difference in favor of grazing widened with age. The greater length of life apparently results both from Rothrock grama’s good resistance to grazing and to a les- sening of competition where the taller primary grasses were re- stricted by grazing.
Summary
A record of 17 years ‘of annual chartograph records on meter- square quadrats located on the Santa Rita Experimental Range provided a basis for studying life history characteristics of 11 com- mon perennial grasses of the desert grasslands of southern Arizona.
Seedling production, seedling survival, and longevity of grasses
Table 3. Survival of plants that originated on grazed and ungrazed quadrats. Species and
treatment 1 2 3
Age of plants by years
4 5 6 7 8 9 10 11 12 13 14 15
Percent survival Primary grasses Texas timothy
Grazed 15.7
Ungrazed 46.0 Hairy grama
Grazed 16.1
Ungrazed 58.9 Tanglehead
Grazed 4.1
Ungrazed 7.6
Mesa threeawn f
Grazed 15.5
Ungrazed 20.4 Black grama
Grazed 21.6
Ungrazed 24.3 Arizona Cottongrass
Grazed 25.7
Ungrazed 36.4 Side-oats grama
Grazed 34.6
Ungrazed 26.8
Rothrock grama Grazed Ungrazed Curlymesquite
Grazed Ungrazed Slender grama
Grazed Ungrazed Sprucetop grama
Grazed Ungrazed
7.5 3.5
15.8 10.0
12.6 5.9
30.4 47.5
4.2 3.0 0.6 0
27.3 22.7 13.6 9.1 9.1 0
9.7 4.6 44.7 31.2
2.8 1.6 5.2 2.8
1.8 0 20.6 10.6
0.4 0 1.1 0.7
0
0
9.5 5.9 3.1 2.5 19.9 ‘5.4 6.4 4.1
0.8 0.6 2.9 0.5
0.2 0.2
13.0 8.5 4.6 3.7 17.6 14.1 10.0 7.7
9.1
9.2
0.3
1.5 3.3
2.2 6.8
9.3 9.1
1.8 1.5
23.5 20.2 16.9 10.9 33.3 - 21.2 12.1
5.5 -
0.9 1.0
5.3 3.0
0.2 0.1 0 - 0.6 0.4
1.6 -
19.2 10.7
9.0
7.1
0
5.4 - - 5.3 0
Secondary grasses
2.4 0.8 0.3 0.8 0.2 0
0.1 0
7.0 3.0 1.2 0.6 0.4 0.3 2.2 0.6 0.3 0
0.2 0
6.7 4.1 2.1 1.0 0.5 0.2 - 2.2 1.1 0.3 0.3 0.1 0.1 0
0
24.8 21.6 16.1 12.2 10.2 6.6 4.2 2.5 43.3 42.6 26.0 12.0 9.1 0.8 0.3 0
- 0.1 0
- 0.7 0
- 0.4 0 -
1.1 0
0.5 0
REPRODUCTION AND LIFE SPAN OF PERENNIAL GRASSES 203
in two groupings were compared: (1) primary grasses (black, side- oats, and hairy gramas, Arizona cottongrass, tanglehead, mesa threeawn, and Texas timothy) that tend to predominate on lands that receive light or no grazing or are maintained in good condition, and (2) secondary grasses (Rothrock, sprucetop, and slender gramas, and
curlymesquite) that tend to occur sparingly on ungrazed ranges but are abundant on ranges in poor condition.
1. All grasses studied produced some seedlings or sets each year, but the number produced varied
greatly by species. Secondary grasses usually produced more seedlings than the primary grasses. Rothrock grama and curlymesquite were the most prolific, followed by sprucetop and slender gramas. Ari- zona cottongrass produced the least seedlings.
2. All secondary grasses and Texas timothy produced more seedlings where grazed than where protected. Black, hairy, and side- oats gramas, and tanglehead pro- duced more seedlings or sets where ungrazed than where grazed. Graz- ing seemed to have little effect on seedling production of Arizona cottongrass and ‘mesa threeawn.
3. Mortality of seedlings and young plants was especially high during the first 2 years.
4. Black and sprucetop gramas, Arizona cottongrass, and mesa threeawn were the longest lived with some plants of black grama living 14 years. Rothrock grama was the shortest lived; no plant lived more than 3 years where pro- tected or more than 4 years where grazed.
5. In general, the primary grasses tended to be longer lived where protected than where grazed; whereas the opposite was true of the secondary grasses.
Nineteen Years of Range Improvement on
the Crystal Springs Range Demonstration
Area in Nevada
BLAINE 0. HALLIDAY
Ra,nge Conservationist, Soil Conservation Service, Elko, Neva(da
The Crystal Springs Range Dem- onstration area was established in 1937 by presidential order at the request of the Crystal Springs Soil Conservation Association. The object of establishing this “range study” area was to re-establish and maintain a vegetative cover of high forage value and to demonstrate methods of utilizing the range for- age crop to the fullest extent pos- sible consistent with sustained for- age production.
The order withdrew 16,210 acres of federal range located on the northwest side of Pahranagat Val-
ley, Lincoln County, Nevada. The area was assigned to the Soil Con- servation Service for rancher-SCS cooperative range conservation practice study purposes.
The Crystal Springs range de- monstration area is located in the
transition zone between the south- ern desert shrub and the northern desert shrub belts in what is rec- ognized as the hopsage-blackbrush plant association.
Shrubs and grasses, characteris- tic of both the northern and south- ern desert shrub belts grow there in association with each other. Indian rice grass (Orxopsis hy- menoides) was probably the most abundant of the northern desert grasses present in the climax cover. Only remnants of this spe-
cies exist in the present vegetation. Galleta grass (Hilaria jamesii) and bush muhly (Muhlenbergia porteri) were the most abundant of the southern desert grasses in the original cover. These grasses have increased greatly under con- trolled winter and early spring grazing.
Northern desert (cool-season) plants growing in association with southern desert (warm-season plants seriously complicate the grazing management necessary for simultaneous cool-season and warm- season range-f orage improvement.
Two major vegetation sub-types of the desert shrub type occupy the fenced portion of the study area as follows:
1.
2.
The spiny hopsage-galleta grass sub-type occupies 4,670 acres in the southern part. Vegetation in this type con- sists mainly of such species as galleta grass, Indian rice- grass, bush muhly, Nevada jointfir (Ephedra nevaden- Sk) ) spiny hopsage (Grayia spinosa) , white burrobrush (HymenocEea salsola) , wolf - berry (Lycium andersoni), four-wing saltbush ( AtripEex canescens), and rabbitbrush (Chrysothamnus spp.) This type produces the usable for- age.
The blackbrush sub-type oc- cup ies 3,180 acres in the northern and western potions
20‘4 BLAINE 0. HALLIDAT
FIGUILE 1. Upper photo. Area cleared of brush in the spiny hopsage-gnlleti~ grass sub-type in 1938. Total vegetation density 9.25 sq. ft. per 100 sq. ft.; estimated pr0- duction of usable forage 50 pounds per acre. Rainfall in 1958 totaled 7.91 inches. Lower photo. The same area in 19%. Total vegetation density is 21.18 sq. ft. pei 100 sq. ft. Production from clipped plots averaged 285 p0unds of usable forage per
ncle. The annual rainfall in 1955 was 3.56 inches.
berry, and rabbitbrush are to be found in the outer fringes. Practically no forage is pro- duced on this type.
These range lands are represen- tative of several million acres of desert range in southwestern TJtah, southern Nevada, and western Ari- zona.
The soils are shallow to moder- ately deep gravelly sandy loams, underlain ‘at varying depths by a lime-cemented hardpan, and are subject to wind and water erosion. Livestock began grazing the range in this part of southern Ne- vada about 1870. The range was free and open to all with no re-
strictions on numbers or seasons of use. A rather rapid increase in livestock numbers began in 1900 and reached its peak about 1920. Serious range deterioration, ae- companied by severe wind and n-ater erosion, and sharp declines in forage production were evident by 1930. Extremes in weather conditions, such as prolonged peri- odic droughts, also played an im- portant role in accelerating the rate of range depletion.
The range surrounding the Cry- stal Springs range demonstration area is now included in a federal grazing district with grazing con- trolled by the Bureau of Land Management. Current grazing practices in the immediate vicinity of the study area show a decrease in the intensity of use but little change in the season of use and in management methods.
Pahranagat Valley ranchers are, at present, dependent on this desert range for winter and early spring forage (through the month of April). April grazing appears to be very detrimental to the cool- season forage plants, especially Indian ricegrass.
Conduct of the Study
The 7,850 acre central portion of the 16,210 acre withdrawal was fenced by CCC labor in the spring of 1937. It was designed to facili- tate
1.
2.
3.
the study of:
Range plant response to con- trolled livestock numbers and to controlled minter and early spring grazing.
Range forage production and utilization on specific range sites.
Supplemental conservation practices such as water spreading, brush control, re- seeding and stockwater “pockets”.
RANGE IMPROVEMENT ON THE CRYSTAL SPRINGS AREA 205
Range Surveys and Study Plots A detailed range survey and
vegetation-type map of the 16,210 acre demonstration area was made
in 1936 using the occular-recon- naissance method. This survey was used to determine the stages of range deterioration, severity of wind and water erosion, and to estimate a range-forage improving
stocking rate to serve as a guide to initial stocking.
In 1937 the square-foot density method of range survey was adopted and used to make more accurate recordings of species com- position, height growth by species, density, and seedling reproduction. Permanent 200-square foot circular
plots were located at selected in- tersections on a one-quarter mile grid on the area in an attempt to secure adequate samples of the vegetation in each of the forage types and sub-types. Permanent rectangular loo-square foot plots were also established at selected locations for chart quadrat record- ings.
Detailed plot recordings of vege- tation composition and density were made at yearly intervals from 1939 to 1941, again in 1946, and on selected representative plots in 1955.
Supplemental Conservation Practices Water Developments
In 1936, eleven water pockets were constructed on the area to control runoff and provide a source of stock water. Contour spreader ditches were constructed on the area to lead runoff into the water pockets and spread the excess water over the range. In the winter of 1940-41, a well was drilled, and a windmill and concrete water tank installed to supply permanent stock water.
Seeding Trials
Several seeding trials, using nu- merous seeding mixtures and spe- cies, were carried out on the area during the spring of 1936 and win- ter of 1937. These seedings were made by broadcasting and raking
FIGURE 2. 7Jpl)cr photo. Area in the spiny hopsage-gnlleta grass sub-type which was not cleared of brush. In 1938, when this photograph was taken, total vegetation density was 1.90 sq. ft. per 100 sq. ft., and the estimated production of usable forage was 31 pounds per acre. Lower photo. The same area in 1955. Total density has in- creased to 4.34 sq. ft. per 100 sq. ft., and production from clipped plots averaged 70 pounds of usable forage per acre. Annual raiufall in 1938 was 7.91 inches, and in
1955, 4.21 inches.
in by hand or broadcasting on the used to study the changes in plant
snow. density, species, composition, and the increase in forage production
Brush Control 1 resulting from brush control.
A small area was cleared of
brush in 1937 for the construction Stocking
206 , I
from the 1936 reconnaissance and the 1937 square-foot density range surveys were used as guides to the number of stock permitted to graze the fenced area in 1939. There- after, utilization checks, previous year’s grazing records, and esti- mates, guided by plot clipping weights of the current year’s for- age production, were used to de- termine the use for the following grazing seasons.
The fenced area has been grazed by cattle since 1939. Grazing was confined to the winter months and all livestock were removed prior to spring growth of the cool-season plants the first two years. Local rancher needs for April grazing were considered beginning in 1942. This resulted in a progressive year- by-year extension of the grazing season to finally include the entire month of April.
Results Precipitation Records Month-by-month precipitation records have been recorded from a rain gauge located in the fenced portion for all years from 1937 to 1955, with the exceptions of 1937,
BLAINE 0. HALIXDAY
1938, 1947, and 1951. Some preci- pitation falls normally during each month of the year, but most of it falls during two periods, from De- cember to April, and during July and August. The annual precipi- tation during this recorded period averages 6.36 inches per year. Ex- treme fluctuations in total annual precipitation, however, are com- mon to southern Nevada desert range, indicated by the fact that lows of 2.45 inches in 1942, 1.99 inches in 1948, 2.84 inches in 1950, and highs of 14.14 inches in 1941, 10.20 inches in 1943 and 10.8 inches in 1945 were recorded.
Vegetation Changes Plots were chosen to represent the range sub-types and special treatments within the fenced area. The following tables indicate the changes in plant composition and density that took place on the area prior to 1956. The data for Table 1 were developed from recordings of a single plot established in the small area cleared of brush.
The data for Table 2 were de- veloped from a summary of 19 plots along selected grid transects
Table 1. Vegetation changes in the area cleared of brush in the spiny hopsage- galleta grass sub-type.
Ground surface covered by vegetation (square feet per 100 square feet)
1938 1955
Square feet Square feet
of of
ground ground
Species cover cover
Galleta grass 5.00 19.65
Indian ricegrass .50 0
Four-o’clock (Quamocliclion multiflorum) .50 0
Loco weed (Astragalus lentiginosus) 0 t 0
Nevada, jointfir .75 .67
Anderson wolfberry 1.00 .72
Fourwing saltbush 1.00 0
Shockley golden head (Acamptopappus shockleyi) .25 .14
White burrobrush .25 0
Total 9.25 21.18
Precipitation for year 7.91 5.56
Soil&The soils in this site are light textured, about two feet deep, and underlain by a lime hardpan.
Erosion-Water erosion is moderate with some gullying occuring. Wind erosion is moderate, leaving a desert pavement.
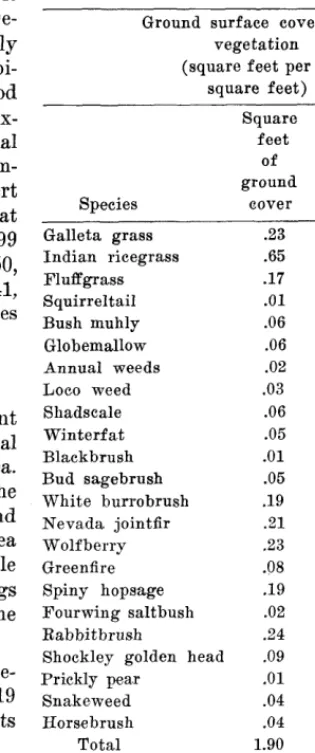
Table 2. Vegetation changes in the area not cleared of brush in the spiny hop-
sage-gall&a grass sub-type
Ground surface covered by vegetation
(square feet per 100 square feet)
Square Square feet feet
of of ground ground
Species cover cover
Galleta grass .23 1.15 Indian ricegrass .65 .03
Fluff grass .17 .06
Squirreltail .Ol .Ol
Bush muhly .06 .45
Globemallow .06 ,003
Annual weeds .02 .04
Loco weed -03 .02
Shadscale .06 .03
Winterfat .05 .05
Blackbrush .Ol .02
Bud sagebrush .06 .03 White burrobrush .19 .40 Nevada jointfir .21 .40
Wolf berry .23 .50
Greenfire .08 .44
Spiny hopsage .19 .25 Fourwing saltbush .02 .04
Rabbitbrush .24 .20
Shockley golden head .09 .13
Prickly pea.r .Ol .02
Snakeweed .04 .06
Horsebrush .04 .03
Total 1.90 4.34
Precipitation for Year 7.91 5.56
to represent the spiny hopsage-gal- leta grass sub-type. Precipitation data related to growth in specific years are also shown.
Figure 1, upper and lower, shows photographs taken in 1938, and 1955 respectively of the spiny hopsage-galleta grass sub-type cleared of brush. Mechanical brush clearing as a supplemental conser- vation practice to range manage- ment accelerated the increase in forage production from a low of 50 pounds of usable forage per acre in 1938 to a high of 285 pounds of usable forage per acre in 1955.
RANGE IMPROVEMENT ON THE CRYSTAL SPRINGS AREA 207
species increased in density from an average of 5.00 square feet per 100 square feet in 1938, to an aver- age of 19.65 square feet in 1955.
Cool-season Indian ricegrass de- creased from an average of .50 square foot per 100 square feet in 1938, to mere remnants in 1955. The almost complete disappear- ance of Indian ricegrass is attri- buted to successive years of early spring (April) grazing and severe drought during 1950, 1951, and 1952.
Figure 2, upper and lower, shows photographs taken in 1938 and 1955 of the spiny hopsage-gal- leta grass sub-type not cleared of brush.
Forage production increased on the major forage producing spiny hopsage-galleta grass subtype from an estimated average of 31 pounds of usable forage per acre in 1938 to an average of ‘70 pounds of usable forage per acre (based on the weighted average of a series of plot clippings and weights from the 19 grid plots) in 1955.
The major increase in forage re- sulted from the warm-season gal- leta grass which increased in den- sity from an average of .23 square foot per 100 square feet in 1938 to 1.15 square feet in 1955. The continued increase in galleta grass is attributed to protection from grazing during the summer months. It is also significant that the low of 31 pounds usable forage produced per acre in 1938 was from 7.91 inches of annual precipi-
tation, and the high of 70 pounds of usable forage per acre was pro-
duced in 1955 from 5.56 inches of annual precipitation.
April grazing proved to be de- trimental to the cool-season plants, especially Indian ricegrass. This grass increased for a time under dormant (winter) season grazing, then gradually decreased as the grazing season extended through April. The warm-season grasses, especially galleta grass and bush muhly have continued to increase. There was practically no live- stock forage produced on the black- brush area when the study was started. To date there has been no change in forage production.
Spreader Ditches
The maintenance of the spreader ditches was discontinued after three years of operation. The re- sults obtained in this low rainfall area, on shallow-gravelly loams and on uplands rather than broad flood plains, did not show enough measurable improvement to justify the expense of their maintenance.
Seeding Trials
Of the several species of grasses planted, only a few scattered plants of crested wheatgrass sur- vived until 1945. Artificial seed- ings in this low rainfall area with the species and by the methods used were not successful.
Discussion
, Rancher interest in range con- servation, in southern Nevada, es- pecially Pahranagat Valley, re- sulted in the establishment of the Crystal Springs range demonstra- tion area in 1937. Continued ranch-
er interest and cooperation with the Pahranagat Valley Soil Conserva- tion District and with the Soil Con- servation Service have made pos- sible the progress in range-forage improvement that is here reported.
The study is progressing with revisions in range management especially designed to solve the April grazing problem and favor the cool-season forage plants. The warm-season plants are increasing as a result of summer protection. Decrease in cool-season forage plants resulting from winter-early spring grazing, indicates a need for further adjustment in the sea- son of grazing in order to favor the cool-season forage plants and enable them to increase. It appears that the problems could be met by applying :
A rotation-deferred system of grazing which would favor the cool-season grasses. Ac- cordingly, the fenced area is being grazed under a rotation-
deferred system of grazing which divides the winter-early
spring season into three equal parts on which grazing is limited to the first third of the season, one year ; the mid- dle third, the second year; and, the last third, the third year. The system then repeats itself.
More careful adjustment of stocking to the current year’s forage production.
Brush removal to reduce the competition for moisture and speed up range-forage im- provement.
Wanted
:Contestants---Photo and Collegiate Range
Range Plant Judging Contests
!The Step-Point Method of Sampling-A
Practical Tool in Range Research
RAYMOND A. EVANS AND R. MERTON LOVE
Assistant Xpecialist and Professor of Agronomy alnd Agro- nomist, Department of Agronomy, University of California, Da~vis, Calif orn4a
Step-point sampling provides a rapid, accurate, and objective method of determining the botani- cal composition and total cover of herbaceous vegetation. These de- terminations enable one to evalu- ate the forage stand on any specific area. The method has been used to inventory herbaceous cover re- lative to soil type, woody vegeta- tion cover, aspect and slope, and other environmental factors by the Soil-Vegetation Survey in Cali- fornia. Values have been assessed by this method to seeding and ferti- lizer trials in irrigated pastures and improved dryland ranges. Changes in botanical composition of improved ranges resulting from grazing manipulation have also been recorded by use of this sampl- ing method.
The step-point method of sam- pling is based on point quadrat sampling. Point quadrat sampling had its origin in a suggestion made to E. B. Levy by Dr. L. Cockayne in 1925 to the effect that a pin point would prove mathematically sound as the basis of a method for charting vegetation (Levy and Madden, 1933). Cockayne vaguely referred to point quadrat sampling in 1926. From 1927 to 1930 a number of papers by Levy, Smith, and Davies appeared recording re- sults obtained by the use of this method. The first description of the method was that of Du Rietz in 1932; and in 1933 Levy and Madden published a full account of it (Goodall, 1952). The method used by Levy consisted of taking a number of locations at random and recording all vegetation that
was hit as the point was projected from above into the sward. He used a frame of 10 pins spaced 2 inches apart (Levy and Madden, 1933). The use of inclined points in a frame was first developed by Tinney, et al. (1937). Eden and Bond (1948) first used a single point for analysis of herbaceous vegetation.
Cracker and Tiver (1948) used the point quadrat method for pur- poses of a grassland survey which they conducted in South Australia. Results of Goodall’s study (1952) showed that when individual points are taken, about one-third the number are needed for the same level of precision as when points grouped in a frame are used. Biswell, et al. (1953) compared data of initial hits only wth those
of all hits of each pin. Their re- sults show that in terms of the more abundant species of the stand there was less than 3 percent dif- ference in composition between methods. Distribution of sampling points used by various operators in point-frame sampling (ten pins in a frame) have been either at random, in transects, or grouped in individual plots or quadrats (Brown, 1954). Eden and Bond (1948) approximated an even spacing of single pins in their sam- pling. Brown (1954) stated that the general opinion of investi- gators using the point method of sampling is that it has every pros- pect of becoming the accepted one for large scale surveys as well as for exact field analyses.
Procedure
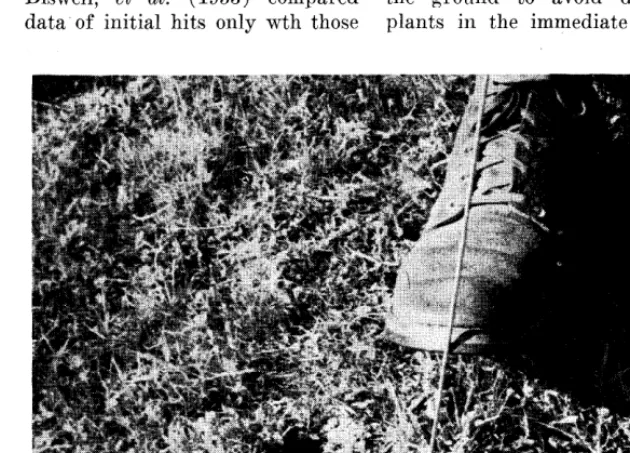
In step-point sampling a single pin is used rather than pins grouped in a frame. An individual step-point is established by the sampler lowering the sampling pin to the ground, guided by a definite notch on the toe of his boot (Fig. 1). At each step-point the sampler places his boot at a 30” angle to the ground to avoid disturbing plants in the immediate vicinity,
FIGURE 1. The sampler is establishing a sampling point with the use of a pin and a notch on the toe of his boot-the step-point.
STEP-POINT METHOD OF SAMPLING 209 THE
and lowers the pin perpendicularly to the sole of the boot until it either hits an herbaceous plant or the ground. The first herbaceous plant hit by the point or the side of the point of the pin is recorded. If no herbaceous plant is hit the pin is pushed into the ground and the plant nearest to it in a forward direction (180’ arc) is recorded. The position of the step-points are determined by specific designs. For investigation of the effects of a particular treatment, e.g., graz- ing manipulation, fertilizer or seeding treatment, transects are run across the field or plot. The transects are equally spaced and the sampling points within tran- sects are also equally spaced. Usu- ally, 300 to 500 points are sufficient to encompass the variability found in a field or local area in which the vegetation is essentially of one type. Where variation of aspect, slope or woody vegetation is en- countered in .a specific field or sampling area, separate samples of smaller size (100 to 200 points) are usually taken. Information concerning variation resulting from
the diverse sections of the field as well as mean values is obtained in this manner. In small sub-plots of fertilizer or seeding trials, the num- ber of points per treatment varies from 100 to 300 depending upon the variation within the area to be sampled.
l
3
.
l
. .
l
.
. . l
IO
.
6
ll . .
l . .
. . .
.
7
.
l
.
.
4
l l .
. .
l . . . .
9
.5
.l . . l
. .
.
l
. .
8
.
l
0
l
Step-point
3
Frame-point and step-point
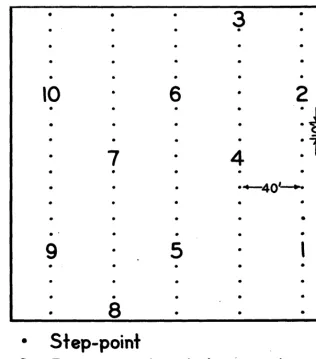
FIGURE 2. Sampling design for grassland survey plots.
Since readings of the sampling points are taken in terms of her- baceous plants and not of bare ground, an estimation method for determining total ground cover is incorporated in the technique. It is felt that to measure botanical composition and total cover by the point method alone would require a larger number of points for a valid sample. This is particularly true when sampling an area of low percentage cover of herbaceous vegetation. However, by combin- ing the point method with an esti- mation method for determining total ground cover the number of sampling points can be reduced. Further, the intensity of sampling for botanical composition will re- main constant regardless of the percentage cover. A sample of one hundred points will determine
botanical composition with one hundred hits on herbaceous plants even when the areas sampled are of low percentage cover. Other- wise, for example, a sample of l,- 000 points would be required to afford 100 hits on herbaceous vege- tation in an area of 10 percent cover.
Table 1. Classes of total herbaceous covm.
Cover class percent
0 o- 5 1 6 - 15 2 16 - 25 3 26 - 35 4 36 - 45 5 46 - 55 6 56 - 65 7 66 - 75 8 76 - 85 9 86 - 95 10 96 -100
For purposes of the Soil-Vege- tation Survey the sampling design covers an acre area and consists of 100 step-points. In the design there are 5 equally-spaced tran- sects of 20 equally-spaced points (Fig. 2). The location of the de- sign is determined by a randomly placed initial point. The specific area to be ,sampled is determined by criteria of soil, topography, and cover of vegetation. By this pro- cedure the sampling results are correlated with a specific set of en- vironmental factors. An
enced operator can sample area using the step-point in about one-half hour.
RAYMOND A. EVANS AND R. MERTON LOVE
Estimates of total ground COY- ered by herbaeeous plants are made with the use of a square-foot frame subdivided into four B-inch squaws (Fig. 3). The estimates are made in terms of 10 percent classes (Table 1). Concepts of estimation are standardized among different operators if more than one is sam- pling and are checked with total cover values using the point-frame. The locations of the square-foot frame readings are incorporated within the sampling desigm. Ten frame-points are used mith 100 step-points for survey work (Fig. 2). Twenty frame readings are in- corporated in the 300 step-point design. Sixteen to twenty frame readings are ordinarily used to sample one treatment in seeding or fertilizer plot work. Exact lo- cation of the square-foot frame is detrrmined by aligning one of the subdivision crossbars of the frame with the notch on the toe of the sampler’s boot (Fig. 3). This is done at specified step-points ac- cording to the sampling design.
For evaluation of a forage stand with respect to a range manipnla-
tion practice the sampling is done in terms of the pertinent species. If one is interested in recording data on one or a few key species, only these need be identified, and all others can be put into a general category. This saves much time in species identification, especially in seasons when inflorescenccs arc not present. For the California grassland survey \vork herbaceous plants are gronprd into six eate-
go&s. They are: desirable and undesirable annual grasses; desir- able and undesirable perennial grasses; and desirable and unde- sirable forbs. Individual species, or in some cases genera, are re- corded within each of the eate- gories of grasses and the more im- portant forbs are recorded by species or genera.
Results
THE STEP-POINT METHOD OF SAMPLING 211
Table 3. Comparison of data, of three different, two-man teams sampling the same
a~- (loation 2). Botanical Composition-Percent
Percent Other
Sampling total Bromus Festuca annual Resident Ero&um Other Perennial team cover W8OZli.S spp. grasses legumes botrys f orbs grasses
% % % % % % % %
1 67 24 58 15 - - 3 -
2 57 22 57 10 2 2 5 2
3 59 17 63 12 - 1 5 2
x 61.0 21.0 59.3 12.3 0.7 1.0 4.3 1.3
S 5.3 3.6 3.3 2.6 - - 1.2 -
type of sampling. In fact, most of the men had not estimated her- baceous cover before that day.
In Table 3 a comparison is made of data of three two-man teams sampling an acre area (Location 2). The standard deviation of estimates of total ground cover was about 5 percent. The standard deviations of composition percent- ages among the major plant groups ranged from 2.6 to 3.6. Again, in this test the samplers had no pre- vious experience. Table 4 compares the results of three different oper- ators sampling an acre area of an- nual grassland (Location 3). The sampling was done early in the year so identification of species was impracticable. For this reason the data are grouped into general cate- gories. Again, the standard devi- ation of the total ground cover estimates was about 5 percent. The magnitude of variation among plant group percentages ranged from 2.6 to 5.5. The relation among plant groups in all of these com- parisons was not altered because of different operators sampling the same area of annual range.
In Table 5 a comparison is made between results of sampling an acre area of annual range with 500 points with pins grouped in sets of ten (point-frame method) and three step-point analyses using 100 individual points and 10 estimates of total cover. Both in measure- .ments of total cover and botanical
composition the step-point analyses compare favorably with the 500 point sample of the point frame.
The only appreciable difference re- sulting from this comparison of methods is in percent of resident legumes in the stand. Results of the point frame sampling indicate about three percent resident le- gumes while step-point sampling indicates about seven percent. The magnitude of this difference is negligible compared with differ- ences among forage classes. Only because of the low total percentage of this group in the stand is this discrepancy noteworthy. The aver- age time required to sample the area using the step-point method was 30 minutes. Between three and four hours were required to
run the point-frame analysis. When a more precise determi- nation of botanical composition of the minor elements of the stand is desired, a large number of points is recommended. For instance, in Table 5, a larger number of points would be required to differentiate with precision between three and seven percent composition of resi- dent legumes. However, the rela- tion between resident legumes and other plant groups is established at the lowest sampling level (100 step-points and 10 frame-points) .
Most of the authors’ experience with step-point sampling has been on annual ranges. Some sampling has been done in the perennial ranges on the north coast of Cali- fornia. In tall, * heavy vegetation the method has limitations. It is difficult not to disturb the vegeta- tion to be sampled in these cases and also to determine exactly what plant has been hit by the pin. In chaparral or other areas of dense woody vegetation a sampling de- sign consisting of straight tran- sects is not feasible. In these in- stances the sampling points are
Table 4. Comparison elf data elf three different operators sampling the same area (location 3).
Botanical Composition-Percent
Percent -
total Annual Eroclium Resident
Sampler cover grasses Forbs SPP. legumes
% % % % %
1 57 65 28 - 7
2 59 55 26 2 17
3 50 59 31 2 8
x 55.3 59.7 28.3 1.3 10.7
S 4.7 5.0 2.6 - 5.5
Table 5. Comparison be&ween the point-frame and step-point. methods of sampling.
Botanical Composition-Percent Percent
Sampling total Annual Erodium Resident Other
metGod cover grasses SPP. legumes forbs
Point frame % % % % %
(500 points) 54.1 63.6 0.7 2.9 32.8
Step-point
(Means values and standard deviatio,ns of three samples of 100 points and 10 density estimates)
Ii 57.7 62.0 1.3 6.7 30.0
‘212 RAYMOND A. EVANS AND R. MERTON
usually placed at random among quired to sample an area with the the woody plants. step-point method was about one-
Summary
The step-point method of sam- pling consists of procedures for de- termining total ground cover and percentage cover of the herbaceous species in the stand. Involved in the procedure is the point method using individual points and an estimate method utilizing a square- foot frame. Predetermined sam- pling designs are used in the sam- pling procedures.
low magnitude. Also data of total ground cover and botanical com-
position from the step-point meth- In comparisons among data of different operators sampling the same acre area standard deviations of total ground cover and botanical composition measurements are of
sixth to one-eighth as much as re- quired by the point-frame method. From comparisons presented in this paper and from three years of field experience with the method,
Acknowledgements
it is felt that the degree of ac- curacy and objectivity are suitable
The authors wish to thank their col- leagues in the University of California
for valid analyses of field plots and are comparable to other methods. Of prime importance is the short time in which areas can be sampled using this method. The latter point in many cases is the factor which will mean success or failure of range experimentation, p art i cu - larly in respeclt to long-term con- tinuity of the collection of data.
od were comparable to that of the an& the members of the “Soil-Vegetation Survey field crews for their assistance point-frame method. The time re- and suggestions.
LOVE
LITERATURE CITED
BISWELI~, H. H., A. M. SCHULTZ, J. L. LAUNCHBAUGH AND R. D. TAB=. 1953. Studies of brush successions and re- seeding. Quart. Prog. Rept. Proj. 31- R-7. Oct. 1953. Calif. Dept. Fish and Game. 13 pp. Mimeo.
BROWN, DOROTHY. 1954. Methods of sur- veying and measuring vegetation. Bull. 42. Commonwealth Bur. of Pasture and Field Crops. Hurley, Berks., Eng- land. 223 pp.
CROCKICE, R. L. AND N. S. TIVE~. 1948. Survey methods in grassland ecology. Jour. Brit. Grassland Sot. 3 :l-26. EDEN, T. AND T. E. T. BOND. 1945. The
effects of manurial treatment on the growth of weeds in tea. Emp. Jour. Exp. Agr. 13 : 141-157.
GOODALL, D. W. 1952. Some considera- tions in the use of point quadrats for the analysis of vegetation. Aust. Jour. Sci. B. 5:1-41.
LEVY, E. B. AND E. A. MADDEN. 1933. The point method of pasture analysis. N. Z. Jour. Agr. 46:267-279.
TINNLY, F. W., 0. S. AA~~ODT AND H. L. AHLGRE~N. 1937. Preliminary report of a study of methods used in botanical analysis of pasture swards. Jour. Amer. Sot. Agron. 29 : 835-840.
EFFECTS OF INTENSITY AND DATE OF HERBAGF, REMOVAL
ON HERBAGE PRODUCTION OF ELK SEDGE
Abstract of thesis presented in partial fulfillment of the requirements fov the degree of Master of Science, major in Range Management, College of Forestry and
Range Management, Colorado State University, 195’7.
The primary purpose of this study wa#s to investi- gate t.he degrees of grazing which elk sedge could withstand a,t vasious dates on eastern Oregon summer cattle ranges and be expected to’ maintain a sustained yield of herba,ge. This was accomplished. by uniformly clipping the herb’age from elk sedge plants on study plots a.t various but, speSeific intensities and dates in a.n effort to, simula;te grazing.
The- effects of three intensities of herbfage relmoval, estimated at 20, 40, and 60 percent by weight, a,t four dates during the four month grazing season were in- vestigated. The first date of treatment occnrre’d when the seed of (the plant, was in the\ late1 dough stage’ of development. Other clipping dates were successively four weeks laster. These, trelatments were applied to the same plots for three yeaxs, 1953, 1954, and 1955, and replicated in eight bdocks. Eaeh block repre-
sented a particulas site where elk sedge occurs. The sedge stands were va,riable in density and species composition. The first year, 1953, wa.s considered a
calibration period ‘during which all treatments were initially applield. Data collected in 1956 were used to determine any changes in herblage production of seed- stalk numbers, due to the various trea,tments.
The analysis of quantitative data,, including anal- ysis of variance, convariance, and regression, showed tha,t the various t,reatments ha,d no signifieSant effects on herbage production of elk seldgel. However, vigor of the plant’, deltermined by numbers of seedstalks, was significantly or highly significantly reduce’d. Thirty-three percent mole seedstalks were produced under t,he 20 percent herbage trea,tment than the 60 percent trea,tment. The 40 percent treatment resulted in 22 percent more’ seedstalks than the 60 percent trea,tment. Fourteen percent more seedstalks were produced under the 20 percent treatment as compase~d to the 40 percent trea,tment. These results o,ocurred regardless of dafe of treatment.
Ryegrass and Brush Seedling Competition
for Nitrogen on Two Soil Types1
mwrge. Most of these dir from
drought, depletion of soil moisture by other plants, and drpredatiou by mammals, birds, and insects, but
mongh survive from grar to prar to account for the steady, continn-
OUR infestation of range lands with
brush.
Rrrrral factors seem to favor the
tendrney for the woody species to
increase in abundance. One of
these is firr. Brush seedlings al-
most always appear in great abun- dance aftrr fires. Thry thrive in
burned-over areas vhere the
grasses bad bee11 shaded or choked
out previously by the mature
shrubs. Protection following firr
may a!lov a wry drnsr stand of shntbs to develop.
.Z second reason for thr incrrase in shrubs is close grazing during
the green forage period. This re-
driers the capacity of the her-
bnccous vegetation to me the soil
moisture, and consequently the
shrnbs have enough water for con-
tinued growth throughout the dry
S”l7lElL?r.
A third factor brnrficial to the
survival of brush seedlings is the
occurrence of heavy rains late in
the season. R.ainfall after the
grasses mature and dry may re-
plenish the soil moisture and there-
hy favor the brush seedlings in
snmmrr. An important point to
keep in mind is that most brush
seedlings germinate and begin
provth in the spring, whereas, the
berbaceons species begin growth in
the fall-just after the first rains
begin.
Another possible reason for the
increase in shrubbv regetation is
that continurd graz”ing over a prri- od of years has resulted in R gradu-
al decrease in soil fertility, hence
less production of herbaceons vege-
tation. The net result of B reduc-
tion in herbaceous vegetation is
decrease in competition, which
thereby enables the more deeply
rooted shnlbby species to get
started and survive.
It should bP difficult, rspecially
on range lands vhrre the grasses