Recent Results from Experiment D0
V. Šimák
1FZU ACR and FJFI CTU Prague, for D0 Experiment
Abstract.Brief summary of resent experimental results from experiment D0 at TEVA-TRON in FNAL.
1 Introduction
After 28 years (1983 - 2011) of TEVATRON work in FNAL, particle physics reach high level of understanding of elementary interactions in center of mass energy up to 2 TeV. Two big particle detector, CDF and D0 could analyze all interactions detected with complex of subdetectors in full 4π cover and with magnetic spectrometry for all charged particles.
Briefs summary of some of results achieved at TEVATRON:
1985 - First observation of proton-antiproton collisions by CDF at 1.8 TeV (June 8). 1992 - D0 observes first proton-antiproton collision with cms energy 1.8 TeV. 1995 - Experiment CDF ad D0 announce discovery of top quark (March 3th). 1996 - Observation of antihydrogen atoms.
1996 - Observation of exotic charm meson. 1998 - Discovery ofBcmeson.
1999 - Fixed target experiment KTeV observes direct CP violation in the decay of neutral Kaons. 2000 - The DONuT experiment reports first evidence for the direct observation of theτneutrino. 2004 - Run II, which started in 2001, achieves a peak luminosity 1032cm2sec−1.
2006 - Discovery of Bs matter-antimatter oscillations 3 trillion times per second. 2007 - Discovery of cascade b-baryon.
2009 - Discovery of single top quark production.
2010 - Tevatron achieves a peak luminosity 4x1032cm2sec−1 2011 - Tevatron produces final pron-antiproton collisions (sept 30)
Experiments D0 and CDF have collected about 10 f b−1of data each.
The result from both experiment enriched knowledge in particle physics and fulfilled some open questions in Standard Model.
The analysis of data will still continue for few next years. DOI: 10.1051/
C
Owned by the authors, published by EDP Sciences, 2014 /2014 007 0
sl d
a
-0.04 -0.02 0 0.02
sl
s
a
-0.04 -0.02 0 0.02
sl s D0 a
sl d B Factory a
) 68% C.L. >120 (IP sl b A
) 68% C.L. <120 (IP sl b A
Combination Standard Model
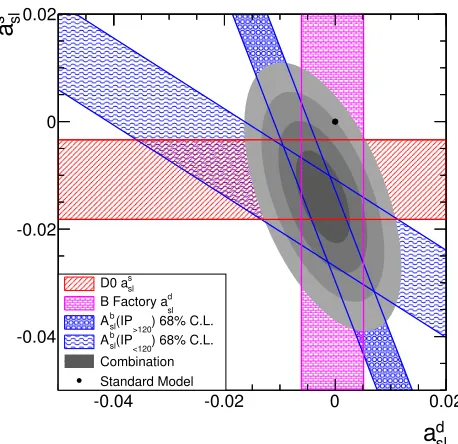
Figure 1.Combination of D0 and B factory average forad slandassl.
Following pictures present resent results from experiment D0 divided according the subjects: B-physics, Electroweek B-physics, Quntum Chromodynamics, Top quark B-physics, Higgs boson and New Phenomena. Most of the results are obtained with statistics of events corresponding to 10.4f b−1.
2 B-physics
Several results in spectroscopy of hadrons from is coming from study of physics of b quark, which could be directly identified in 60% of events. We present a measurement of the semileptonic mixing asymmetrya=(Γ( ¯A)−Γ(A))/(Γ( ¯A)+Γ(A)) forB0mesons,ad
sl. Using two independent decay channels:
B0→μ+D+X,D→K+π−π−andB0→μ+D∗+X,B0→μ+D∗+XwithD∗→D¯0+π−, ¯D0→
K+π− (and charge conjugate processes), we have determined the semileptonic mixing asymmetry for B0 mesons,ad
sl. We extract the charge asymmetries in these two channels as a function of the
visible proper decay length (VPDL) of the B0 meson, correct for detector-related asymmetries using data-driven methods, and account for dilution from charge-symmetric processes using Monte Carlo simulation. The final measurement combines four signal VPDL regions for each channel, yielding:
adsl=0.68±0.45 (stat.)±0.14 (syst.)
Combination of measurements ofadsl(D0 and existing world-average from B factories),assl, and the two impact-parameter-binned constraints from the same-charge dimuon asymmetryAbsl. The bands represent the±1 standard deviation uncertainties on each measurement. The ellipses represent the 1, 2, 3, and 4 standard deviation twodimensional confidence level regions of the combination [1] in Fig.2.
We have measure the time-integrated flavor-specific semileptonic charge asymmetry in the decays of B0
s mesons that have undergone flavor mixing, alss, using B
0
s( ¯B0s)→ D±s +μ++X decays, with
) (GeV)
-K
+
K
-μ + μ
M(
5.2 5.4 5.6 5.8
Events / 28 MeV
0 500 1000 1500
2000 DØ Run II, 10.4 fb-1
Data
Full Fit
Signal
K*(892)
Bkg
) [cm]
0
S
K
ψ
/
J
(
λ
-0.15 -0.1 -0.05 0 0.05 0.1 0.15 0.2 0.25 0.3
m
μ
Candidates per 50
1 10
2
10
3
10
-1
(b) DØ, 10.4 fb
Data Data fit Signal Background
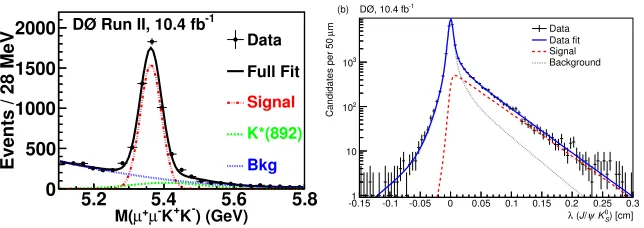
Figure 2. Invariant mass distribution ofB0
s candidates withct >200μmfor events in the mass range 1.01 <
M(K+K−)<1.03GeV. A fit to a sum of a GaussianB0
s→J/ψφsignal (dashed-dotted) a quadratic combinatorial
background (dotted), and the reflection of the decayB0→J/ψK∗(892) (dashed), is used to extract theB0
syield
(left). Proper decay length distributions forB0→J/K0candidates, with fit results superimposed (right).
A fit to the difference between the time-integratedD−s andDs+mass distributions of theB0sand ¯B0s
candidates yields the flavor-specific asymmetry
as
ls=−1.08±0.72(stat)±0.17(syst)
which is the most precise measurement and in agreement with the standard model prediction. We have investigated the decayB0
s →J/ψ→K+K−for invariant masses of theK+K−pair in the range
1.35<M(K+K−)<2GeVFig.2.
From the study of the invariant mass and spin of the K+K− system, we find evidence for the two-body decay and measure the relative branching fraction of the decays to be [2]Rf2/φ = 0.22± 0.05 (stat)±0.04 (syst). We measure theΛ0blifetime in the fully reconstructed decayΛ0b→J/ψΛ0[3] Fig. 2.
The lifetime of the topologically similar decay channelB0 → J/ψK0
S is also measured [4]. We
obtain τ(Λ0
b)=1.303±0.075(stat.)±0.035(syst.)ps
andτ(B0)=1.508±0.025(stat.)±0.043(syst.)ps.
Using these measurements, we determine the lifetime ratio of τ(Λ0
b)/τ(B0)=0.864±0.052(stat.)±0.033(syst.).
We present a measurement of the relative branching fraction, Rf0/φ, of B0s to J/ψf0(980), with
f0(980) → π+π−, to the processB0s → J/ψφ, withφ → K+K− Fig. 2. TheJ/ψf0(980) final state corresponds to a CP-odd eigenstate ofB0
s that could be of interest in future studies of CP violation.
With 8f b−1of data recorded with the D0 detector we find
Rf0/φ=0.275±0.041(stat)±0.061(syst).
Using data corresponding to an integrated luminosity of 1.3f b−1, we observe a narrow mass state decaying intoυ(1S)+γ, where theυ(1S) meson is detected by its decay into a pair of oppositely charged muons, and the photon is identified through its conversion into an electron-positron pair. The significance of this observation is 5.6 standard deviations. The mass of the state is centered at 10.551±0.014(stat.)±0.017(syst.)GeV/c2, which is consistent with that of the state recently observed by the ATLAS Collaboration Fig.3 [5].
3 Electroweek Interactions
]
2
[GeV/c
μ μ
m
8 8.5 9 9.5 10 10.5 11 11.5 12
2
Events / 50 MeV/c
0 5 10 15 20 25 30 35 40 45 50
3
10 ×
Data Total Fit Bkg only
(1S) Υ
(2S) Υ
(3S) Υ
-1
DØ, 1.3 fb
]
2
[GeV/c
(1S) Υ
+ m
μ μ
- M
γ μ μ
M
9.5 10 10.5 11 11.5
2
Events / 50 MeV/c
0 5 10 15 20 25 30 35 40 45
Data Full fit Bkg only
(1P)
b
χ (2P)
b
χ New state
-1
DØ, 1.3 fb
Figure 3. Dimuon invariant mass spectrum for opposite-charge pairs passing the muon selection criteria. The solid curve is a fit to the data assuming threeυresonances and a combinatorial background. The relative con-tributions from theυ(1S),υ(2S), andυ(3S) (left). The distribution ofMμμγ-Mμμ+mυ(1S)fit with three signal
functions and the mixed event background (right).
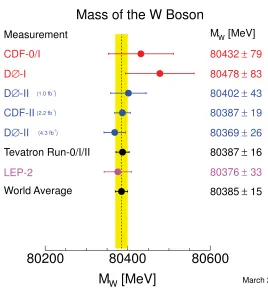
We present a measurement of the W boson mass using data corresponding to 4.3f b−1of integrated luminosity collected with the D0 detector during Run II at the Fermilab Tevatronpp¯collider. With a sample of 1,677,394 decayW → eorμcandidate events, we measureMW =80.367±0.026GeV.
This result is combined with an earlier D0 result determined using an independent Run II data sample, corresponding to 1f b−1of integrated luminosity, to yieldM
W=80.375±0.023GeV[7].
We study the processespp¯ →WZ→ν, +−andpp¯ →ZZ → +−νν¯where=eorμ. Using 8.6 fb−1 of integrated luminosity. We measure theWZ production cross section to be 4.50+0.63
−0.66 pb which is consistent with, but slightly above a prediction of the standard model. The ZZ cross section is measured to be 1.64±0.46 pb, in agreement with a prediction of the standard model. Combination with an earlier analysis of theZZ→+−+−channel yields aZZcross section of 1.44+−0.350.34pb [9].
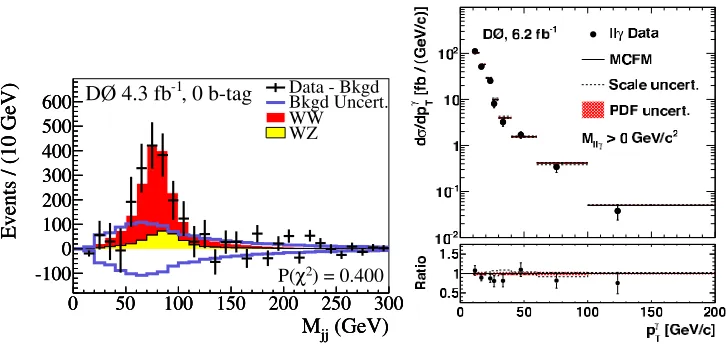
We study WW and WZ production with lνqq (l = e, μ) final states using data corresponding to4.3f b−1of integrated luminosity. Assuming the ratio between the production cross sectionsσ(WW) andσ(WZ) as predicted by the standard model, we measure the total WV (V=W,Z) cross section to beσ(WV) = 19.6+−33.0.2 pb, and reject the background-only hypothesis at a level of 7.9 standard deviations. We also use b-jet discrimination to separate the WZ component from the dominant WW component. Simultaneously fitting WW and WZ contributions, we measureσ(WW) = 15.9+3.7
−3.2pb andσ(WZ)=3.3+4.1
−3.3pb, which is consistent with the standard model predictions [8].
We present a measurement of pp¯ → Zγ → ll+γ,l = e, μproduction with a data sample cor-responding to an integrated luminosity of 6.2f b−1. The results of the electron and muon channels are combined, and we measure the total production cross section and the differential cross section
dσ/dpγT, where pγT is the momentum of the photon in the plane transverse to the beamline Fig. 5. The results obtained are consistent with the standard model predictions from next-to-leading order calculations. We use the transverse momentum spectrum of the photon to place limits on anomalous
80200
80400
80600
Mass of the W Boson
[MeV]
WM
March 2012Measurement MW [MeV]
CDF-0/I 80432± 79
-I ∅
D 80478±83
CDF-II(2.2 fb-1) 80387± 19
-II
∅
D -1)
(1.0 fb 80402± 43
-II
∅
D -1)
(4.3 fb 80369± 26
Tevatron Run-0/I/II 80387± 16
LEP-2 80376± 33
World Average 80385± 15
Figure 4.Summary of measurement of W mass as March 2012
and the distribution of the charge-signed photon-lepton rapidity difference are found to be in agree-ment with the standard model. These results provide the most stringent limits on anomalousWWγ
couplings for data from hadron colliders:−0.4<Δκγ<0.4 and−0.08< λγ<0.07 at the 95% C.L.
4 QCD Interactions
(GeV)
jj
M
0 50 100 150 200 250 300
Events / (10 GeV)
-100 0 100 200 300 400 500
600 Data - BkgdBkgd Uncert.
WW WZ
(GeV)
jj
M
0 50 100 150 200 250 300
Events / (10 GeV)
-100 0 100 200 300 400 500
600
, 0 b-tag
-1
DØ 4.3 fb
) = 0.400
2
χ P(
(GeV)
jj
M
0 50 100 150 200 250 300
Events / (10 GeV)
-100 0 100 200 300 400 500 600
Figure 5.A comparison of the measured WW and WZ signals (filled histograms) to background-subtracted data (points) in the dijet mass distribution (summed over electron and muon channels) for 0, 1, and 2-tag sub-channels after the combined fit to data using the dijet mass distribution [9] (left). Unfoldeddσ/dpγpT distribution with no
Mllγrequirement for combined electron and muon data compared to the NLO prediction (right).
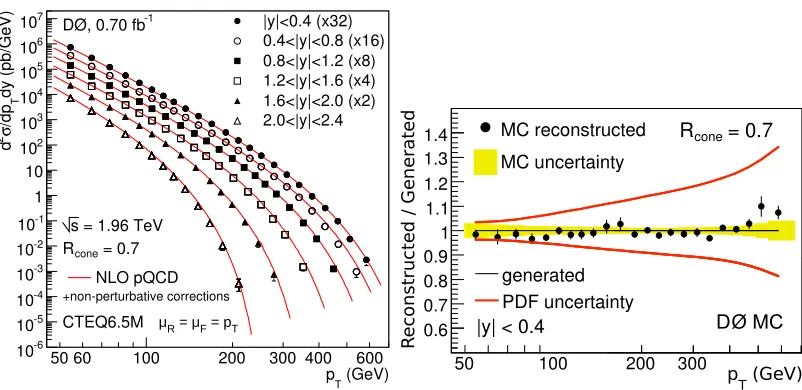
distribution functions. The observable measures the angular correlations of jets and is defined as the number of neighboring jets above a given transverse momentum threshold which accompany a given jet within a given distanceΔRin the plane of rapidity and azimuthal angle. The ensemble average over all jets in an inclusive jet sample is measured and the results are presented as a function of transverse momentum of the inclusive jets, in different regions of !R and for different transverse momentum requirements for the neighboring jets. The measurement is based on a data set corresponding to an integrated luminosity of 0.7f b−1. The results are well described by a perturbative QCD calculation in next-to-leading order in the strong coupling constant, corrected for non-perturbative effects. From these results, we extract the strong coupling and test the QCD predictions for its running over a range of momentum transfers of 50 to 400 GeV [10] Fig. 6.
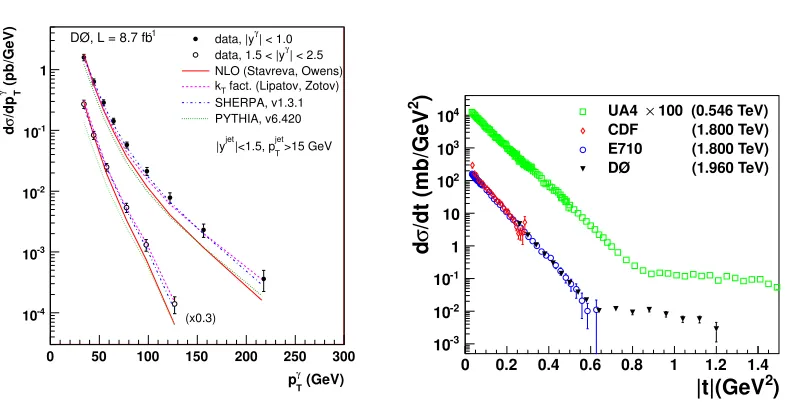
We present measurements of the differential cross sectiondσ/dpTγ for the inclusive production
of a photon in association with a b-quark jet for photons with rapidities|yγ| <1.0 and 30 < pTγ <
300GeV, as well as for photons with 1.5 < |yγ| < 2.5 and 30 < pTγ < 200GeV, where pTγ is the photon transverse momentum Fig. 8. The b-quark jets are required to havepT>15GeVand rapidity |yjet|<1.5. The results are based on data corresponding to an integrated luminosity of 8.7f b−1. The
measured cross sections are compared with next-to-leading order perturbative QCD calculations using different sets of parton distribution functions as well as to predictions based on the kT-factorization QCD approach, and those from the Sherpa and Pythia Monte Carlo event generators [11].
In special runs of D0 experiment with Proton Forward Detector we have meured elastic scattering of pp¯ at √(s) = 1.960T eV. Comparison with other experiments is displayed in Fig. refQCD-3ab [12]. We investigate the decayB0
s → J/ψK+K−for invariant masses of theK+K−pair in the range
1.35< M(K+K−)<2 GeV. The data sample corresponds to an integrated luminosity of 10.4 fb−1of
10-3 10-2 10
-1
RΔ
R
(pT
,
Δ
R, p
Tmin
nbr
)
50 100 200 400 50 100 200 400 50 100 200 400 50 100 200 400
pT (GeV) p
Tmin
nbr = 30 GeV p Tmin
nbr = 50 GeV p Tmin
nbr = 70 GeV p Tmin nbr = 90 GeV 2.2 < ΔR < 2.6 1.8 < ΔR < 2.2 1.4 < ΔR < 1.8
NLO pQCD + non-perturb. correct.
μR = μF = pT MSTW2008 PDFs
√s = 1.96 TeV L = 0.7 fb-1 DØ
0.08 0.1 0.12 0.14
αs
(Q)
0.1 0.12 0.14
50 100 200 400
Q (GeV) αs
(M
Z
)
DØ
DØ RΔR (this analysis) DØ incl. jets ALEPH evt. shp. (a)
(b)
αs(MZ) = 0.1191 +0.0048 −0.0071 (DØ combined fit to RΔR data)
Figure 6. The measurement ofRΔRas a function of inclusive jetpT for three different intervals inΔRand for
four different requirements ofpnbr
T min. The inner uncertainty bars indicate the statistical uncertainties, and the total
uncertainty bars display the quadratic sum of the statistical and systematic uncertainties. The theory predictions are shown with their uncertainties (left). The strong couplingαs at large momentum transfers, Q, presented as
αs(Q) (a) and evolved toMZusing the RGE (b). The uncertainty bars indicate the total uncertainty, including
the experimental and theoretical contributions. The newαs results fromRΔR are compared to previous results
obtained from inclusive jet cross section data. Theαs (MZ) result from the combined fit to all selected data
points and the corresponding RGE prediction are also shown (right).
5 TOP quark Physics
The top quark is the heaviest known elementary particle, with a mass about 40 times larger than the mass of its isospin partner, the bottom quark. It decays almost 100%. of the time to aW boson and a
bquark. The summary of cross section production oftt¯is presented in Fig. 9, with final combination: σt¯t=7.65±0.42pb.
We present a measurement of the top quark mass (mt) in pp¯ collisions at √s=1.96 TeV using
tt¯events with two leptons (ee,eμ, orμμ) and accompanying jets in 4.3f b−1 of data collected. We analyze the kinematically underconstrained dilepton events by integrating over their neutrino rapidity distributions. We reduce the dominant systematic uncertainties from the calibration of jet energy using a correction obtained from tt¯events with a final state of a single lepton plus jets. We also correct jets in simulated events to replicate the quark flavor dependence of the jet response in data. We measuremt =173.7±2.8 (stat)±1.5 (syst) GeV and combining with our analysis in 1 f b−1 of
preceding data we measuremt=174.0±2.4 (stat)±1.4 (syst) GeV. Taking into account statistical and
systematic correlations, a combination with the D0 matrix element result from both data sets yields
mt=173.9±1.9 (stat)±1.6 (syst) GeV [13].
We measure lepton angular distributions intt¯→W+b,W−b¯ →l+νbl¯−. Using data corresponding to an integrated luminosity of 5.4f b−1, we find that the angular distributions of l− relative to anti-protons andl+relative to protons are in agreement with each other. Combining the two distributions and correcting for detector acceptance we obtain the forward-backward asymmetry
AlFB=(5.8±5.1(stat)±1.3(syst))
compared to the standard model prediction ofAl
FB(predicted)=(4.7±0.1). This result is further
(GeV)
T
p
50 60 100 200 300 400
dy
(pb/GeV)
T
/dp
σ
2
d
-6
10
-5
10
-4
10
-3
10
-2
10
-1
10 1 10
2
10
3
10
4
10
5
10
6
10
7
10 |y|<0.4 (x32)
0.4<|y|<0.8 (x16) 0.8<|y|<1.2 (x8) 1.2<|y|<1.6 (x4) 1.6<|y|<2.0 (x2) 2.0<|y|<2.4
s = 1.96 TeV = 0.7
cone
R
NLO pQCD
+non-perturbative corrections
CTEQ6.5M
600
DØ, 0.70 fb-1
Figure 7. Inclusive jet cross section measurements as a function of jetpT in six|y|bins. The data points are
multiplied by 2, 4, 8, 16, and 32 for the bins 1.6<|y|<2.0,1.2<|y|<1.6,0.8<|y|<1.2,0.4<|y|<0.8, and|y|<0.4, respectively (left). MC closure test of the method used to extract the inclusive jetpTcross section
for the jet|y|<0.4 bin. The full analysis was repeated treating MC events as data and comparing the result to the input cross section. Good agreement is found within the statistical uncertainties of fits to jet energy scale and resolution, and unfolding present in MC (shaded band), which are much smaller than the systematic uncertainties in data(right).
Al
FB=(11.8±3.2) [14].
We present measurements of thetWbcoupling form factors using information from electroweak single top quark production and from the helicity of W bosons from top quark decays intt¯events Fig. 10 [15]. We set upper limits on anomaloustWbcoupling.
Combining measurements that simultaneously determine the fractions of W bosons with longitu-dinal (f0) and right-handed (f+) helicities, we find
f0=0.722±0.081[±0.062(stat.)±0.052(syst.)] and
f+=−0.033±0.046[±0.034(stat.)±0.031(syst.)].
Combining measurements where one of the helicity fractions is fixed to the value expected in the standard model, we find
f0=0.682±0.057[±0.035(stat.)±0.046(syst.)] and
f+ =−0.015±0.035[±0.018(stat.)±0.030(syst.)] [16]. The results are consistent with standard model expectations. Thett¯spin correlation strength C is defined by
d2σ
tt¯/dcosΘ1dcosΘ2=σ(tt¯) (1−Ccos(Θ1)cos(Θ2))/4,
whereΘ1,Θ2are the angles between the spin-quantization axis and the direction of flight of the down-type fermion from the W boson decay in the respective parenttor ¯trest frame. The fractional difference in the number of events where the top and antitop quark spins are aligned and those where the top quark spins have opposite alignment A is defined asC=A|α1α2|whereαiis the spin analyzing
power of the final state parton under consideration. In NLO QCDαl+ = 1 for the charged lepton
(GeV) γ
T
p
0 50 100 150 200 250 300
(pb/GeV) γ T /dp σ d -4 10 -3 10 -2 10 -1 10 1
| < 1.0 γ data, |y
| < 2.5 γ data, 1.5 < |y NLO (Stavreva, Owens)
fact. (Lipatov, Zotov) T k SHERPA, v1.3.1 PYTHIA, v6.420 >15 GeV jet T |<1.5, p jet |y (x0.3) -1 DØ, L = 8.7 fb
)
2
|t|(GeV
0 0.2 0.4 0.6 0.8 1 1.2 1.4
)
2/dt (mb/GeV
σ
d
-3 10 -2 10 -1 10 1 10 2 10 3 10 410 UA4 × 100 (0.546 TeV)
CDF (1.800 TeV) E710 (1.800 TeV) DØ (1.960 TeV)
Figure 8. MC closure test of the method used to extract the inclusive jet pT cross section for the jet|y|<0.4
bin. The full analysis was repeated treating MC events as data and comparing the result to the input cross section. Good agreement is found within the statistical uncertainties of fits to jet energy scale and resolution, and unfolding present in MC (shaded band), which are much smaller than the systematic uncertainties in data (left). dσ/dtdifferential cross section of elastic scattering measured by the D0 Collaboration and compared to the CDF and E710 measurements at√s=1.8 TeV, and to the UA4 measurement at√s=0.546 TeV (scaled by a factor of 100) (right).
=1.96 TeV s cross section (pb) at t
t
→
p p
CDF dileptons * 8.8 fb-1 0.70 pb ± 0.50 ± 7.47 0.86 pb ±
CDF ANN l+jets 7.82 ± 0.38 ± 0.40 pb 4.6 fb-1
0.55 pb
±
CDF SVX l+jets 4.6 fb-1 0.61 pb ± 0.36 ± 7.32 0.71 pb ±
CDF all-jets 7.21 ± 0.50 ± 1.08 pb 2.9 fb-1
1.19 pb
±
CDF combined * 7.71 ± 0.31 ± 0.40 pb up to 8.8 fb-1
0.51 pb
±
DØ dilepton 7.36 ± 0.85 pb 5.4 fb-1 DØ l+jets 7.90 ± 0.74 pb 5.6 fb-1
DØ combined 7.56 ± 0.20 ± 0.56 pb 5.6 fb-1
0.59 pb
±
Tevatron combined * September 2012
= 172.5 GeV
t
for m
-1
up to 8.8 fb 0.36 pb ± 0.20 ± 7.65 0.42 pb ± =1.96 TeV s cross section (pb) at t
t
→
p p
6 7 8 9
Tevatron Run II Preliminary *=preliminary
Top Quark Mass [GeV]
140 160 180 200 220
Yield [Events/5GeV]
0
50
100
-1
DØ, 5.4 fb
(d)
Top Quark Mass [GeV]
140 160 180 200 220
Yield [Events/5GeV]
0
50
100
+
f
-0.2 0 0.2 0.4 0.6 0.8 1 1.2
0 f -0.2 0 0.2 0.4 0.6 0.8 1 1.2 Best-fit value SM value 68% C.L. 95% C.L. 0 ≠ R V f 0 ≠ L T f 0 ≠ R T f -1
D0, 5.4 fb
R
0.4 0.45 0.5 0.55 0.6
/bin events N 0 20 40 60 80 100 120 140 Data
SM spin corr. t
t
no spin corr. t t t measured t Other W+jets Multijet -1 DØ, L=5.3 fb
R
0.4 0.45 0.5 0.55 0.6
/bin events N 0 20 40 60 80 100 120 140 R
0.4 0.45 0.5 0.55 0.6
/bin events N 0 20 40 60 80 100 120 140 R
0.4 0.45 0.5 0.55 0.6
/bin events N 0 20 40 60 80 100 120 140 R
0.4 0.45 0.5 0.55 0.6
/bin events N 0 20 40 60 80 100 120 140 R
0.4 0.45 0.5 0.55 0.6
/bin events N 0 20 40 60 80 100 120 140 R
0.4 0.45 0.5 0.55 0.6
/bin events N 0 20 40 60 80 100 120 140
Figure 10.Likelihood contours at the 68% C.L. and the 95% C.L. as a function of W boson helicity fractions. Statistical uncertainties and systematic uncertainties that are uncorrelated with the single top quark measurement are included. The squares, triangles and upside-down triangles showfR
V , fTLand fTRvarying in fifty equal-size
steps such that their ratio tofL
V goes from zero to ten-to-one. The dashed triangle denotes the physically allowed
region. (left). Discriminant R for measurement of top-antitop spin correlation [17](right).
[GeV]
t
t
m
200
400
600
800
1000
1200
Events/25 GeV
-1
10
1
10
2
10
-1
DØ, 5.3 fb
b)
data
=950 GeV
XM
t
t
W/Z+jets
multijets
between correlated and uncorrelated top quark spin hypotheses, we define a discriminant R, which is displayed in Fig. 10 together with MC events with and without spin correlation as well as background. Data support the hypothesis with top-antitop spin correlationC =0.85±0.29 [17] which is in good agreement with the SM prediction.
The total width of top quarkΓt is extracted from the partial decay widthΓ(t → Wb) and the
branching fractionB(t→Wb).Γ(t→Wb) is obtained from thet-channel single top quark production cross section andB(t → Wb) is measured intt¯events. For a top mass of 172.5 GeV, the resulting width isΓt=2.00+0.47
−0.43GeV. This translates to a top-quark lifetime ofτt=(3.29−+0.900.63)×10−25s [18].
We have also extract an improved direct limit on the CKM matrix element 0.81<|Vtb| ≤1 at 95%
C.L. and a limit of|Vtb|<0.59 for a high mass fourth generation bottom quark assuming unitarity of
the fourth generation quark mixing matrix. We searched for a narrowtt¯resonance that decays into a lepton+jets final state based on an integrated luminosity of 5.3f b−1 of proton-antiproton collision. We set upper limits on the production cross section of such a resonance multiplied by its branching fraction tott¯which we compare to predictions for a leptophobic topcolorZboson. We exclude such a resonance at the 95% confidence level for masses below 835GeV Fig. 11 [19]. We present new direct constraints on a generalWtbinteraction using data corresponding to an integrated luminosity of 5.4f b−1. The standard model provides a purely left-handed vector coupling at theWtbvertex, while the most general, lowest dimension Lagrangian allows right-handed vector and left- or right-handed tensor couplings as well.
We obtain precise limits on these anomalous couplings by comparing the data to the expectations from different assumptions on theWtbcoupling [20].
We present measurements of production cross sections of single top quarks in pp¯ collisions at √
(s) = 1.96T eV [21] in a data sample corresponding to an integrated luminosity of 5.4 f b−1. We select events with an isolated electron or muon, an imbalance in transverse energy, and two, three, or four jets, with one or two of them containing a bottom hadron. We obtain an inclusive cross section of (pp¯→tb+X),
σ(tqb+X)=3.43±0.740.73 pb and use it to extract the CKM matrix element 0.79<|Vtb| ≤1 at the
95% C.L. We also measureσ(pptb¯ +X)=0.68±00.35.38; pb andσ(pptqb¯ +X)=2.86±00.63.69; pb
6 HIGGS boson
We combine searches by the CDF and D0 Collaborations for the associated production of a Higgs boson with a W or Z boson and subsequent decay of the Higgs boson to a bottom-antibottom quark pair.
The data correspond to integrated luminosities of up to 9.7f b−1Fig. 12 [22]. The searches are conducted for a Higgs boson with mass in the range 100 - 150 GeV. We observe an excess of events in the data compared with the background predictions, which is most significant in the mass range between 120and135GeV/c2. The largest local significance is 3.3 standard deviations, corresponding to a global significance of 3.1 standard deviations. We interpret this as evidence for the presence of a new particle consistent with the standard model Higgs boson, which is produced in association with a weak vector boson and decays to a bottom-antibottom quark pair [23].
7 New Phenomena
Dijet mass (Kinematic Fit) [GeV]
100 50
0 150 200 250 300 350 400
Events -15 -10 -5 0 5 10
15 Data−Bkgd
Signal 1 s.d. ± Bkgd
RF > 0.5 t t
Double Tag, (d)
D
, 9.7 fb
-1115
1100 120 125 130 135 140 145 150
0.05 0.1 0.15 0.2 0.25 0.3 0.35 0.4 0.45 ) (pb) b b A Br(H ⋅ ) ZH m + WH m ( (GeV) H M Best Fit 1 s.d. ± SM Prediction -1
, 9.5-9.7 fb D
Figure 12. Background-subtracted distribution of the reconstructed dijet mass mj j , summed over all input
channels. TheVZ signal and the background contributions are fit to the data, and the fitted background is subtracted. The fitted VZ and expected SM Higgs,mH=125GeVcontributions are shown with filled histograms
(left). The dark and light-shaded regions indicate the 1 s.d. and 2 s.d. measurement uncertainties, and the SM prediction is shown as the smooth, falling curve with a narrow band indicating the theoretical uncertainty. The expected cross section fit values assuming the SM Higgs boson is present atmH = 125GeV/c2SM rate (dark
blue) and the best fitted rate from data (light magenta) (right).
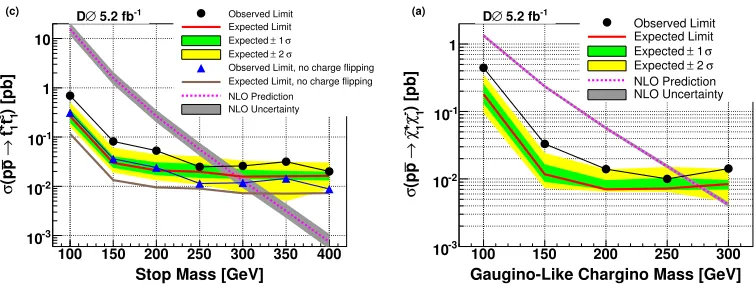
Stop Mass [GeV]
100 150 200 250 300 350 400
) [pb]
- t~1 + t1
~ → p (p σ -3 10 -2 10 -1 10 1 10 Observed Limit Expected Limit σ 1 ± Expected σ 2 ± Expected
Observed Limit, no charge flipping Expected Limit, no charge flipping NLO Prediction NLO Uncertainty -1 5.2 fb ∅ D (c)
Gaugino-Like Chargino Mass [GeV]
100 150 200 250 300
) [pb] - 1 χ∼ + 1 χ∼ → p (p σ -3 10 -2 10 -1 10 1 Observed Limit Expected Limit σ 1 ± Expected σ 2 ± Expected NLO Prediction NLO Uncertainty -1 5.2 fb ∅ D (a)
Figure 13.Search for Stop quark and Gauging-like Chargino masses (left).
supersymmetric particle (NLSP) and is produced in pairs, possibly through decay from heavier su-persymmetric particles. The NLSP can decay either to a Z boson or a photon and an associated gravitino that escapes detection. We exclude this model at the 95% C.L. for SUSY breaking scales of Λ<87T eV, corresponding to neutralino masses of<151GeV.
[TeV]
Λ
SUSY-breaking scale,
70 75 80 85 90 95
[fb]p
σ
95% C.L. limit on signal
0 100 200 300 400 500 600 700 800
) [GeV] 0 1
χ
Lightest neutralino mass, M(
120 130 140 150 160
Observed 95% C.L. Expected 95% C.L. 1 S.D.
±
Expected 2 S.D.
±
Expected Theory
-1
, 6.2 fb ∅ D
resonance mass [GeV] 400 600 800 1000 1200
B [pb]
σ
-2
10
-1
10 1
-1 DØ, 5.3 fb
Topcolor Z’
95% C.L. observed 95% C.L. expected
Figure 14.Search for Neutralino and newZboson decaying into top-antitop pair.
The Tevatron has finished data taking, but the analysis of data with full statistics of reconstructed events will still continue and new results will comme in the next year.
References
[1] Measurement of the Semileptonic Charge Asymmetry using B0 meson mixing with the D0 detec-tor, Phys. Rev. D, arXiv:1208.5813.
[2] Measurement of the Relative Branching Ratio ofB0
sJ/ψf(0980)/f 0 980toB
0
sJ/ψPhys. Rev. D 85,
011103 (2012).
[3] Measurement of theΛ0
bLifetime in the Exclusive DecayΛ
9
b → JψΛ0 Phys. Rev. D 85, 112003
(2012).
[4] Measurement of theB0 Lifetime in the Exclusive DecayB0 J/ψK0
s, Phys. Rev. D 85, 112003
(2012).
[5] Observation of a Narrow State Decaying intoυ(1S)+γ, Phys. Rev. D 86, 031103(R) (2012). [6] Combination of CDF and D0 Measurements of the W Boson mass, Phys. Lett. B 714, 32 (2012). [7] Measurement of the W Boson Mass with the D0 Detector, Phys. Rev. Lett. 108, 151804 (2012). [8] Measurement of the WZ and ZZ Production Cross Sections using Leptonic Final States, Phys.
Rev. D 85, 112005 (2012).
[9] Measurements ofWWandWZProduction inW+jets, Phys. Rev. Lett. 108, 181803 (2012). [10] Measurement of the Inclusive Jet Cross Section in pp Collisions, Phys. Rev. D 85, 052006
(2012).
[11] Measurement of the Photon+b-Jet Production Differential Cross Section in pp Collisions, Phys. Lett. B 714, 32 (2012).
[12] Measurement of the Differential Cross Sectiondσ/dtin Elasticpp¯Scattering at √s=1.96T eV, Phys. Rev. D 86, 012009 (2012).
[13] Measurement of the Top Quark Mass in pp Collisions using Events with Two Leptons,Phys. Rev. D 86 051103(R) (2012).
[14] Measurement of Leptonic Asymmetries and Top Quark Polarization in tt Production, Phys. Rev. Lett.
[16] Combination of CDF and D? Measurements of the W Boson Helicity in Top Quark Decays Phys. Rev. D 85, 071106 (2012).
[17] Evidence for Spin Correlation intt¯Production, Phys. Rev. Lett. 108, 032004 (2012). [18] Improved Determination of the Width of the Top Quark, Phys. Rev. D 85, 091104 (2012). [19] Search for a NarrowTT¯Resonance in pp Collisions at√(s)=1.9T eV, Phys. Rev. D 85, 051101
(2012).
[20] Search for Anomalous Wtb Couplings in Single Top Quark Production, Phys. Lett. B 708, 21 (2012).
[21] Measurement of the Top QuarkσPhys. Rev. D 86 051103(R) (2012).
[22] Search for the standard model Higgs boson in associatedWHproduction in 9.7f b−1of pp¯ col-lisions with the D0 detector, Phys. Rev. Lett. 109, 121804 (2012).
[23] Combined search for the standard model Higgs boson decaying tobb¯, Phys. Rev. Lett. 109, 121802 (2012).
[24] Search for Zγ Events with Large Missing Transverse Energy, Phys. Rev. D 86, 071701(R) (2012).