University of South Carolina
Scholar Commons
Theses and Dissertations
2017
Evaluation Of Multicarrier Air Interfaces In The
Presence Of Interference For L-Band And C-Band
Air-Ground Communications
Hosseinali Jamal
University of South Carolina
Follow this and additional works at:https://scholarcommons.sc.edu/etd Part of theElectrical and Computer Engineering Commons
This Open Access Dissertation is brought to you by Scholar Commons. It has been accepted for inclusion in Theses and Dissertations by an authorized administrator of Scholar Commons. For more information, please [email protected].
Recommended Citation
E
VALUATION OFM
ULTICARRIERA
IRI
NTERFACES IN THEP
RESENCE OFI
NTERFERENCE FORL-
BAND ANDC-
BANDA
IR-G
ROUNDC
OMMUNICATIONSby
Hosseinali Jamal Bachelor of Science Tafresh University, 2008
Master of Science
Shahid Beheshti University, 2012
Submitted in Partial Fulfillment of the Requirements For the Degree of Doctor of Philosophy in
Electrical Engineering
College of Engineering and Computing University of South Carolina
2017 Accepted by:
David Matolak, Major Professor Mohammod Ali, Committee Member Srihari Nelakuditi, Committee Member
Xiaofeng Wang, Committee Member
ii
iii
D
EDICATIONiv
A
CKNOWLEDGEMENTSv
A
BSTRACTThe use of aeronautical vehicles and systems is continuously growing, and this means current aeronautical communication systems, particularly those operating in the very high frequency (VHF) aviation band, will suffer from severe congestion in some regions of the world. For example, it is estimated that air-to-ground (AG) communication traffic density will at least double by 2035 over that in 2012, based on the most-likely growth scenario for Europe. This traffic growth (worldwide) has led civil aviation authorities such as the FAA in the USA, and EuroControl in Europe, to jointly explore development of future communication infrastructures (FCI). According to international aviation systems policies, both current and future AG communication systems will be deployed in L-band (960-1164 MHz), and possibly in C-band (5030-5091 GHz) because of the favorable AG radio propagation characteristics in these bands. During the same time period as the FCI studies, the use of multicarrier communication technologies has become very mature for terrestrial communication systems, but for AG systems it is still being studied and tested.
vi
proposed another OFDM communication system based on the IEEE 802.16e standard, termed aeronautical mobile airport communication system (AeroMACS). This system has been proposed to provide the growing need of communication traffic in airport environments.
In this dissertation, first we review existing and proposed aviation communication systems in VHF-band, L-band and C-band. We then focus our study on the use of multicarrier techniques in these aviation bands. We compare the popular and dominant multicarrier technique OFDM (which is used in cellular networks such long-term evolution (LTE) and wireless local area networks such as Wi-Fi) with the filterbank multicarrier (FBMC) technique. As far as we are aware, we are the first to propose and evaluate FBMC for aviation communication systems.
vii
viii
T
ABLE OFC
ONTENTSDEDICATION ... iii
ACKNOWLEDGEMENTS ... iv
ABSTRACT ... v
LIST OF TABLES ... x
LIST OF FIGURES ... xi
LIST OF ABBREVIATIONS ... xvi
CHAPTER 1:INTRODUCTION ... 1
1.1 BACKGROUND:AIR-TO-GROUND AND AIRPORT SURFACE COMMUNICATION SYSTEMS ... 1
1.2 L-BAND AND C-BAND AERONAUTICAL COMMUNICATION SYSTEMS CHALLENGES AND SOLUTIONS ... 6
1.3 DISSERTATION OBJECTIVES ... 9
1.4 DISSERTATION CONTRIBUTIONS ... 10
CHAPTER 2: AIR-TO-GROUND COMMUNICATION SYSTEMS LITERATURE REVIEW ... 13
2.1 VHF AND L-BAND AGCOMMUNICATION SYSTEMS ... 13
2.2 C-BAND SYSTEMS ... 25
CHAPTER 3: AIR-TO-GROUND ENVIRONMENTS,CHANNELS AND FCICOMMUNICATION SYSTEMS... 28
3.1 ENVIRONMENTS AND CHANNEL MODELS ... 28
3.2 COMMUNICATION SYSTEMS TECHNICAL DETAILS ... 38
ix
4.1 COMPARISON OF FCISYSTEM;OVER-WATER AGCHANNEL AND DME
INTEREFERNCE ... 69
4.2 COMPARISON OF L-DACS AND FBMCPERFORMANCE IN MORE DISPERSIVE CHANNELS ... 83
4.3 PERFORMANCE OF L-DACS1 AND FBMC IN THE PRESENCE OF MULTIPLE DME INTERFERERS IN L-BAND ... 97
CHAPTER 5:L-BAND AIR-TO-GROUND DUAL ANTENNA COMMUNICATION SYSTEM EXAMPLE PERFORMANCE ... 103
CHAPTER 6: C-BAND FBMC FOR AIRPORT SURFACE ENVIRONMENTS ... 111
6.1 INTRODUCTION AND SYSTEM MODELS ... 111
6.2 AIRPORT SURFACE CHANNEL MODELS ... 115
6.3 SIMULATION RESULTS ... 117
CHAPTER 7: SPECTRALLY SHAPED FBMCCOMMUNICATION SYSTEMS... 123
7.1 SS-FBMC ... 124
7.2 SS-FBMCSIMULATION RESULTS ... 130
7.3 COGNITIVE SS-FBMC... 137
7.4 SIMULATION RESULTS ... 140
CHAPTER 8:CONCLUSIONS AND FUTURE WORK ... 145
8.1 DISSERTATION CONCLUSIONS ... 145
8.2 FUTURE WORK... 147
x
L
IST OFT
ABLESTable 2.1. Typical Air-Ground Aeronautical Communication,
Navigation, and Surveillance Systems ... 13
Table 3.1. AG channels IMPC statistical parameters values. ... 34
Table 3.2. L-DACS1 physical layer parameters. ... 50
Table 3.3. L-band FBMC system physical layer parameters.. ... 65
Table 4.1. Designed CP-OFDM based C-DACS system physical layer parameters ... 84
Table 4.2. Designed C-band FBMC system physical layer parameters ... 84
Table 4.3. Intermittent taps On Probability for mountainous and suburban environments ... 85
Table 4.4. Intermittent taps Duration for mountainous and suburban environments.. ... 86
Table 4.5. Intermittent taps Excess Delay for mountainous and suburban environments ... 86
Table 4.6. Statistical RMS-DS values for measured and simulated results in AG channels.. ... 92
Table 6.1. AeroMACS and FBMC physical layer parameters.. ... 114
Table 7.1. FBMC and SS-FBMC physical layer parameters for the L-band... 125
xi
L
IST OFF
IGURESFigure 1.1 L-band systems spectral occupancy. ... 8
Figure 3.1 AG Communication Systems Wideband Channel Model. ... 29
Figure 3.2 Two snapshots of PDPs for different distance ranges in Latrobe: (a) distance 1.5 km; and (b) distance 20 km. (The total number of PDPs, 5000 here, is an example, and can be translated to distance via aircraft velocity and PDP sampling rate, i.e., v~90 m/s and PDP update rate~3 kHz yields a distance range of ~ 150 m for these PDP sequences.)... 36
Figure 3.3 Path Loss vs. distance for the over-sea channel model in Oxnard, CA. ... 37
Figure 3.4 SNR vs. distance for the over-sea channel model in Oxnard CA. ... 38
Figure 3.5 Simulated DME signal in (a) time domain, (b) frequency domain. ... 41
Figure 3.6 L-DACS1 point-to-multipoint communication system. ... 43
Figure 3.7 L-DACS1 subcarriers structure in frequency domain, (a) FL, (b) RL. ... 45
Figure 3.8 L-DACS1 CP-OFDM symbol structure in time domain with Ts=120 μs. ... 47
Figure 3.9 L-DACS1 communication system (physical layer). ... 47
Figure 3.10 L-DACS1 FL frame structure with 6.48 ms duration (54 L-DACS1 symbols) ... 48
Figure 3.11 L-DACS1 RL frame segments structure, (a) DC segment, (b) Data segment ... 49
Figure 3.12 L-DACS2 communication system (physical layer). ... 52
Figure 3.13 Block diagram of FBMC transceiver (applicable to OFDM), (a) Transmitter, (b) Receiver... 54
Figure 3.14 OFDM orthogonal subcarriers. ... 55
xii
Figure 3.16 SMT based FBMC Block Diagram (physical layer),
(a) Transmitter (b) Receiver. ... 62
Figure 3.17 Time–frequency phase-space lattice representation of an SMT system. ... 62
Figure 3.18 FBMC prototype filters with overlapping factor K=4. ... 64
Figure 3.19 SS-FBMC Block Diagram (physical layer), (a) Transmitter (b) Receiver. ... 67
Figure 4.1 BER results without DME interference with channel equalization based on perfect CIR knowledge for over-sea channel. ... 70
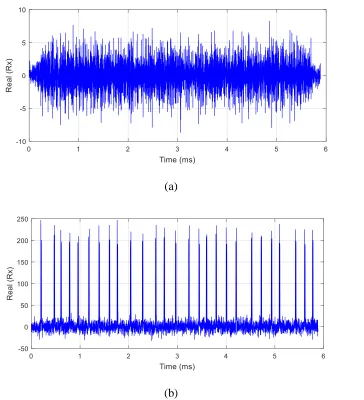
Figure 4.2 One singe frame FBMC signal in the time domain, (a) without DME interference, (b) with DME interference, (c) After applying the PB technique to remove DME pulses, (d) Zoomed in version of a short section of signal in (c) to see the zeroed samples. ... 72
Figure 4.3 BER results in the presence of DME interference, (a) Air-to-ground (RL), (b) Ground-to-air (FL) in over-sea channel ... 74
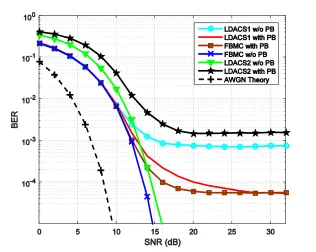
Figure 4.4 DME interference after FBMC and L-DACS1 prototype filters convolution . 76 Figure 4.5 Comparing L-DACS1 and FBMC BER performance with DME interference vs. distance during flight for an over-sea channel for (a) RL scenario, (b) FL scenario ... 79
Figure 4.6 Complementary cumulative distribution function (CCDF) of PAPR for L-DACS1 and FBMC... 80
Figure 4.7 PSD of L-band communication systems (including a zoomed version of the plot around channel boundaries). ... 81
Figure 4.8 RL power spectral density of three communication systems, (a) L-DACS1 (without windowing) (b) FBMC (c) L-DACS2 ... 82
Figure 4.9 RMS-DS suburban Hilly Latrobe, (a) Measured, (b) Simulated ... 88
Figure 4.10 RMS-DS suburban Palmdale, (a) Measured, (b) Simulated ... 89
Figure 4.11 RMS-DS mountainous Telluride, (a) Measured, (b) Simulated ... 90
Figure 4.12 Mean value of RMS-DS at each distance for three environments ... 91
Figure 4.13 Max value of RMS-DS at each distance for three environments ... 91
xiii
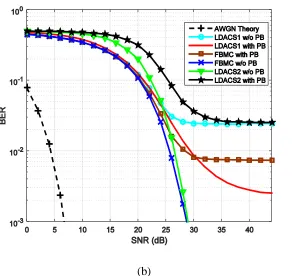
Figure 4.15 BER vs. SNR for C-DACS and FBMC systems in three different AG
channel environments at distance 1 km, modulation QPSK and bandwidth 5 MHz ... 94
Figure 4.16 BER vs. SNR for C-DACS and FBMC systems in three different AG channel environments at distance 7.5 km, modulation QPSK and bandwidth 5 MHz. .... 94
Figure 4.17 BER vs. SNR for DACS and FBMC systems in three different AG channel environments at distance 1 km, modulation 16 QAM and bandwidth 5 MHz .... 95
Figure 4.18 BER vs. SNR for DACS and FBMC systems in three different AG channel environments at distance 7.5 km, modulation 16 QAM and bandwidth 5 MHz . 95 Figure 4.19 BER vs. SNR for DACS and FBMC systems in three different AG channel environments at distance 1 km, modulation 64 QAM and bandwidth 5 MHz .... 96
Figure 4.20 BER vs. SNR for DACS and FBMC systems in three different AG channel environments at distance 7.5 km, modulation 64 QAM and bandwidth 5 MHz . 96 Figure 4.21 Scenario I, FCI GS Between two DME stations, (b) Scenario II, FCI GS at the same DME CH94 location... 98
Figure 4.22 Scenario I, (a) FL BER results, (b) RL BER results, where d=0 km is the location of DME channel 94 and d=250 km is the location of FCI system ... 100
Figure 4.23 Scenario II, (a) FL BER results, (b) RL BER results, where d=250 km is the location of DME channel 94 and FCI systems as well... 102
Figure 5.1 Correlation coefficient (CC) values between two separate receiver antennas, vs. distance and antenna separation, with stationarity distance= 20 m: (a) vs. both link distance and antenna separation; (b) contour plot of (a) at L-band ... 105
Figure 5.2 (a) Latrobe BER results 64-QAM at 1.5 km and 20 km, (b) Palmdale BER results: QPSK and 64-QAM at 1.5 km ... 107
Figure 5.3 Comparison of average BER and correlation coefficient results vs. antenna separation Δd for stationarity distance= 20 m, SNR=12 dB, 64 QAM, 1×2 SIMO, in Latrobe: (a) CC and average BER vs. Δd at distance= 1 km; (b) CC and average BER vs Δd at distance= 1.5 km ... 109
Figure 6.1 Spectral emission mask of AeroMACS transmitter ... 112
Figure 6.2 AeroMACS CP-OFDM subcarriers structure in frequency domain. ... 113
xiv
(b) BW=10 MHz. ... 117
Figure 6.5 Power spectral densities of FBMC and AeroMACS systems ... 118
Figure 6.6 Adjacent channel interference results for QPSK modulation ... 119
Figure 6.7 BER vs. Eb/N0, 5 and 10 MHz bandwidth for 16-QAM, NLOS MIA airport channel with perfect channel knowledge (zero-forcing estimator).. ... 121
Figure 6.8 BER vs. Eb/N0, 5 and 10 MHz bandwidth for 16-QAM, NLOS MIA airport channel with LS + DFT based channel estimation technique. ... 121
Figure 7.1 FBMC (and L-DACS1) spectrum in between two DME channels. ... 126
Figure 7.2 DME interference energy at different subcarriers in FL and RL. ... 128
Figure 7.3 FL subcarriers power mask for different QAM modulations ... 130
Figure 7.4 FL PSDs for different QAM modulations ... 131
Figure 7.5 RL subcarriers power mask for different QAM modulations ... 132
Figure 7.6 RL PSDs for different QAM modulations ... 132
Figure 7.7 FL QPSK BER results, colored curves are the BERs of each subcarrier and the dashed curved is the averaged BER of all subcarriers ... 133
Figure 7.8 FL 16-QAM BER results, colored curves are the BERs of each subcarrier and the dashed curved is the averaged BER of all subcarriers ... 134
Figure 7.9 FL 64-QAM BER results, colored curves are the BERs of each subcarrier and the dashed curved is the averaged BER of all subcarriers ... 134
Figure 7.10 RL QPSK BER results, colored curves are the BERs of each subcarrier and the dashed curved is the averaged BER of all subcarriers ... 135
Figure 7.11 RL 16-QAM BER results, colored curves are the BERs of each subcarrier and the dashed curved is the averaged BER of all subcarriers ... 135
Figure 7.12 RL 64-QAM BER results, colored curves are the BERs of each subcarrier and the dashed curved is the averaged BER of all subcarriers ... 136
Figure 7.13 FL 16-QAM BER results from FBMC, colored curves are the BERs of each subcarrier and the dashed curved is the averaged BER of all subcarriers ... 137
xv
Figure 7.15 Subcarriers positions in cognitive SS-FBMC model ... 140 Figure 7.16 Cognitive SS-FBMC PSD over DME channel ... 141 Figure 7.17 Cognitive SS-FBMC PSD over rectangular pulse channel... 141 Figure 7.18 Guard subcarriers and allocated powers to active subcarriers from
xvi
L
IST OFA
BBREVIATIONSxvii
xviii
xix
xx
xxi
1
CHAPTER 1
I
NTRODUCTION1.1 BACKGROUND: AIR-TO-GROUND AND AIRPORT SURFACE COMMUNICATION
SYSTEMS
Air traffic is continuing to grow. Safely managing significantly larger air traffic densities in the future will require more capable communication systems. One of the best known—but certainly not the only aeronautical communication system—is the system used for air traffic control (ATC). Communications between air traffic controllers and pilots currently use the VHF aeronautical band. These links use Double-Sideband Amplitude Modulation (DSB-AM) and are deployed in the VHF aviation band from 118 to 137 MHz (only 19 MHz entire world). This band is becoming very congested in many busy airspace segments worldwide. Thus, civil aviation authorities recognized the need to look for additional or alternative spectral bands for handling a larger amount of communication traffic in the future. The nearly daily increase of air traffic and associated AG communication system traffic makes it inevitable to require new technologies and communication techniques in future AG communication systems.
2
technology has been developed, investigated, and demonstrated. An overlay system operates simultaneously with the existing legacy VHF systems, sharing portions of the aeronautical VHF spectrum. As a result of this activity, B-VHF has been recognized as a promising technology within the FCI study that was jointly performed by Federal Aviation Administration (FAA) and EUROCONTROL.
Today’s narrowband VHF technologies are using the VHF spectrum allocated for aeronautical safety communications in a highly inefficient manner. Air-traffic control to pilot communication employs analog AM with “manual” channel allocation via frequency division multiplexing (FDM). The B-VHF project investigated the feasibility of broadband MC technology combined with code division multiple access (CDMA) for VHF aeronautical communications. The high-level goal of the B-VHF project was to prove the feasibility of the broadband MC-CDMA technology and demonstrate the benefits of this technology to the aeronautical community. The preferred B-VHF deployment concept anticipates that the new system would be initially operated in parallel with the legacy narrowband VHF systems, virtually using the same part of the VHF spectrum without inter-system interference and without requiring additional spectral resources [1].
B-3
VHF like system could be operated in L-band. The system design for this L-band MC system is described in [2]. B-AMC is based on frequency-division duplexing (FDD) and uses orthogonal frequency-division multiple access (OFDMA) technique instead of MC-CDMA. As part of our work in this dissertation we investigate the potentials of MC systems in C-band both in airport surface or AG mode communications.
As an extension of B-AMC systems, L-DACS1 was proposed as an L-band AG multicarrier system partly based on successful terrestrial broadband MC communication systems such as WiMAX. L-DACS1 uses cyclic prefix OFDM (CP-OFDM) technique. CP-OFDM is an efficient MC modulation technique to combat multi-path fading channels. Technical details will be described in next chapter. L-DACS1 robustness comes from adding guard intervals in the time and frequency domains to combat ISI due to multi-path fading, and Doppler shifts and adjacent channel interference, respectively, but these guard intervals decrease spectral efficiency. In L-DACS1 the time duration of symbols is extended by a significant fraction of the useful symbol time for insertion of a cyclic prefix, and a large number of subcarriers are used as guard bands, which further decreases the AG communication system spectral efficiency. This observation brought the idea of using new technologies and modulation techniques to cope with the challenges of deploying L-DACS1. Disadvantages of L-DACS1 are its relatively low spectral efficiency and high out-of-band (OOB) power, and its low resistance to the OOB power emissions from interference signals, especially DME.
4
has seen renewed interest in recent years because of technological advances and for some of its favorable properties. These properties include very low OOB power and consequent higher spectral efficiency when the number of guard subcarriers is reduced. The lower OOB power makes it more robust in the presence of (adjacent-channel) interference signals such as DME. In our FBMC systems we based the designs on L-DACS1. Our FBMC AG communication systems satisfy essentially all the requirements of L-DACS1. The FBMC systems have similar physical layer parameters as L-DACS1 (e.g., equal total number of subcarriers, subcarrier spacing, and total bandwidth, total transmit power, etc.). The main difference between FBMC and L-DACS1 is the use of prototype filters on each subcarrier; use of this filtering technique produces all the FBMC advantages. The main drawback of FBMC is its complexity: because of the more complex filtering processing at all subcarriers, complexity is larger than that of L-DACS1. Yet in FBMC by using polyphase network technique we can reduce the complexity significantly, but still it is in the order of four times higher than CP-OFDM techniques such as L-DACS1. But by today’s faster processors the complexity of using FBMC is a minor issue.
5
operation [9]. This “aviation profile” defines specifics of the 802.16e standard for airport surface use, and is denoted AeroMACS [26]-[28].
Although AeroMACS has been rapidly expanding worldwide, as in other areas of communication, such as cellular, new developments and improvements continue. For cellular, so called 5th generation (5G) systems are being planned. These new systems aim at improving spectral efficiency and increasing data rate via multiple techniques, including large antenna arrays, new spectral allocations, and new physical-layer (PHY) techniques [10]. It is the latter area we consider here for the ASA. Therefore in this dissertation, we also consider the use of more spectrally-efficient FBMC instead of the OFDM employed in AeroMACS.
C-6
band investigations we also design similar technique communication systems based on CP-OFDM and FBMC with 5 MHz bandwidth. We named the CP-OFDM C-band system C-DACS which has the same subcarrier spacing and total symbol length as L-DACS1. And we also designed similar FBMC based system as C-DACS for C-band. We will explain C-DACS and C-band FBMC systems later in detail.
1.2 L-BAND AND C-BAND AERONAUTICAL COMMUNICATION SYSTEMS CHALLENGES AND NEW SOLUTIONS
7
available spectrum. It is expected that at least some future AG communication systems will be deployed in the L-band (960-1164 MHz), allocated by the International Telecommunication Union (ITU).
Here we describe the L-band spectrum and the communication and navigation systems allocated in the aeronautical L-band, with which any L-DACS or FBMC system must coexist. Figure 1.1-a shows the overall view of the current communication systems that use the L-band. As noted, it was decided to allocate the L-DACS channels in an “inlay” approach with respect to the existing DME system (Figure 1.1-b). This means that L-DACS channels lie between DME channels in frequency. As we see in Figure 1.1-a, major portions of this L-band spectrum have been allocated to the DME signals. DME signals are used for radio navigation purposes, and they are still being studied as the main candidate for future Alternative Positioning, Navigation, and Timing (APNT) systems (where “alternative” here means alternative to GPS) [12]. Each DME channel has a 1 MHz bandwidth (BW), and the DME signal is generated using Gaussian shaped pulses. In Figure 1.1-a, there are also additional transponder systems known as legacy systems: secondary surveillance radar (SSR), Universal Access Transceiver (UAT), Galileo/GPS satellite signals. Any new FCI system must inter-operate with these systems.
8 (a)
(b)
Figure 1.1. L-band systems spectral occupancy, (a) Overall view, (b) L-DACS inlay diagram (between DME channels).
As mentioned, there are at present two FCI proposals for this L-band spectral region, L-DACS1 [13] and L-DACS2 [14]. These waveforms may also be used for unmanned aircraft systems (UAS) which are seeing explosive growth in both commercial and consumer use. These UAS have a large variety of applications, and integration of them into the worldwide airspace will require reliable and spectrally-efficient waveforms. As noted, the L-DACS1 system is similar to IEEE 802.16 and the physical layer is based on the CP-OFDM modulation technique.
L-DACS2 is a single carrier communication system similar to the GSM, the physical layer of which uses Gaussian Minimum Shift Keying (GMSK) modulation. In-depth studies have been done to compare L-DACS1 and L-DACS2 [15]-[23]. In this
GSM SSR SSR
Galileo/GPS DME
DME DME DME
Freq
960 978 1025 1035 1085 1095 1150 1164 1213
UAT JTIDS
969 1008
JTIDS
1053 1065
JTIDS (MIDS)
1113 1213
L-DACS2 L-DACS1 FL L-DACS1 RL
DME DME DME DME
9
dissertation we also study and compare L-DACS2 systems’ physical layer performance with our new FBMC designs.
C-band aeronautical communication systems have also been studied and adapted for AG communication systems, especially for airport surface communications purposes. In next chapter we will provide a review of existing and proposed, and our new L-band and C-band systems, and the potentials of using new waveform such as FBCM in this band.
1.3 DISSERTATION OBJECTIVES
In this section, a list of the dissertation objectives is presented.
1. [Chapter 2] Perform a literature review of air-to-ground communication systems in VHF, L-band and C-band. In this chapter we provide a table and list all existing or proposed communication systems in these bands.
2. [Chapter 3] Describe the details about the AG environments and communication systems channels. We also provide more technical information about FCI systems in this chapter.
10
4. [Chapter 5] Chapter 5 contains some part of our work to study the potentials of using dual antenna multicarrier communication system in L-band.
5. [Chapter 6] In this chapter we investigate the FBMC system proposal for airport surface environment and compare it with current communication standard; AeroMACS.
6. [Chapter 7] In chapter 7 we show the details and results of our spectrally shaped FBMC system as part of performance enhancement of our conventional FBMC system in non-white noise situation across the channel (such as coexistent with DME channels as inlayed scenario). In this chapter we also study the potentials of using SS-FBC as a cognitive radio approach for AG systems.
7. [Chapter 8] Chapter 8 contains the conclusions and future work.
1.4 DISSERTATION CONTRIBUTIONS
The project “Unmanned Aircraft Systems (UAS) Research: The AG Channel, Robust Waveforms, and Aeronautical Network Simulations,” started in 2011 and ended in 2016. We have 1 published IEEE journal paper and 11 conference papers published or submitted1. Currently we are working on another journal paper which will contain some part of the results in the final chapter. In addition to the NASA project, I have three papersfocusing on FBMC and cognitive radio systems.
[J1] H. Jamal, D.W. Matolak, “FBMC and LDACS Performance for Future Air to Ground Communication Systems,” IEEE Transactions on Vehicular Technology, vol. 66, no. 99, pp. 5043-5055, June 2017.
[C1] H. Jamal, D. W. Matolak, “Spectrally Shaped Filter Bank Multicarrier Systems for
11
L-band Aeronautical Communication Systems,” IEEE Aerospace Conference, pp. 1-15, Big Sky, MT, 4-11 March, 2017.
[C2] H. Jamal, D. W. Matolak, “Performance of L-band Aeronautical Communication System Candidates in the Presence of Multiple DME Interferers,” IEEE/AIAA 35th Digital Avionics Systems Conference (DASC), Sacramento, CA, September, 2016. (Won the best of session paper award).
[C3] H. Jamal, D. W. Matolak, “Multicarrier Air to Ground MIMO Communication System Performance,” IEEE 84th Vehicular Tech. Conference (VTC Fall), Montréal, September, 2016.
[C4] H. Jamal, D. W. Matolak, “Channel Estimation in an Over-water Air-Ground Channel Using Low Complexity OFDM-OQAM Modulations,” IEEE Consumer Communications and Networking Conference (CCNC), Las Vegas, NV, USA, 13-17 January, 2016.
[C5] H. Jamal, D. W. Matolak, R. Sun “Comparison of LDACS and FBMC Performance in Over-Water Air-Ground Channels,” IEEE/AIAA 34th Digital Avionics Systems Conference (DASC), pp. 2D6-1-2D6-9, Prague, CZ, 13-17 September, 2015.
[C6] H. Jamal, D. W. Matolak, R. Sun “Enhanced Airport Surface Multi-carrier Communication Systems: Filterbank Advantages over AeroMACS OFDM,” IEEE Military Communications Conference (MILCOM), Baltimore, MD, October 2017.
[C7] D. W. Matolak, R. Sun, H. Jamal, W. Rayess, “L- and C-Band Airframe Shadowing Measurements and Statistics for a Medium-Sized Aircraft,” 11th European Conference on Antennas and Propagation (EuCAP), pp. 1429-1433, Paris, 19-24 March 2017.
12
Matolak, R. Sun, “Modeling the Air-Ground Multipath Channel,” 11th European Conference on Antennas and Propagation (EUCAP), pp. 1434-1438, Paris, France, 19-24 March 2017.
[C9] N. Schneckenburger, et al. “A Geometrical-Statistical Model for the Air-Ground Channel”, to appear, IEEE/AIAA 36th Digital Avionics Systems Conference (DASC), 17-21 September, St. Petersburg, FL, USA, 2017. (Won the best of session paper award).
[C10] D. W. Matolak, H. Jamal, R. Sun, “Spatial and Frequency Correlations in Two-Ray Air-Ground SIMO Channels”, IEEE International Conference on Communications
(ICC), Paris, France, 21-25 May 2017.
13
CHAPTER 2
A
IR-
TO-G
ROUNDC
OMMUNICATIONS
YSTEMSL
ITERATURER
EVIEW2.1 VHF AND L-BAND AG COMMUNICATION SYSTEMS
Some of the typical air-ground aeronautical communications systems and technologies are listed in Table 2.1. The aircraft communications addressing and reporting system (ACARS) may be viewed as one of the pioneers for modern AG communications systems. It was developed in 1978 to be used in the very high frequency (VHF) band. Its modulation technique is amplitude modulation (AM) [29]. It was implemented to transmit voice signals over radios with bandwidth of approximately 3 kHz and to provide communications for flight services and operational activities such as air traffic control (ATC), aeronautical operational control (AOC), and airline administrative control (AAC) system functions.
Table 2.1. Typical Air-Ground Aeronautical Communication, Navigation, and Surveillance Systems.
Name Band BW
Modulation/ Multiple
Access
Data
Rates Designer Year Comments
Distance Measuring Equipment (DME) [36]
L-band, 960-1215 MHz 1 MHz/ channel Gaussian shaped pulses 50-3600 pulse pairs per second (ppps)
Invented by James Gerrand 1950s
Transponder-based radio navigation technology that measures slant range distance ATC Voice VHF, 118-137 MHz
8.22 or 25 kHz (760 channels each 25 kHz)
Analog AM
Push to talk system for voice and air traffic control (ATC) Aircraft Communications Addressing and Reporting (ACARS) [29]
VHF, 118-137 MHz 3 kHz/ channel AM and Minimum-Shift Keying (MSK) 2.4 kbps
14
VHF Digital Link (VDL) Mode 2,3 and 4 [31]
VHF, 118-137 MHz 19 MHz (25kHzX760 channels) D8PSK/ TDMA 31.5 kbps Aeronautical Mobile Communications Panel (AMCP) under EUROCONTROL [33] 1990s Upgraded from ACARS. For aeronautical operational control (AOC) and air traffic services (ATS) data services. VDL Mode 4 aircraft to aircrafts communicatio ns Universal Access Transceiver (UAT) [34]
L-band, 978 MHz 1 MHz CPFSK (GMSK)/ TDMA
1 MHz 2002
Designed for surveillance, Automatic Dependent Surveillance — Broadcast (ADS-B) 1090ES (1090 MHz Extended Squitter) or Secondary surveillance radar (aka Mode-S) [34]
L-band, 1030, 1090 MHz 3 MHz CPFSK (GMSK)/ TDMA
1 MHz 2002
A multi-functional surveillance and communicatio n system designed as a surveillance improvement for Mode A/C secondary surveillance radar (SSR)
Project 34 (P34)
[35] 767-773 MHz (Forwar d Link) 797-803 (Reverse Link) 5.4 kHz/sub-channel X 8, 16, 24 channels = 50, 100,150 kHz
OFDM 100-500 kbps Electronic Industry Association (EIA) & Telecommunicatio ns Industry Association (TIA) 2003 Designed for public safety; candidate for future aeronautical communicatio ns (not implemented to date) Broadband VHF (B-VHF) [32]
VHF, 118-137 MHz 2 kHz/ subcarrier MC-CDMA+OFD M/ FDD, TDD European 6th Framework (FP6) program 2006 For providing ATS, ATC, ATM and AOC voice and data link services simultaneousl y. (not implemented to date) Broadband Aeronautical Multi-Carrier System (B-AMC) [37] L-band, 980-1140 MHz 10.416 kHz/ kHz/sub-carrier × 48 sub- carriers = 500 kHz OFDM/ FDD 270 kbps- 1.4 Mbps FAA &
EUROCONTROL 2007
Upgraded from B-VHF (not implemented to date) L-band Digital Aeronautical Communication System of Type 1
(L-DACS1) [38],[39] L-band, 960-1164 MHz 9.76 kHz/sub-carrier × 51 sub-carrier = 498 kHz each
OFDM/ FDD ~ 0.2-1.37 Mbps
EUROCONTROL 2009
15 implemented to date) L-band Digital Aeronautical Communication System of Type 2 (L-DACS2) [40]
L-band, 960-975 MHz
200 kHz/
channel GMSK/ TDD ~ 270
kbps EUROCONTROL 2009
One of the FCI candidates for AG systems. Based on GSM, UAT and VDL Mode 2 (not implemented to date)
Microwave Landing System (MLS) [41]
C-band, 5031-5090.7 MHz 300 kHz Differential Binary Phase Modulation
FAA, NASA &
US DOD 1980s
All-weather, precision but short range landing system. Advancement of GPS forced MLS installation to be halted and finally in 1994 completely canceled by the FAA organization. Advanced Airport Data Link (ADL) [24] 5146.5
MHz 8.192 MHz MC-CDMA 128 kbps/ user
German aerospace center (DLR) 2002
Provide the information exchange necessary to establish advanced airport surface movement guidance and control system (A-SMGCS). (not implemented to date)
AeroMACS [42], [43] C-band, 5095-5145 MHz 5 MHz/ channel OFDM/ TDMA Max 25 Mbps Radio Technical Commission for Aeronautics (RTCA) 2010 all-IP network system designed to support mobile speeds up to 370 km/h for airport surface communicatio n systems
C-DACS [102] 5 GHz
15 kHz subcarriers, 960 MHz total
Channel
OFDM,
SC-FDMA EuroControl, DLR 2017 Not implemented to date. Control and Non-Payload Communications (CNPC) L-band, 960-977 MHz & C-band, 5030-5091 MHz Being designed Radio Technical Commission for Aeronautics (RTCA) under US DOT
16
For increasing the capacity and improving the performance of AG communication systems, the VHF digital link or VHF data link (VDL) standards were defined by the aeronautical mobile communications panel (AMCP) under EUROCONTROL in the 1990s [31]. The 19 MHz bandwidth allocated to aeronautical communications in the VHF band (118-137 MHz) is also used for VDL applications. VDL systems use differential 8-phase shift keying (D8PSK) modulation with the time division multiple access (TDMA) technique. The VHF band for VDL is divided into 760 channels with 25 kHz for each channel [31].
Universal access transceiver (UAT) and 1090 MHz Extended Squitter (1090ES), also known as Mode S, are two link solutions in the physical layer for automatic dependent surveillance - broadcast (ADS-B) services. ADS-B is a surveillance technology in which an aircraft determines its position via satellite navigation and periodically broadcasts it, enabling it to be tracked. The information can be received by air traffic control ground stations as a replacement for secondary radar. It can also be received by other aircraft to provide situational awareness and allow self-separation [34]. ADS-B is “automatic” in that it requires no pilot or external input. It is “dependent” in that it depends on data from the aircraft’s navigation system.
Project 34 (P34) [35] was designed for public safety purposes and was another candidate for future aeronautical communications, but which has not been implemented to date. Its air interfaces use multiple sub-channels in OFDM modulation with root raised cosine (RRC) filtering.
17
code division multiple access (MC-CDMA) technique [32]. B-VHF multicarrier technique uses subcarrier spacing of 2 kHz. The B-VHF system has not been implemented.
EUROCONTROL and FAA tasked the broadband aeronautical multi-carrier communications system (B-AMC) consortium to adapt the B-VHF system to L-band use and perform investigations to determine if and how a possible B-VHF like system could be operated in L-band. The preferable B-AMC L-band deployment is between successive DME channels, i.e., with 500 kHz offset from the regular DME channel assignments [37]. DME is a transponder-based radio navigation technology that measures slant range distance by timing the propagation delay of VHF or UHF radio signals [36]. In most of our work in this dissertation we studied and simulated DME as main interference signal to investigate FCI systems in different situations and scenarios.
18
channels is not always acceptable. In this dissertation, for improving the L-band aeronautical communication systems’ spectrum utilization efficiency and performance, we study an FBMC based communication link based on L-DACS1, and investigate its advantages as a promising communication system for FCI.
Here we review some of the main studies regarding L-DACS systems and FBMC. In [15], [16] specification of the L-DACS1 physical layer is presented, covering both the deployment as an inlay and as a non-inlay system. Inlay means that the L-DACS channels lie between adjacent DME channels, whereas “non-inlay” means that the L-DACS channel center frequencies are selected without regard to DME (or other) systems. In addition to the transmitter design, the design of the L-DACS1 receiver was addressed, including methods for mitigating interference from DME systems. The results in [15] show that L-DACS1, properly configured, is capable of operating even under severe interference conditions, hence confirming the feasibility of the inlay concept. Yet, improvements to L-DACS1 can be made in several areas that we address in our work. Reference [16] shows the advantages of L-DACS1 over current legacy systems used for today’s voice communication in the VHF-band; the conclusion is that current legacy systems are incapable of meeting the demands of increasing air traffic and its associated communication load.
19
legacy systems are: DME, SSR, UAT, Galileo/GPS satellite signals. In [17] the L-DACS1 laboratory demonstrator implementation was described. Functional tests showed proper working of the baseband unit, and preliminary RF tests indicated that the final demonstrator is capable of fulfilling the L-DACS1 specifications. In [18], investigations of the L-DACS1 system performed by computer simulations have shown the suitability of the L-DACS1 design even for the challenging inlay scenario, hence L-DACS1 is expected to work based on the requirements without causing harmful interference to the legacy L-band systems. Still, as noted, improvements can be made. With the developed implementation of the L-DACS1 physical layer lab demonstrator in [18], tests (at the IF level) have also shown both the functionality of the hardware implementation and the accuracy of the implementation with respect to spectral mask and signal constellation requirements.
20
traffic but less suitable for data. Terrestrial GSM base stations may cause significant interference with the L-DACS systems as well. Again L-DACS2 is more susceptible to such interference because its spectrum is very close to that of GSM. The effect of multiple GSM transmitters near the L-DACS ground stations remains to be analyzed.
In [20] the authors studied the impact of L-DACS2 on the DME system. They quantified the impact of an L-DACS2 interferer on the performance of a DME victim receiver, via computer simulations and laboratory measurements. Simulation results derived the required signal-to-interference ratio (SIR) for L-DACS2 not to cause harmful interference to the DME system.
In [21], the issues with L-DACS1 and L-DACS2 for use in Unmanned Aircraft Systems (UAS) were discussed. The authors discussed several issues in UAS datalink design including availability, networking, preemption, and chaining. They also proposed ways to mitigate interference with other L-band systems. Their conclusion is that a design with multi-carrier modulation and time-division duplexing would be more suitable than either L-DACS versions. Finally they showed how multiple aeronautical applications using the same L-band can co-exist and avoid interference using collaborative and non-collaborative strategies.
The authors of [22] investigated the synchronization process in L-DACS1, when deploying it as an inlay system in the spectral gaps between two adjacent DME channels. They showed how the synchronization suffers from DME interference. They also described interference mitigation techniques and their influence on synchronization.
21
reconstructing and subtracting inter-carrier interference (ICI), which of course increases receiver complexity. In [23], ICI induced by PB is subtracted based on a reconstruction of the subcarrier spectra after PB and an estimation of the transmitter data symbols and the channel coefficients of each subcarrier. In [45] the authors derived a model for characterizing the DME impact on L-DACS1, without carrying out extensive simulations, and their results showed good agreement with detailed realistic simulations. They noted that careful frequency planning is still needed under certain conditions.
In [46] the authors proposed a fast filter bank (FFB)-based channelizer for L-DACS1. Their work does not consider any attempt to shape the spectrum of the transmitted signal as we propose in this work, but rather they applied filtering to the received signal to lower the OOB power levels to suppress interference from neighboring L-DACS1 or DME signals. They show that use of FFB reduces complexity by 49% to 85% over conventional filtering methods, and also offers faster filtering without compromising filtering performance.
Recently most of the research related to L-DACS systems has been concentrated on DME interference effects on L-DACS systems and methods to mitigate the effect of DME interference on L-DACS systems, [47]-[50]. This highlights the importance of our FBMC based communication system that can better suppress the DME interference than L-DACS systems.
22
reconstruct the deformed pulse pairs (DPPs), which are often overlapped and have various parameters. First, a filter bank and a correlation scheme are jointly used to detect non-overlapped DPPs, and a weighted average scheme is used to automatically measure the waveform of DPP. Second, based on the measured waveform, sparse estimation is used to estimate the precise positions of DPPs. Finally, the parameters of each DPP are estimated by a non-linear estimator. Numerical simulations show that compared with existing work, the proposed approach is more robust, closer to an DME interference free environment and L-DACS1 bit error rate is reduced compared to when no DME mitigation technique were applied. But this method costs very high complexity at receiver.
23
In [50], taking LTE as an example of prospective technology for aeronautical radio communications, the authors establish an aeronautical LTE communication link model and study the DME impact on it through analyzing their coexistence. This article adopts the Monte-Carlo simulation method to perform the co-existence interference study, and results show how the performance of the aeronautical LTE system is affected.
We now turn to a literature review focused on FBMC. Different classes of FBMC systems have been studied in the literature. The first proposal was done by Chang in the 1960s [5], who presented the conditions required for signaling a parallel set of pulse amplitude modulated (PAM) symbols through a bank of overlapping vestigial side-band (VSB) modulated filters. A year after Chang’s work, Saltzberg extended the idea and showed how Chang’s method could be modified for quadrature amplitude modulated (QAM) symbols [6]. In 1980, Hirosaki proposed an efficient polyphase implementation for the Saltzberg method [51].
The method proposed by Saltzberg is referred to as OFDM based on offset QAM or OFDM/OQAM, which has been widely cited in current FBMC system literature, and which we also employ in our proposed systems. A book on filter banks and multirate systems, including the mathematical signal processing, is [52].
24
A review comparing OFDM and FBMC systems exists in [54]. In this article, the author addressed the shortcomings of OFDM in different applications and showed that FBMC could be a more effective solution. Applications were primarily terrestrial and cognitive radio.Based on [54]FBMC systems outperform OFDM in the following areas:
In the uplink of an OFDMA network, an almost perfect carrier synchronization of signals from different transmitting nodes is necessary. FBMC systems achieve signal separation through filtering, thus avoiding the need for (close to) perfect carrier synchronization. Separation of the different users’ signals through a filtering process also avoids the need for any timing synchronization between the users.
In cognitive radio applications, FBMC can outperform OFDM because of using well-localized subcarrier filtering to fill the spectrum holes.
OFDM is known to be sensitive to fast variations of the communication channels. FBMC systems, on the other hand, can be designed to be equally robust to channel time and frequency spreading. Such designs are based on isotropic orthogonal transform algorithm (IOTA) prototype filters.
On the other hand, OFDM has a number of desirable features, including lower complexity of implementation. Moreover, while OFDM can be easily adopted for MIMO channels, development of MIMO-FBMC systems/networks requires more signal processing.
25
spectrum shape with lower out of band power. Actually the idea of using CP in FBMC was proposed to mitigate the channel delay spread in very highly frequency selective channels with long multipath delays. Based on studies in the literature, adding a CP to FBMC is not as straightforward as in OFDM. In order to add a CP to FBMC we need to change the structure of the FBMC system. It is known that after adding a CP to FBMC the “perfect” spectral shape of FBMC is significantly degraded. Authors in [55] showed that their newly proposed CP-based FBMC system has the best power spectral density (PSD) shape with lowest out of band power among the all CP based FBMC systems that they reviewed in the paper, and this is at the cost of larger data overhead.
In [59] the authors directly optimized the FBMC filter impulse-response coefficients to minimize stopband energy and constrain the inter-symbol interference (ISI) and inter-carrier interference (ICI). Their numerical results showed that the optimized filters achieve significantly lower stopband energy than those attained by other popular techniques such as frequency sampling and windowing based techniques.
In our first published papers [3], we proposed a new communication system for FCI systems, according to L-DACS requirements. This communication system is based on the FBMC technique, and to the best of our knowledge it was the first study to propose use of FBMC for AG applications. In this dissertation we investigate this system in depth and compare it with the L-DACS candidates based on our publications [3], [4], [60]-[65].
2.2 C-BAND SYSTEMS
26
dual-band links that employ both C-band and L-band are of interest. In this configuration, the L-band can transmit low rate messages and provide large coverage while the C-band is used to transmit higher data rate signals such as video at relatively short distances.
The microwave landing system (MLS) [41] may be the earliest C-band aviation application. It was designed in the 1980s and uses a signal bandwidth as large as 300 kHz. Advancements of the global positioning system (GPS) forced MLS installation to be halted and finally in 1994 completely canceled by the FAA organization, although as noted, some MLS systems are still in use.
27
OFDM with the Code Division Multiple Access (CDMA) technique. This system has not been implemented.
28
CHAPTER 3
A
IR-
TO-G
ROUNDE
NVIRONMENTS,
C
HANNELS ANDFCI
C
OMMUNICATIONS
YSTEMS3.1 ENVIRONMENTS AND CHANNEL MODELS
The AG channel models we employ in our studies and simulations are based upon measurements conducted by NASA Glenn Research Center for different environments in the USA: over-sea (Oxnard, CA), mountainous (Telluride, CO) and hilly/desert suburban terrains (Palmdale, CA, and Latrobe, PA) [66]-[70]. In this dissertation we also use the channel model of a large size airport in Ohio [86] which was modeled based on one of these NASA measurements. For AG case all measurements were made using a medium-sized aircraft, at altitudes ranging from approximately 500 m to 1.9 km, with a ground site (GS) antenna height of 20 m. Aircraft antennas were monopoles mounted on the aircraft underside. Measurements were made in both the aeronautical L- and C-bands simultaneously. Flight paths were at nearly constant altitude and velocity (which ranged from approximately 90-100 m/s). See [66]-[70] for more detail on the measurements.
29
resulting in a strong LOS component in the received signals. The second strongest component was usually the reflected signal from the earth surface. This surface reflection is very strong in over-water channels but is significantly attenuated in rough terrain environments such as mountain and woodland environments. Other reflected signals with relatively higher delays due to intermittent multipath components (IMPC) from reflections were also observed; these are incorporated in the simulated channel models. These intermittent multipath components generally have a low probability of occurrence, hence for more “open” settings with a strong surface reflection (such as over-water), the CIR or power delay profile (PDP) of the channel is very similar to the two-ray channel model [66]. In Figure 3.1 we show a general view of the channel environment in AG communication systems.
Figure 3.1. AG Communication Systems Wideband Channel Model.
Ground station
LOS
Ground Reflected
IMPC #1
30
In a LOS setting, we can calculate the path loss or received power (assuming known transmitter power) based on Friis transmission equation. Followed by NASA measurements, empirical path loss as a function of link range (R) is found by [67],
𝑃𝐿(𝑅) = 𝑃𝑡+ 𝐺𝑡+ 𝐺𝑟+ 𝐺𝐻𝑃𝐴+ 𝐺𝐿𝑁𝐴− 𝐿𝐶− 𝑃𝑟(𝑅) (3.1)
where Pt denotes transmitted power in decibels above one milliwatt (dBm); Gtand Grare
the dynamic GS antenna and aircraft antenna gains as functions of azimuth and elevation angles in decibels relative to isotropic antenna gain (dBi); GHPA and GLNA denote the
gains of the Tx high-power amplifier (HPA) and the Rx low-noise amplifier (LNA), respectively in decibels; LC is the cable loss in decibels; and Pr(R) denotes the measured
received power at link range R in dBm. The classic log-distance path loss model follows [67]:
𝑃𝐿(𝑅) = 𝐴0+ 10𝑛𝑙𝑜𝑔10( 𝑅
𝑅𝑚𝑖𝑛) + 𝑋 (3.2)
where A0 in decibels denotes the path loss at the minimum link range Rmin, n is the dimensionless path loss exponent, and X denotes a zero-mean Gaussian random variable with standard deviation σX. These parameters and values were presented in [66]-[68] for
different AG environments.
In our AG communication systems the CIR between each transmitter and receiver antenna pair is defined as function ℎ(𝜏; 𝑡) which represents the response of the channel at time t to an impulse input at time 𝑡 − 𝜏 [66], here in complex baseband form,
ℎ(𝜏; 𝑡) = ∑ 𝑧𝑘(𝑡)𝛼𝑘(𝑡)𝑒𝑗𝜑𝑘(𝑡)𝛿[𝜏 − 𝜏
𝑘(𝑡)] 𝑁−1
𝑘=0 (3.3)
31
the received amplitude, 𝜏𝑘(𝑡) the time-varying delay, 𝜑𝑘(𝑡) the phase and 𝑧𝑘(𝑡) 𝜖 {0,1}
denotes the presence or absence of an MPC, i.e., z describes the on/off (birth/death) effect of kth multipath component. The on probability of 𝑧𝑘(𝑡) generally decreases as the delay, or tap (k) index increases. In (3.3) the phase is given by,
𝜑𝑘(𝑡) = 𝜔𝐷,𝑘(𝑡)[𝑡 − 𝜏𝑘(𝑡)] − 𝜔𝑐𝜏𝑘(𝑡), (3.4)
which depends on the time varying Doppler shift of the kth MPC, 𝜔𝐷,𝑘(𝑡) = 𝑣(𝑡)𝑓𝑐cos[𝜃𝑘(𝑡)]/𝑐, where v(t) is the relative velocity of the aircraft, 𝜃𝑘(𝑡) is the aggregate phase angle of all components arriving in the kth delay bin (modeled as uniformly distributed over [0, 2π] for k>2), and c is the speed of light. Using CIR model (3.3), for different environment we can define a tapped delay line (TDL) model that we use in our simulations in order to estimate AG communication system performance. The TDL is a time-varying, linear, finite impulse response (FIR) filter. For the CIR in (3.3) there is another parameter reported in [66]-[68]; MPC duration (Dk). This parameter
describes the “on” duration of an IMPC, and this can be expressed in either time or distance units (as they are related by flight velocity).
32
decibels were modeled in [66]-[68] versus link range in kilometers for different environments as,
𝐾(𝑅) = 𝐾0+ 𝑛𝐾(𝑅 − 𝑅𝑚𝑖𝑛) + 𝑌, (3.5)
where K0 denotes K(R) at the minimum link range Rmin, nK denotes the slope, and Y
denotes a zero-mean Gaussian random variable with standard deviation σY. We note that
based on these measurements K-factor values are different for L-band and C-band with C-band values approximately twice those of L-band (in dB).
In (3.3), the higher-indexed (k>2) components refer to IMPCs, which usually have much smaller relative powers. Based on analysis and results in [66]-[70] each IMPC has different duration and probability of occurrence as a function of distance, and we can employ these features in our CIR model of each environment.
The parameters 𝑧𝑘, 𝜏𝑘 and Dk are functions of the GS local environments and were
found to exponentially change over link range R. Based on aggregate results of two C-band receivers and multiple flight tracks in each environment, the values of on
probability and statistics (maximum, median, and mean) of Dk and 𝜏𝑘 were collected for
1-km link range bins of each multipath component in [66]-[68]. The authors proposed a linear model to quantify the variation of these parameters, which follows:
𝑙𝑜𝑔10(𝑦) = 𝐶0+ 𝑛𝑦𝑅 + 𝑍, (3.6)
where y denotes either the on probability of the kth tap (P(𝑧𝑘) = 1), 𝜏𝑘, or Dk; C0 denotes the value at minimum range Rmin; ny is the slope; and Z is a zero-mean Gaussian random
variable with standard deviation σZ. In this dissertation we used this model to simulate the
33
In multipath wireless channels, the root mean square delay spread (RMS-DS) is one important parameter that describes the delay or time spreading severity of the channel. In discrete time processing of RMS-DS first we align CIRs so that the LOS component has zero delay. With this CIR delay initialization, the RMS-DS is calculated as follows,
𝜎𝜏 = √∑𝑁−1𝑘=0𝛼𝑘2𝜏𝑘2
∑𝑁−1𝑘=0𝛼𝑘2 − 𝜇𝑘
2, (3.7)
where 𝜇𝜏 is the mean excess delay and is given by,
𝜇𝜏 = ∑𝑁−1𝑘=0𝛼𝑘2𝜏𝑘
∑𝑁−1𝑘=0𝛼𝑘2 (3.8)
For calculating the reflected signal over the earth surface in (3.3), we have two deterministic geometric models: the flat earth two ray (FE2R) and curved earth two ray (CE2R) models [66]. In the FE2R model we assume the ground is a flat surface, but the
CE2R model is more realistic, particularly as link distance increases, since it accounts for the curvature of the earth. In all parts of our simulations the Ref component is calculated based on the CE2R model. Therefore the LOS and surface reflected components are computed via the link geometry and electrical parameters of the earth’s surface; these two components are hence mostly deterministic.
The IMPC power values (𝛼𝑘), over all environments, were found to have relative powers well modeled by a Gaussian distribution, with relative mean value denoted 𝜇𝑘 =
10𝑙𝑜𝑔 ( 𝛼𝑘2
𝛼𝐿𝑂𝑆2 ) dB, and standard deviation denoted 𝜎𝑘 dB [66]-[68]. Table 3.1 lists the
IMPC Gaussian power parameter values, maximum number of MPCs (N), maximum RMS-DS (), maximum IMPC duration (Dmax) (typically for the third component), and
34
environments based on measurement results. In chapter 4 we provide more details about these channels.
Table 3.1. AG channels IMPC statistical parameters values
Environments µ σ N Max (ns) Dmax (s) Pmax
Over-sea, Oxnard (CA) [66] 27.4 3.0 3 364.7 0.06 0.027 Mountainous Telluride (CO) [67] 26.4 3.6 7 177.4 1.16 0.176 Suburban Hilly Latrobe (PA) [68] 30.3 4.1 9 1190.8 - - Suburban Desert Palmdale (CA)
[68]
23.3 5.1 9 4242.9 - -
The following 10 steps describe the algorithm of generating the TDL model MPC samples for the AG channel models, from [67] and [68]:
1. Initialize Dk = 0 for all values of k (3, 4, . . . , N).
2. For a given value of link range R or time t, implement the LOS and ground reflection component if present [the first and second terms in (3.3)]. Note that the ground reflection is often very weak in the hilly/mountainous terrain.
3. For k = 3 to N (each tap index), if k=3 go to step 4; if k ≥4 and zk−1(R) = 0, go to step 2 and update link range R for that tap index; if k ≥4 and zk−1(R) = 1, go to step 4.
4. If Dk= 0, go to step 5; if Dk > 0, go to step 7.
5. From a distribution specified by (3.2) and tables exist in [66]-[68] for different environments, generate random variable zk(R). If zk(R) = 0, the kth ray is not
present, so go to step 2 and update link range R for that tap index; if zk(R) = 1, go
35
6. From a distribution specified by (3.2) and tables exist in [66]-[68], generate the
kth ray’s duration Dk. (if needed, convert duration in meters to time or symbol
units), set Rk= R.
7. Draw a Gaussian random variable with mean μ and standard deviation σ from table 3.1, to set the kth ray relative amplitude (𝛼𝑘). Select the kth ray phase (𝜃𝑘) from a uniform distribution on [0, 2π).
8. From the distribution specified by (3.2) and tables exist in [66]-[68], set the kth ray relative delay τk(R).
9. Check Dk with respect to R to maintain the kth ray for duration Dk, if Dk= R − Rk
(reached), set Dk= 0 and go to step 10; if Dk < R− Rk(not reached), go to step 10
directly).
10.If k < N, go to step 3; if k = N, end of the loop.
In our simulation models we assume conditions comparable to those in the flight tests. We assume the GS antenna height is 20 m above the surface level and the aircraft height is that flown in the different measurement environments. As an example in Figure 3.2 we show two snapshots of PDPs (𝛼2(𝑡) in (3.3)), translated to distance, for two
segments of short and long distance ranges in the suburban hilly Latrobe, PA environment. In this figure the yellow part represents the LoS signal which always exists with normalized amplitude ≅ 1.
36
(a) (b)
Figure 3.2. Two snapshots of PDPs for different distance ranges in Latrobe: (a) distance 1.5 km; and (b) distance 20 km. (The total number of PDPs, 5000 here, is an example, and can be translated to distance via aircraft velocity and PDP sampling rate, i.e., v~90 m/s and PDP update rate~3 kHz yields a distance range of ~ 150 m for these PDP sequences.).
Comparing Figures 3.2 (a) and (b) we see that—consistent with measurement results—at the larger distance the IMPCs’ probability of occurrence (probability of zk(t) where k>2), becomes smaller and that is why in Figure 3.2 (a) IMPCs are more dense and with larger amplitudes than at longer distances (Figure 3.2 (b)).
37
Figure 3.3. Path Loss vs. distance for the over-sea channel model in Oxnard, CA.
Another important parameter in communication system performance calculations is signal to noise ratio (SNR). Based on the described channel models we can calculate SNR values at different distances and conditions based on following procedure. First we calculate the received power at distance R, Pr(R) based on (3.1). Then we calculate the
total noise power (PN) based on transmitted signal bandwidth, B Hz at the receiver
assuming a noise figure of NF dB and system double-sided additive white Gaussian noise
(AWGN) power density of N0dBm/Hz. Therefore total noise power is calculated from,
𝑃𝑁 = 𝑁0+ 10log (𝐵) + 𝑁𝐹 (3.9)
where N0 is calculated based on,
𝑁0 = 𝑘𝑇 (3.10)
where k is Boltzmann’s constant equals 1.381×10⁻²³ J/K (joules per degree Kelvin), and T is the receiver system noise temperature in kelvins. Then after calculating PN, SNR in dB
at distance R is calculated based on,
38
For the over-sea channel environment the SNR versus link range is plotted in Figure 3.4 for both FE2R and CE2R models. These SNRs are plotted considering transmit power and bandwidth of 10 W and 0.5 MHz, respectively, antenna gains of 5 dB for both transmitter and receiver, total cable loss of 4 dB and receiver noise figure 3 dB at system noise temperature of 290 K. Again in these results we used small-scale Ricean fading, attributable to sea surface scattering (K~12 dB). These results show the importance of using more accurate CE2R model which has different SNR values versus distance. In our communication systems we can use these SNR values to estimate the bit error ratio (BER) of any (narrowband) communication system at each distance.
Figure 3.4. SNR vs. distance for the over-sea channel model in Oxnard CA. 3.2 COMMUNICATION SYSTEMS TECHNICAL DETAILS
39
Due to potential lack of spectrum resources at L-band, and associated regulatory challenges, we will discuss later that these systems could also be designed for C-band operation. For L-DACS systems the desired frequency range is L-band 960-1164 MHz. Currently, L-band channels are largely occupied by high power DME signals which will be interference to these FCI systems. In the following sections first we review the DME signal characteristics since it is the main interference signal to FCI systems, then we describe L-DACS1, L-DACS2, FBMC, and SS-FBCM as FCI system candidates.
3.2.1 DME INTERFERENCE SYSTEM MODEL
DME signals operate throughout the frequency range of L-band (Figure 1.1), with different assigned frequencies for different geographic locations. This part of the spectrum is highly congested with DME signals. This led us to the idea of using communication systems such as FBMC, with better spectral shaping in the frequency domain, to decrease the interference between L-band channels. DME is a transponder-based radio navigation technology that measures slant range distance by timing the propagation delay of L-band radio signals. Similar to the concept of frequency allocation in cellular terrestrial networks, DME base stations (BS) are distributed widely geographically. Every DME channel occupies 1 MHz bandwidth, with 1 MHz separation throughout the 960 to 1150 MHz band.
40
from aircraft to ground station is 150 ppps. Each DME BS transmits sequences of the signal pulse pair defined in (3.12). The signal in (3.12) pertains to baseband, and these signals are modulated to different allocated passband frequencies for different channels:
𝑆𝑝𝑢𝑙𝑠𝑒_𝑝𝑎𝑖𝑟(𝑡) = 𝑒− 𝛼𝑡22 + 𝑒
−𝛼(𝑡−∆𝑡)2
2 (3.12)
where 𝛼 = 4.5 × 10¹¹ 𝑠−2, ∆𝑡 = 12 × 10−6 𝑠. Each DME signal is a sequence of pairs
of Gaussian-shape pulses separated by ∆𝑡. The start time of each pulse pair is modeled statistically, based on Poisson process. The constant α determines the pulse width. After taking the Fourier transform of (3.12), the DME pulse-pair signal spectrum is obtained, and is expressed in (3.13). Figure 3.5 illustrates single DME pulse pair time and frequency domain simulation results.
𝑆𝑝𝑢𝑙𝑠𝑒_𝑝𝑎𝑖𝑟(𝑓) = √8𝜋
𝛼 𝑒
(− 2𝜋2𝑓2
𝛼 )𝑒(𝑗𝜋𝑓∆𝑡)cos(𝜋𝑓∆𝑡) (3.13)