University of South Carolina
Scholar Commons
Theses and Dissertations
2017
Redirecting P450 Ferryl-Oxo Intermediates from
Oxygenation to Decarboxylation
Job Logan Grant
University of South Carolina
Follow this and additional works at:https://scholarcommons.sc.edu/etd Part of theChemistry Commons
This Open Access Dissertation is brought to you by Scholar Commons. It has been accepted for inclusion in Theses and Dissertations by an authorized administrator of Scholar Commons. For more information, please [email protected].
Recommended Citation
R
EDIRECTINGP450
F
ERRYL-O
XOI
NTERMEDIATESF
ROMO
XYGENATION TOD
ECARBOXYLATIONby
Job Logan Grant Bachelor of Science
University of South Carolina, 2013
Submitted in Partial Fulfillment of the Requirements For the Degree of Doctor of Philosophy in
Chemistry
College of Arts and Sciences University of South Carolina
2017 Accepted by:
Thomas Makris, Major Professor John Dawson, Committee Member Natalia Shustova, Committee Member
Melissa Moss, Committee Member
ii
iii
DEDICATION
I would like to dedicate this work to my family, particularly to my parents and my maternal grandparents. They have always emphasized the importance scholarship to me and I only got this far because of them.
iv
ACKNOWLEDGEMENTS
Foremost, I must thank my mentor Dr. Makris for putting up with me and leading me through this process for the past five years, as well as all my committee members past and present.
Thanks go to my lab mates in the Makris lab, for five years of friendship and collaboration. Particularly, to Jose Amaya for mapping out GC retention times and taking all the hard projects that are complementary to my mine. A special thanks to Courtney Wise and Olivia Manley for correcting my abysmal writing. Steven Ratigan and Jason Hsieh, guys were there too even if you didn’t directly contribute to this work.
v
ABSTRACT
A recently discovered cytochrome P450 has garnered much interest for its ability to oxidatively decarboxylate n length fatty acids to n-1 terminal olefins using hydrogen peroxide as an oxidant. This enzyme (P450 OleT) is mechanistically peculiar, as it seemingly abrogates the oxygen insertion chemistry that typifies the P450 superfamily. In this work we explore the origin of this deviant catalysis.
Using stopped-flow and transient kinetic methodologies the ferryl-oxo pi-cation radical and ferryl-hydroxo intermediates, known as compound-I (Cpd-I) and compound-II (Cpd-II) respectively, were isolated in high yield. This is the first time either species has been observed in a substrate bound P450 using a native oxidant. The accumulation of these intermediates has enabled direct observation of the decarboxylation mechanism of P450 OleT. We have found that decarboxylation is initiated with substrate hydrogen atom abstraction by Cpd-I, similar to oxygen insertion chemistries. The branch point in the reaction coordinate occurs at Cpd-II where, through a combination of substrate positioning and stabilization of ferryl-hydroxo by active site hydrogen bonding, oxygen rebound is inhibited allowing for a proton coupled one electron oxidation of the substrate to occur. This one electron oxidation liberates the carboxylate as CO2 through either
vii
TABLE OF CONTENTS
Dedication ...iii
Acknowledgements ... iv
Abstract ... v
List of Tables... viii
List of Figures ... ix
Chapter 1: Isolation of P450 Compound-I in Fatty Acid Decarboxylation ... 1
Chapter 2: Reactivity of OleT Compound-I and Isolation of Compound-II ... 22
Chapter 3: Reactivity of Compound-II and Secondary Oxidation of the Substrate ... 64
Chapter 4: Characterization OleT Self-Oxidation Pathway: Generation of Substrate Free Compound-I ... 130
viii
LIST OF TABLES
Table 2.1 Reciprocal relaxation times and amplitudes from fitting single
wavelength data ... 34
Table 2.2 Summary of reactivity of Int-2 with various substituted phenols ... 50
Table 3.1 Mutagenesis primers ... 70
Table 3.2 Summary of C20:0 binding parameters ... 82
Table 3.3 H2O2 binding and activation parameters of WT OleT with normal and perdeuterated fatty acids 14:0 to 20:0 ... 87
Table 3.4 Decay rates from global analysis fitting and maximum accumulation of intermediates OleT mutants ... 95
Table 3.5 H2O2 activation parameters WT OleT and H85 Mutants ... 97
Table 3.6 Reaction products of WT OleT and H85 series of mutants ... 100
Table 3.7 WT OleT and H85 mutants reactions % β abstraction products and (% n-1 alkene products) ... 101
Table 3.8 pKa and fraction factors of Fe4+-OH decay in WT OleT and H85Q ... 108
Table 3.9 Rates in H2O and fraction factors ϕ of Fe4+-OH decay ... 111
Table 4.1 Aromatic Amino Acids in P450 OleT ... 135
Table 4.2 Mutagenesis Primers ... 138
ix
LIST OF FIGURES
Figure 1.1 Comparison of OleTJE alkene production and prototypical P450
hydroxylation reactions... ..3 Figure 1.2 SDS-Page gel of purified OleT ... 6 Figure 1.3 Optical spectrum of the enzyme in “as-purified”, hydrogen
peroxide treated, and eicosanoic acid bound forms ... 9 Figure 1.4 Binding of eicosanoic acid to peroxide treated OleTJE ... 10
Figure 1.5 GC chromatogram and MS fragmentation pattern of the
nonadecene product ... 11 Figure 1.6 GC chromatogram and MS fragmentation pattern (inset)
of the deuterated nonadecene product ... 12 Figure 1.7Spectrum of OleT:perdeuterated eicosanoic acid complex
reacting with H2O2 ... 14
Figure 1.8 Proposed catalytic cycle for OleT alkene formation ... 16 Figure 2.1 The decarboxylation reaction catalyzed by OleT ... 25 Figure 2.2 Stopped flow absorption evidence for a substrate
2H kinetic isotope effect in the OleT reaction ... 32
Figure 2.3 Representative time courses superimposed fits and
residuals for the 20 μM OleT-EA + 10 mM H2O2 ... 33
Figure 2.4 Time course for the 20 μM OleT-D39EA + 10 mM H2O2 reaction
using single wavelength detection at 690 nm ... 34 Figure 2.5 Photodiode array spectra of a single turnover reaction of
20 μM OleT-D39EA with 10 mM H2O2, 2 to 40 ms timeframe ... 36
Figure 2.6 Photodiode array spectra of a single turnover reaction of
Figure 2.7 Photodiode array spectra of a single turnover reaction of
20 μM OleT-H39EA with 10 mM H2O2, 10 ms to 500 ms timeframe ... 38
Figure 2.8 Transient kinetics of Int-2 formation and decay ... 39
Figure 2.9 Peroxide independence and isotopic insensitivity of the slower RRT associated with Int-2 decay at 440 nm ... 40
Figure 2.10 Plots of the dependence of the larger reciprocal relaxation time at 440 nm on H2O2 ... 41
Figure 2.11 Summary of the kinetic parameters for OleT Compound-I formation, decay to Int-2 and the low-spin ferric enzyme ... 42
Figure 2.12 Speciation plots for OleT reaction cycle intermediates (D39-EA) ... 43
Figure 2.13 Speciation plots for OleT reaction cycle intermediates (H39-EA) ... 44
Figure 2.14 The pure component spectra of OleT Int-2 and Compound I ... 45
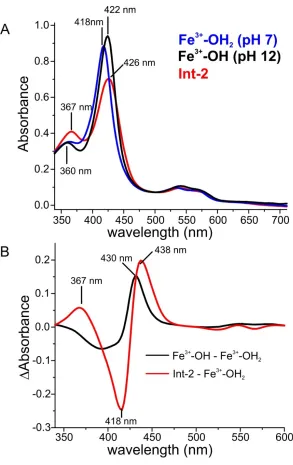
Figure 2.15 Comparison of the optical absorption spectra of OleT Int-2, ferric-H2O, and ferric-OH ... 47
Figure 2.16 Kinetics independent computation of the Int-2 optical spectrum by the linear combination of two spectra ... 48
Figure 2.17 Double mixing studies to probe the reactivity of Int-2 Towards phenols ... 49
Figure 2.18 Plot of the apparent Int-2 decay rate constant with phenol (circle) and 3-chlorophenol ... 49
Figure 2.19 pH dependence of the Int-2 decay rate ... 53
Figure 3.1 Reaction scheme for decarboxylation and β-hydroxylation P450 OleT ... 67
Figure 3.2 UV-Vis absorption spectra of H85Q, H85Y, H85F and H85A titrated with C20:0 fatty acid ... 81
Figure 3.3 Plot of fraction Fe3+ high-spin verses substrate C20:0 ... 82
xi
Figure 3.5 X-ray crystal structure of OleT (4L40) and a model of the
H85Y mutation ... 83 Figure 3.6 Interactions between C20:0 and OleT based on x-ray
structure (4L40) ... 85 Figure 3.7 Plot of rate of the growth phase observed at
440nm against H2O2 (deuterated FA) ... 86
Figure 3.8 Plot of rate of the growth phase observed at
440nm against H2O2 (Protiated FA) ... 87
Figure 3.9 UV-Vis spectra of enzyme substrate complexes of OleT
H85 mutants reacting with 5 mM H2O2 over 1 second ... 90
Figure 3.10 The absorbance at 440nm of the ES complexes of OleT
H85 mutants reacting with 5 mM H2O2 ... 91
Figure 3.11 SVD and global analysis of H85Q and H85F ... 93 Figure 3.12 SVD and global analysis of H85Y and H85A ... 94 Figure 3.13 Plot of the growth phase at observed at 440nm for
WT OleT and the series of H85 mutants ... 96 Figure 3.14 Model of the ferric-peroxo (Fe3+-O-O2-) intermediate of
OleT based on crystal structure 4L40 ... 98 Figure 3.15 A stacked bar graph ofReactionproducts of WT OleT
and the H85 series of mutants with C20:0, C16:0 and C12:0 FAs ... 99 Figure 3.16 Plot of decay rate of Fe4+-OH of WT OleT and H85Q
in H2O and 91% D2O as function of pH or pD ... 104
Figure 3.17 Representative plots of 440nm WT OleT and H85Q
at pH 7.6 and pH 6.0 ... 105 Figure 3.18 Plot of the two decay phases of Fe4+-OH observed in
WT OleT in H2O as function of pH... 106
Figure 3.19 Plot of the two decay phases of Fe4+-OH observed in
WT OleT in D2O as function of pH... 106
Figure 3.20 Plot of the relative amplitude of the fast decay phase of Fe4+-OH observed in WT OleT in H
xii
Figure 3.21 Plot of the rate of decay of Fe4+-OH in n molar fraction
D2O over the rate in pure H2O WT and H85Q ... 109
Figure 3.22 Plot of the rate of decay of Fe4+-OH in n molar fraction D2O over the rate in pure H2O WT at various pLs ... 110
Figure 3.23 Model of the active site of OleT Fe4+-OH intermediate based on PDB 4L40 ... 112
Figure 3.24 Arrhenius plot of the decay rate of Fe4+-OH verses temperature ... 113
Figure 3.25 Overviewinfluence of H85 on the OleT catalytic cycle ... 115
Figure 3.26 Schemes of the water bridged hydrogen bonding between position 85 and the Fe4+-OH ... 117
Figure 3.27 Energy diagram of the two competing decay pathways for Fe4+-OH, rebound and proton coupled electron transfer ... 118
Figure 3.28 Scheme for substrate and H85 driven mechanistic switch between β-hydroxylation and decarboxylation ... 119
Figure 4.1 The structure of P450 OleT (PDB ID: 4L40) with the tryptophan and tyrosine residues highlighted ... 133
Figure 4.2 UV-Vis spectra of OleT collected over 1 sec after rapid mixing with PPA on a stopped-flow ... 143
Figure 4.3 UV-Vis spectra of OleT collected over 1 sec after rapid mixing with mCPBA on a stopped-flow... 143
Figure 4.4 UV-Vis spectra of OleT collected over 1 sec after rapid mixing with NaClO on a stopped-flow ... 144
Figure 4.5 Single wavelength data at 370 and 440 nm fit to two summed exponentials with residuals ... 147
Figure 4.6 SVD analysis of OleT + NaClO at pD 6.22... 148
Figure 4.7 Overlay of Cpd-I in OleT + NaClO and (ES) OleT + H2O2 ... 149
Figure 4.8 Overlay of Cpd-II in OleT + NaClO and (ES) OleT + H2O2 ... 150
xiii
Figure 4.10 The self-oxidation of OleT by Cpd-I verse pL measured
at 440 nm in H2O or D2O ... 153
Figure 4.11 Plot of log10(k) verses pL (H or D) of Cpd-I decay in
H2O and D2O ... 154
Figure 4.12 Arrhenius plot of the decay of OleT Cpd-I, WT in H2O
and in D2O and Y59H in H2O ... 156
Figure 4.13 Arrhenius plot of peptide self-oxidation in WT OleT
and substrate hydrogen atom transfer ... 158 Figure 4.14 Reaction energy diagram of P450 OleT post
Cpd-I generation ... 161 Figure 4.15 3D Marcus theory plot of the rate of electron transfer
1
CHAPTER
1
ISOLATION OF P450 COMPOUND-I IN FATTY ACID
DECARBOXYLATION
1Abstract
OleT, a cytochrome P450, catalyzes the conversion of fatty acids to terminal alkenes using hydrogen peroxide as a co-substrate. Analytical studies with an eicosanoic acid substrate show that the enzyme has exclusive chemoselectivity for alkene formation and that carbon dioxide is the one carbon co-product of the reaction. The addition of hydrogen peroxide to a deuterated substrate-enzyme E-S complex results in the transient formation of an iron (IV) oxo π-cation radical (Compound I) intermediate which is spectroscopically indistinguishable from those that perform oxygen insertion chemistries. A kinetic isotope effect for Compound I decay suggests that it abstracts a substrate hydrogen atom to initiate fatty acid decarboxylation. Together, these results indicate that the initial mechanism for alkene formation, which does not result from oxygen rebound, is similar to that widely suggested for P450 monooxygenation chemistries.
1Grant, J. L., Hseih C. H., Makris T. M., Decarboxylation of Fatty Acids to Terminal
2
Introduction
The generation of hydrocarbons from fatty acid metabolites has received intensive interest for the sustainable production of fuels that are compatible within the existing energy infrastructure. 1-2 Several biosynthetic strategies for alkane
and alkene production have been recently identified. 3-6 A common mechanistic
feature of each pathway is the cleavage of the terminal carbon from a fatty acid (or aldehyde) 7 of chain length n to produce an n-1 alkane (or alkene) respectively.
Intriguingly, the enzymes involved in this carbon scission reaction each utilize an iron containing cofactor, non-heme mono- 6 or di-nuclear 8-9 iron, or cytochrome
P450 4-5, that typically activate O
2 or H2O2 for substrate oxygenations. The
elucidation of the mechanism of these carbon-carbon scission reactions, often cryptic, may offer the opportunity for the efficient production of liquid transportation fuels in a recombinant organism.
OleT, a cytochrome P450 from Jeotgalicoccus bacteria, metabolizes Cn
chain length fatty acids to produce Cn-1 alkenes, utilizing hydrogen peroxide (H2O2)
as a co-substrate in the reaction. 4 The overall reaction (Fig. 1.2.1A) involves the
3
Compound I, recently characterized by Green and colleagues.10 Subsequent
recombination with a substrate radical, in a process termed oxygen rebound,11
produces an alcohol and regenerates the ferric resting state of the enzyme.
Figure 1.1 Comparison of OleTJE alkene production and prototypical
P450 hydroxylation reactions.
The recent X-ray crystal structure 12 of OleT bound to an eicosanoic acid
substrate has confirmed the remarkable similarity of its active-site and substrate
binding mode to P450 peroxygenases BSβ 13 and SPα. 14 BSβ and SPα do not
competently produce olefin products, but instead hydroxylate fatty acids at the Cα
4
that is obligatory for the heterolytic cleavage of H2O2, 15 it does not immediately
clarify the origin of its capacity for C-C scission.
In order to elucidate OleT’s divergence from P450 monooxygenation chemistry, we have characterized its reaction with eicosanoic acid, a chain length which likely approximates that of the native substrate. Analytical studies have determined an exclusive chemoselectivity of the enzyme for alkene formation, and that the one-carbon co-product of this reaction is carbon dioxide. Transient kinetic studies show that the decarboxylation reaction is initiated by Compound I, mechanistically linking OleTJE catalysis to other P450 oxidations.
Methods
Reagents
All buffers used in this study were purchased from Research Products International. Eicosanoic acid (C20H40O2) was purchased from Sigma. The
terminal alkene standards, 1-nonadecene and 1-hexadecene, were purchased from TCI Chemicals. Perdeuterated eicosanoic acid (C20D40O2H) was from CDN
isotopes.
Cloning and heterologous expression of OleT
An Escherichia coli codon-optimized gene for OleT from Jeotgalicoccus sp. ATCC 8456 (NP_895059) was synthesized by DNA2.0 (Menlo Park, CA). In
order to optimize heterologous overexpression and purification, the gene was amplified by PCR using the following primers with restriction sites underlined:
5
Following restriction digestion with NdeI and EcoRI, the constructs were ligated into similarly digested pet21b to produce the C-terminal hexahistidine tagged OleTJE. The resulting constructs were verified by sequencing at Engencore
(Columbia, SC).
Heterologous expression was performed in Escherichia coli BL21 (DE3) containing the pG-Tf2 plasmid (Takara), which overexpresses the GroES and GroEL chaperones. Cells were grown in Luria broth containing 50 mg/L ampicillin and 20 mg/L chloramphenicol at 37oC until reaching an OD of 0.4 at 600 nm. The
cultures were subsequently cooled to 20oC and induced at an OD ~1 with 10 μg/L
tetracycline (for chaperone induction), 50 μM IPTG (for OleTJE induction), and 25
μM δ-aminolevulinic acid (for heme production). Cells were grown for an additional
15 hours after induction, harvested by centrifugation, and stored at −70°C until further use.
Purification of OleT
Frozen cells from 12 x 1 L cultures were resuspended in 250 mL of 50 mM NaH2PO4, 300 mM NaCl, 10 mM imidazole, pH 8.0 (buffer A). Cells were lysed
using a Branson Sonifier and centrifuged at 37,500 g for 45 min. The supernatant was then loaded by gravity onto a 20 mL nickel nitrilotriacetic acid (NTA) column (GE healthcare) equilibrated in buffer A. The column was subsequently washed with 200 mL of buffer A containing 20 mM imidazole, followed by 100 mL of a low salt buffer containing 50 mM NaH2PO4 pH 8.0 (buffer B). The protein was eluted
6
and loaded by gravity onto a 50 mL DEAE Sepharose fast flow column (GE Healthcare) equilibrated with buffer B. The column was washed with 5 column volumes of buffer B containing 100 mM NaCl and eluted using a linear gradient from 100 to 500 mM NaCl over 10 column volumes. Fractions containing pure OleTJE, judged by SDS-PAGE and absorbance ratios (Abs417/Abs280), were pooled
and concentrated to 5-20 mg/mL using Amicon ultra 30 kDa centrifugal filters, flash frozen, and stored at -70oC until further use. Figure 1.2 shows an SDS-PAGE gel
of the final purified protein. Protein concentrations were determined using a calculated extinction coefficient ε417 = 120 mM-1 cm-1 following complete substrate
removal.
Figure 1.2 SDS-Page gel of purified OleT.
Preparation of Substrate Free OleT
7
Preparation of stoichiometric enzyme-substrate complexes
A ten-fold molar excess of eicosanoic acid (prepared as a 25 mM stock in 30% Triton X-100, 70% Ethanol) was added to the substrate free enzyme and incubated for several hours at 4oC. Precipitated fatty acid was removed by
centrifugation at 16,000 rpm for 1 minute in a microcentrifuge. Excess, unbound substrate was removed by desalting as described above.
Single-Turnover Alkene Product Determination
A three-fold molar excess of H2O2 was added to the enzyme-eicosanoic
acid E-S complex (1 mL, 20 μM). 1-hexadecene (100 nmol) was subsequently added as an internal standard and the reaction mixture was quenched with 1M NaOH and the extracted with 3 mL of chloroform. The organic phase was removed and concentrated under a stream of N2. Gas chromatography mass spectrometry
(GC-MS) was performed at the University of South Carolina Mass Spectrometry facility with a Hewlett Packard HP5890 GC and a 30 meter Rbx-5 column. Mass spectra were recorded on a Waters VG 705 magnetic sector mass spectrometer using 70 eV electron impact energy.
Optical Spectroscopy
Optical spectra were obtained using an HP 8453 spectrophotometer. For
substrate titration experiments, 4 μM OleTJE in 100 mM potassium phosphate
(KH2PO4) pH 7.6 was titrated with sequential additions of a 10 mM eicosanoic acid
8
Fitting of the substrate induced absorption changes, Aobs, (at 417 nm and 392 nm)
were done with Origin software using a quadratic function (Morrison equation) (1.1) for tight binding ligands where Amax is the maximal absorbance change at ligand
saturation, S is the concentration of eicosanoic acid, Et is the concentration of
OleTJE, and Kd is the dissociation constant:
1.1 𝐴𝐴𝐴𝐴𝐴𝐴𝐴𝐴 = �𝐴𝐴𝐴𝐴𝐴𝐴𝐴𝐴2𝐸𝐸𝐸𝐸 �(𝑆𝑆 + 𝐸𝐸𝑡𝑡 + 𝐾𝐾𝐾𝐾) − (((𝑆𝑆 + 𝐸𝐸𝑡𝑡 + 𝐾𝐾𝐾𝐾)2− (4𝑆𝑆𝐸𝐸𝑡𝑡))0.5)
Stopped-Flow Absorption
Stopped-flow absorption experiments were performed on an Applied Photophysics Ltd. SX20 stopped-flow spectrophotometer. Eicosanoic acid (protiated or perdeuterated) bound OleTJE(~20 μM) was rapidly mixed with 5 mM
H2O2 in 100 mM KH2PO4 (pH 7.6) at 5oC. Single wavelength traces were taken
using a photomultiplier tube and full spectrum data were collected by photodiode array. The single wavelength data at 370 nm were fit to summed exponential expressions using Pro Data Viewer version 4.2.18.
Results
9
desalting. This treatment resulted in a complete conversion of the enzyme to the low-spin state (Fig. 1.3), and restored its ability to bind exogenously added
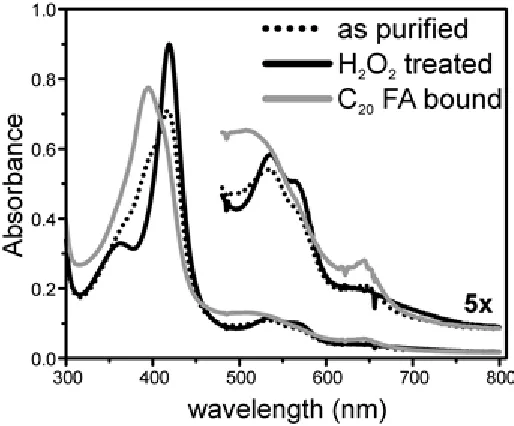
Figure 1.3 Optical spectrum of the enzyme in “as-purified” (dashed), hydrogen peroxide treated (solid black), and eicosanoic acid bound (solid gray) forms.
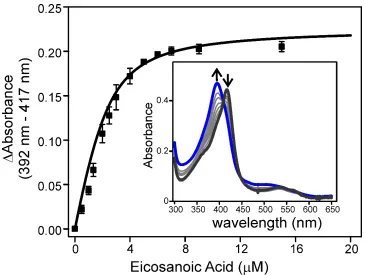
eicosanoic acid. The titration of substrate to the peroxide treated enzyme indicated a near complete conversion (~90%) of the enzyme to the ferric high-spin state upon saturation, with a measured dissociation constant Kd~ 0.8 μM (Fig. 1.4). As
a result of this high affinity, a stoichiometric enzyme-substrate (E-S) complex could be generated by poising the enzyme at concentrations well above (typically ≥ 10
10
Figure 1.4 Binding of eicosanoic acid to peroxide treated OleTJE.
Aliquots of eicosanoic acid were added to substrate free OleTJE (inset,
black trace) to produce the high spin enzyme (inset, blue trace). The spectral changes at 417 and 392 nm upon binding of eicosanoic acid were fit to a Morrison expression for tight binding ligands for Kd
determination as described in Methods.
Previous multiple turnover studies performed in vitro and in vivo have established that the reaction of OleTJE with eicosanoic acid and H2O2 generates
nonadecene. 4, 12 Single turnover studies were utilized to directly evaluate the
enzyme’s chemoselectivity for the alkene forming reaction. An E-S complex was mixed with a 3 fold molar excess of H2O2 and the hydrocarbon products of the
11
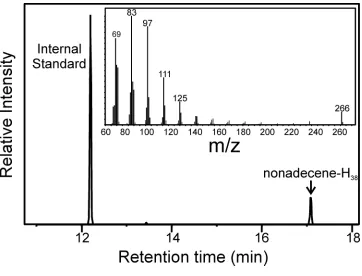
Figure 1.5. Identification of the Alkene Product from the
OleTJE:Eicosanoic Acid Single Turnover Reaction. GC chromatogram
and MS fragmentation pattern (inset) of the nonadecene product
formed from the reaction of a 20 μM OleTJE E-S complex and 60 μM
H2O2. The yield of deuterated nonadecene produced was determined
through peak integration and comparison to an internal hexadecene standard.
0.95 ± 0.1 equivalents of alkene produced per OleTJE, indicating an exclusive
preference for alkene formation. The reaction of an E-S complex, prepared with a perdeuterated C20 substrate (CD3(CD2)18COOH), produced deuterated
nonadecene with comparable yields (Fig. 1.6). No appreciable metabolic switching
16 occurs upon substrate isotopic substitution, substantiating the use of deuterated
12
Figure 1.6 GC chromatogram and MS fragmentation pattern (inset) of the deuterated nonadecene product formed from the reaction of a 20
μM OleTJE E-S complex, prepared with perdeuterated eicosanoic acid,
and 60 μM H2O2. The yield of deuterated nonadecene produced was
determined through peak integration and comparison to an internal hexadecene standard. The yields of deuterated alkene produced were similar (within 10 %) to those from reactions of the E-S complex prepared with protiated eicosanoic acid.
The oxidant responsible for initiating the OleTJE decarboxylation reaction is
13
oxygenase,9 would seem highly unlikely. Rather, the loss of hydrogen from a
relatively unactivated Cβ position, and structural similarity of OleTJE to
hydroxylases that presumably utilize a Compound I oxidant, suggest that a high-valent intermediate may be involved. Having established a competent single-turnover system with protiated and deuterated fatty acids, we tested whether such
an intermediate could be isolated. A 20 μM OleTJE-perdeuterated eicosanoic acid
(E-C20D) ternary complex was rapidly mixed with excess H2O2 at 5oC in stopped
flow absorption studies. Within 10 msec., the high-spin E-S complex (λmax at 392
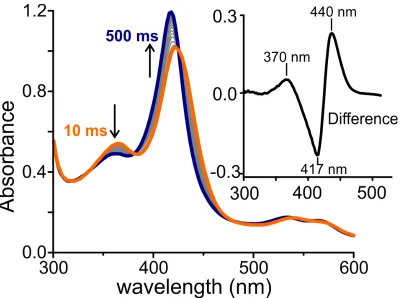
nm) had completely decayed, and a new intermediate with decreased absorptivity, a blue-shifted Soret maximumwith a Soret maximum of 370 nm, and an additional absorption band at 690 nm, had appeared (Figure 2A red trace, and inset). The absorption characteristics of this species are diagnostic of an iron (IV)-oxo pi cation radical intermediate (Compound I) and are nearly identical to those observed in rapid mixing studies of a thermostable P450(CYP119) 10, 18 with mCPBA and
similarly prepared species in other thiolate-ligated heme enzymes (ex. Aae-APO, CPO).19-20 Spectral deconvolution procedures, and comparison to these other
14
Figure 1.7 Spectrum of OleT:perdeuterated eicosanoic acid complex reacting with H2O2. The intial spectrum is in magenta and the end
spectrum is in blue.
indicates a decay rate of 80 sec-1. This decay rate of OleT Compound I (which we
designate hereafter as Ole-I) is invariant to H2O2 across high concentrations
consistent with the fact that it is formed as a result of O-O heterolysis, an irreversible process.
15
However, no appreciable accumulation of Ole-I could be detected prior to formation to the ferric low-spin state, suggesting that its previous stabilization was solely attributable to a 2H kinetic isotope effect (KIE). This apparent KIE for Ole-I
decay strongly favors a mechanism in which alkene formation is initiated by hydrogen abstraction, most likely originating from the Cβ position. This rules out a previous proposal that OleTJE’s atypical reaction may be attributed to initial
abstraction of an electron from the fatty acid carboxylate by Compound I.
The kinetics studies and observed reaction products in this study support a proposed catalytic mechanism for alkene synthesis that is shown in Figure 1.8. The mechanistic strategy for carbon-carbon bond scission appears to be identical, in its first steps, to the bulk of P450 oxidation reactions by Compound I. Based on the widely accepted mechanism for P450 hydroxylation of inert hydrocarbons, and the demonstrated incapacity of iron-oxo porphyrin pi-cation radical intermediates to perform hydride transfer in model systems,21 Ole-I most likely abstracts a
substrate hydrogen atom. This would result in the formation of a substrate radical and the Fe (IV)-hydroxide Compound II. The subsequent steps for OleTJE
decarboxylation necessitate a divergence from the monooxygenation reaction coordinate, particularly as oxygen rebound is abrogated. One logical route for alkene formation could involve single electron transfer, to Compound II or another oxidant, to produce an unstable substrate carbocation. Subsequent loss of the CO2 leaving group would generate the n-1 alkene. Similar mechanisms involving
16
rearrangement minor products from radical clock substrates, 25 and promote C-C
bond cleavage during the third step of androgen formation by P450 aromatase.
Figure 1.8 Proposed catalytic cycle for OleT alkene formation based on identification of the carbon dioxide co-product and stopped-flow absorption spectroscopy.
The apparent conservation of decarboxylase and hydroxylase mechanisms hints to an elegant adaptation that enables OleTJE to efficiently sidestep the
monooxygenation reaction coordinate. Does the inability to finalize oxygen rebound stem from an alteration in Ole-I structure or reactivity? It is perhaps noteworthy in this regard that Ole-I (unlike CYP119-I or AaeAPO-I) can be generated in high yields in a reaction with a pre-bound deuterated substrate and H2O2, suggesting that it may be more sluggish in its hydrogen abstraction
17
metal-oxo intermediates, particularly as pseudo first-order decay rate constants with exogenously added substrates cannot be determined. Assuming that the formation rate of Ole-I is insensitive to fatty acid isotopic substitution, and that no traces of the intermediate can be observed at 10 msec at 690 nm, we place a lower estimate for its reaction rate with a protiated substrate at k ~ 300 sec-1.
Semi-classical KIE limits (kH/kD ~ 7) may position this value even higher. In either case,
this estimated rate is within the range projected by Green and colleagues 10 for the
reaction of CYP119-I and a pre-bound substrate with similar bond dissociation energy, suggesting that Ole-I is similarly reactive. Instead, the capacity for OleTJE
to produce minor aliphatic hydroxylated products 4, 26 in reactions with shorter chain
length substrates suggests that there may be additional structural factors that are important in steering the enzyme towards alkene production. An evaluation of each of these potential contributions is currently under investigation.
The highly reactive nature of P450-I has limited a direct interrogation of its chemical reactivity to an extremely small subset of substrates. Here, stopped flow and analytical studies provide evidence that such an intermediate is formed, and can catalyze a decarboxylation reaction that does not result from oxygen insertion.
REFERENCES
18
2. Peralta-Yahya, P. P.; Zhang, F. Z.; del Cardayre, S. B.; Keasling, J. D., Microbial engineering for the production of advanced biofuels. Nature 2012, 488 (7411), 320-328.
3. Schirmer, A.; Rude, M. A.; Li, X.; Popova, E.; del Cardayre, S. B., Microbial biosynthesis of alkanes. Science 2010, 329 (5991), 559-62.
4. Rude, M. A.; Baron, T. S.; Brubaker, S.; Alibhai, M.; Del Cardayre, S. B.; Schirmer, A., Terminal Olefin (1-Alkene) Biosynthesis by a Novel P450 Fatty Acid Decarboxylase from Jeotgalicoccus Species. Appl. Environ. Microbiol. 2011, 77 (5), 1718-1727.
5. Qiu, Y.; Tittiger, C.; Wicker-Thomas, C.; Le Goff, G.; Young, S.; Wajnberg, E.; Fricaux, T.; Taquet, N.; Blomquist, G. J.; Feyereisen, R., An insect-specific P450 oxidative decarbonylase for cuticular hydrocarbon biosynthesis. Proc. Natl. Acad. Sci. U.S.A. 2012, 109 (37), 14858-14863.
6. Rui, Z.; Li, X.; Zhu, X.; Liu, J.; Domigan, B.; Barr, I.; Cate, J. H.; Zhang, W., Microbial biosynthesis of medium-chain 1-alkenes by a nonheme iron oxidase. Proc. Natl. Acad. Sci. U.S.A. 2014, 111 (51), 18237-42.
7. Warui, D. M.; Li, N.; Norgaard, H.; Krebs, C.; Bollinger, J. M.; Booker, S. J., Detection of Formate, Rather than Carbon Monoxide, As the Stoichiometric Coproduct in Conversion of Fatty Aldehydes to Alkanes by a Cyanobacterial Aldehyde Decarbonylase. J. Am. Chem. Soc. 2011, 133 (10), 3316-3319.
19
Oxygenation of Aldehydes Yields n - 1 Aldehydes and Alcohols in Addition to Alkanes. ACS Catal. 2013, 3 (10), 2228-2238.
9. Pandelia, M. E.; Li, N.; Norgaard, H.; Warui, D. M.; Rajakovich, L. J.; Chang, W. C.; Booker, S. J.; Krebs, C.; Bollinger, J. M., Jr., Substrate-triggered addition of dioxygen to the diferrous cofactor of aldehyde-deformylating oxygenase to form a diferric-peroxide intermediate. J. Am. Chem. Soc. 2013, 135 (42), 15801-12. 10. Rittle, J.; Green, M. T., Cytochrome P450 compound I: capture, characterization, and C-H bond activation kinetics. Science 2010, 330 (6006), 933-7.
11. Groves, J. T.; McClusky, G. A., Aliphatic Hydroxylation Via Oxygen Rebound - Oxygen-Transfer Catalyzed by Iron. J. Am. Chem. Soc. 1976, 98 (3), 859-861.
12. Belcher, J.; McLean, K. J.; Matthews, S.; Woodward, L. S.; Fisher, K.; Rigby, S. E. J.; Nelson, D. R.; Potts, D.; Baynham, M. T.; Parker, D. A.; Leys, D.; Munro, A. W., Structure and Biochemical Properties of the Alkene Producing Cytochrome P450 OleTJE (CYP152L1) from the Jeotgalicoccus sp 8456 Bacterium. J. Biol. Chem. 2014, 289 (10), 6535-6550.
20
14. Fujishiro, T.; Shoji, O.; Nagano, S.; Sugimoto, H.; Shiro, Y.; Watanabe, Y., Crystal Structure of H2O2-dependent Cytochrome P450SPalpha with Its Bound Fatty Acid Substrate: Insight into the Regioselective Hydroxylation of Fatty Acids at the alpha position. J. Biol. Chem. 2011, 286 (34), 29941-29950.
15. Matsunaga, I.; Sumimoto, T.; Ueda, A.; Kusunose, E.; Ichihara, K., Fatty acid-specific, regiospecific, and stereospecific hydroxylation by cytochrome P450 (CYP152B1) from Sphingomonas paucimobilis: substrate structure required for alpha-hydroxylation. Lipids 2000, 35 (4), 365-71.
16. Atkins, W. M.; Sligar, S. G., Metabolic Switching in Cytochrome-P-450cam - Deuterium-Isotope Effects on Regiospecificity and the Monooxygenase Oxidase Ratio. J. Am. Chem. Soc. 1987, 109 (12), 3754-3760.
17. Vaz, A. D. N.; Pernecky, S. J.; Raner, G. M.; Coon, M. J., Peroxo-iron and oxenoid-iron species as alternative oxygenating agents in cytochrome P450-catalyzed reactions: Switching by threonine-302 to alanine mutagenesis of cytochrome P450 2B4. Proc. Natl. Acad. Sci. U.S.A. 1996, 93 (10), 4644-4648. 18. Kellner, D. G.; Hung, S. C.; Weiss, K. E.; Sligar, S. G., Kinetic characterization of Compound I formation in the thermostable cytochrome P450 CYP119. J. Biol. Chem. 2002, 277 (12), 9641-9644.
21
20. Palcic, M. M.; Rutter, R.; Araiso, T.; Hager, L. P.; Dunford, H. B., Spectrum of Chloroperoxidase Compound-I. Biochem. Biophys. Res. Commun. 1980, 94 (4), 1123-1127.
21. Jeong, Y. J.; Kang, Y.; Han, A. R.; Lee, Y. M.; Kotani, H.; Fukuzumi, S.; Nam, W., Hydrogen atom abstraction and hydride transfer reactions by iron(IV)-oxo porphyrins. Angew Chem Int Edit 2008, 47 (38), 7321-7324.
22. Whitehouse, C. J. C.; Bell, S. G.; Wong, L. L., Desaturation of Alkylbenzenes by Cytochrome P450(BM3) (CYP102A1). Chem. Eur. J. 2008, 14 (35), 10905-10908.
23. Skiles, G. L.; Yost, G. S., Mechanistic studies on the cytochrome P450-catalyzed dehydrogenation of 3-methylindole. Chem. Res. Toxicol. 1996, 9 (1), 291-297.
24. Rettie, A. E.; Boberg, M.; Rettenmeier, A. W.; Baillie, T. A., Cytochrome-P-450-Catalyzed Desaturation of Valproic Acid Invitro - Species-Differences, Induction Effects, and Mechanistic Studies. J. Biol. Chem. 1988, 263 (27), 13733-13738.
25. Auclair, K.; Hu, Z.; Little, D. M.; Ortiz De Montellano, P. R.; Groves, J. T., Revisiting the mechanism of P450 enzymes with the radical clocks norcarane and spiro[2,5]octane. J. Am. Chem. Soc. 2002, 124 (21), 6020-7.
22
CHAPTER
2
REACTIVITY OF OLET COMPOUND-I AND ISOLATION OF
COMPOUND-II
1Abstract
OleT is a cytochrome P450 which catalyzes the hydrogen peroxide dependent metabolism of Cn chain length fatty acids to synthesize Cn-1 1-alkenes.
The decarboxylation reaction provides a route for the production of drop-in hydrocarbon fuels from a renewable and abundant natural resource. It is also a highly unusual transformation for a P450, which typically utilize a Fe4+-oxo
intermediate known as Compound I for the insertion of oxygen into organic substrates. OleT, previously shown to form Compound I, catalyzes a different reaction. A large substrate kinetic isotope effect (≥8) for OleT Compound I decay confirms that, like monooxygenation, alkene formation is initiated by substrate C-H bond abstraction. Rather than finalizing the reaction through rapid oxygen rebound, alkene synthesis proceeds through the formation of a reaction cycle intermediate with kinetics, optical properties, and reactivity indicative of an Fe4+
-OH species, Compound II. The direct observation of this intermediate, normally
1Grant, J. L., Mitchell, M. E., Makris, T. M., Catalytic strategy for carbon−carbon
23
fleeting in hydroxylases, provides a rationale for the carbon-carbon scission reaction catalyzed by OleT.
Introduction
Cytochrome P450 (CYP) enzymes catalyze an extraordinary breadth of physiologically important oxidations for xenobiotic detoxification and specialized biosynthetic pathways 1-2. The metabolic diversity of CYP enzymes originates from
a sophisticated interplay of substrate molecular recognition with precise tuning of metal oxygen species formed at the enzyme active-site. CYPs utilize a thiolate ligated heme-iron cofactor to activate molecular oxygen and produce short-lived ferric-superoxo 3-5, ferric-(hydro)peroxo 6-8 and ferryl 9-10 intermediates.
Coordinated efforts over several decades have resulted in isolation of each intermediate, including recent characterization of the principal oxidant thought to be responsible for the vast majority of P450 oxidations, the Fe4+-oxo pi-cation radical species commonly referred to as Compound I (or P450-I) 10.
The archetypal P450 hydroxylation involves C-H bond abstraction by P450-I and ensuing rapid oxygen insertion through a recombination process termed oxygen rebound 11-12. The hydrogen abstraction/rebound mechanism describes
the strategy employed for most P450 transformations, and is thought to describe catalysis by numerous metal-dependent oxygenases and synthetic bio-inspired metal-oxo complexes (ex. 13-17). Despite the ubiquity of this mechanism, in some
24
iron halogenase SyrB2 20-22. The mechanisms for RNR and SyrB2 highlight the
importance of quaternary structural elements, an extensive 35 Angstrom (Å) proton coupled electron transfer pathway in RNR 23, and extremely subtle (sub Å)
substrate positional tuning (SyrB2) 21-22, to enable efficient circumvention from the
monooxygenation reaction coordinate.
P450-I has also been linked to a number of important transformations in which an oxygen rebound step is not readily observed, including the desaturation of pharmaceuticals by liver P450s to afford hepatotoxic metabolites 24 and the
C-C lyase activity of human P450 aromatase that is critical for estrogen biosynthesis
25, among others 26-27. However, unambiguous determination of the oxidant
responsible and operant mechanism for these aberrant P450 transformations has met significant challenges. Compound I has not been isolatable from an O2
dependent reaction due to rate limiting electron transfer processes, and the products resulting from these atypical reactions can sometimes represent only minor channels of the enzyme/substrate(s) involved. Attempts to resolve the mechanisms for these reactions have therefore largely relied on indirect methods: isotopic labeling strategies (oxygen incorporation 25, 28, steady state substrate 24, 27
and solvent 29 kinetic isotope effects (KIE)), inference from the spectroscopic
characterization of preceding reaction cycle intermediates 30, or computational
methods 31-32. Although P450-I species have been widely hypothesized to carry
25
OleT is a recently discovered bacterial P450 that catalyzes an unusual carbon-carbon scission reaction, converting a Cn chain length fatty acid to a Cn-1
1-alkene 33-34 and carbon dioxide co-product 35 (Fig. 2.1). In addition to the peculiar
Figure 2.1 The decarboxylation reaction catalyzed by OleT. Using a hydrogen peroxide co-substrate, OleT metabolizes a Cn chain length fatty
acid to produce a Cn-1 alkene and carbon dioxide co-product.
chemical nature of this reaction, OleT catalysis has garnered significant biotechnological interest as it involves the conversion of a bio-available and abundant feedstock into a petrochemical and valuable synthetic precursor 36-38.
OleT differs from most P450s in two fundamental aspects. Belonging to the CYP152 family 39-40, catalysis is efficiently initiated by hydrogen peroxide, rather
than O2 and reducing equivalents delivered through a redox chain. Moreover, single 35 and multiple turnover 36, 38 studies of what is generally believed to
approximate the chain length of the physiological substrate, eicosanoic acid (EA), have indicated that oxidative decarboxylation, affording nonadecene, is the largely dominant reaction route 34. Combined 13C substrate and H
218O2 isotopic labeling
26 does not lead to recovery of 18O in the 13CO
2 product, ruling out a multi-step
oxygenolytic mechanism involving successive hydroxylations.
Benefitting from the high chemoselectivity of OleT and a facile means to rapidly trigger catalysis, we recently reported that a highly accumulating Compound I intermediate (Ole-I) could be isolated in reactions of OleT using the native H2O2 terminal oxidant and a bound deuterated substrate analog 35. The
observation of a Compound I species in OleT, optically indistinguishable from those that promote hydroxylations 10, 41, intimated that the same P450 intermediate
can be re-tuned to catalyze a fundamentally different reaction. In this work, we directly demonstrate that P450 Compound I species can promote reactions that do not involve oxygen rebound. A mechanistic basis for the functional divergence of OleT is provided by identification of the subsequent intermediate in the decarboxylation reaction sequence. Single turnover kinetic studies show that alkene formation is initiated by substrate C-H bond abstraction by Ole-I, forming an Fe4+-OH species, Compound II. The remarkable stability of this intermediate
provides direct insight into how metal-oxo reprogramming is achieved by P450 cytochromes.
Methods
Reagents
27
eicosanoic acid (99.5 atom % D) was purchased from CDN isotopes. 3-chlorophenol was purchased from Acros Organics.
Heterologous Expression and Purification of OleT
The cloning, heterologous expression, purification and removal of adventitiously bound fatty acids from OleT are described in 35.
Stopped flow Methods
Stopped flow experiments were performed using an Applied Photophysics Ltd. (APP) SX.20 stopped-flow spectrophotometer with photomultiplier tube (PMT) or photodiode array (PDA) detection as indicated. Eicosanoic acid bound OleT (E-S) was prepared by incubation of H2O2 pretreated and desalted substrate free enzyme (typically ~ 10 – 40 mM) in 200 mM K2HPO4 pH 7.4 with a three-fold molar
excess of eicosanoic acid (H39 or D39-EA) for 15 hours at 4oC. Eicosanoic acid was prepared as a 10 mM stock in 70% ethanol:30% Triton X-100 (v/v). After incubation, undissolved fatty acid was removed by centrifugation for 10 minutes at 6,000 rpm before loading into a stopped flow syringe. The enzyme was mixed at 4 oC with H
2O2, similarly prepared in a 200 mM K2HPO4 pH 7.4 buffer.
Fitting of Transient Kinetic Reactions
28
absorbance, 1/ti is the reciprocal relaxation time (RRT, s-1), ai is the amplitude of
phase i, t is time (s) and A_∞ is the final absorbance.
2.1 𝐴𝐴𝑡𝑡,𝑜𝑜𝑜𝑜𝑜𝑜= 𝐴𝐴∞+ ∑𝑛𝑛𝑖𝑖=1𝑎𝑎𝑖𝑖 𝑒𝑒−𝑡𝑡/𝑡𝑡𝑖𝑖
The two phases observed at these wavelengths indicate that there are at least two steps in the reaction. The decay time course of Ole-I at 690 nm was adequately fit to a single exponential expression. Representative fits and residuals obtained from these procedures are provided in Fig. S1. The amplitudes of these phases, RRTs, and errors with multiple preparations of the enzyme are provided in Table 2.1.
Peroxide Dependence of Int-2 formation
The fast phase associated with intermediate 2 (Int2) formation at 440 nm was determined using the methods described above. For experiments using D39-EA, the hyperbolic dependence of the observed RRT on H2O2 was fit using the following kinetic model, where Fe3+(HS) represents the ferric high-spin state of the
enzyme and the other species have their typical designations.
2.2 Fe3+(HS) + H2O2 𝑘𝑘1
⇄ 𝑘𝑘−1
Compound I 𝑘𝑘⇄2 𝑘𝑘−2
Int2
The RRT (1/τ obs) versus [H2O2] plot was fit using the following hyperbolic
expression where the apparent KDH2O2is provided by �𝑘𝑘−1 𝑘𝑘1�.
2.3 1 𝜏𝜏𝑜𝑜𝑜𝑜𝑜𝑜 =
𝑘𝑘2[H2O2]
29
Non-linear fitting indicated that k-2 = 0, indicating an irreversible process. In
reactions with a H39-EA, the linear dependence of the fast RRT versus [H2O2]
demonstrated a clear change in at least one of the rate constants. It is not anticipated that steps leading to Compound I formation would be substrate isotopically sensitive, while its decay rate constant (k2) is accelerated. In the linear
plots of RRT versus [H2O2], the rate constant for the H2O2 association step is
provided by the slope of the plot (k1), and the off rate (k-1) is provided by the
intercept. Similar methods were used to analyze the decay rate of Ole-I at 370 nm for the D39-EA reaction.
Preparation of Fe3+-OH OleT
The spectrum of the OleT ferric-hydroxide was obtained by rapid mixing of the 20 µM substrate free enzyme, prepared in 25mM K2HPO4 pH 7.4, with 250 mM
K2HPO4 and 250 mM arginine pH 12.0. The species is stable for several minutes
at 4 °C.
Global analysis and Singular Value Decomposition (SVD)
Singular-value decomposition of photodiode array data was performed using Pro-KIV global analysis software (Applied Photophysics). Initial SVD fitting for both substrates showed three non-zero singular values, indicating three transitions between four spectrally distinguishable species. The following kinetic model was used where k1’ represents a pseudo first-order rate constant at H2O2
concentrations in large excess to the enzyme used.
2.4 Fe3+(HS) + H2O2 𝑘𝑘1
′
30
Authentic Fe3+(HS) and Fe3+(LS) spectra are readily produced without rapid
mixing, and were input into Pro-KIV to improve the accuracy of resolving intermediate spectra. The initial components of the system at t = 0 were determined by mixing an E-S complex against buffer with no H2O2. The sample typically comprised ~80-90% Fe3+(HS) and a minor contribution from the Fe3+(LS)
species. Initial rates for the kinetic model were input from those determined by single wavelength kinetics. The final rate constants determined by global analysis showed good agreement with these values.
Derivation of the Int-2 Spectrum by Linear Combination Methods
The kinetic model was simulated using the rates for k1', k2, and k3 determined by the methods described above. From the speciation plots shown in Fig. S4, a time regime (t) when the reaction only consisted of Int-2 and Fe3+(LS)
was readily identified (t ≥ 20 and 80 ms, for H39-EA and D39-EA respectively). From
data at several defined time points, a weighted Fe3+(LS) spectrum, taken from the
endpoint of the reaction, was subtracted to produce a calculated spectrum of Int-2.
Double mixing reactivity studies
Double mixing studies were performed using the stopped flow configured in sequential mixing mode. A 40 µM E-S complex was mixed 1:1 (v/v) with 2 mM H2O2, aged for 20 ms, and subsequently mixed 1:1 with phenolic derivatives.
Phenol stocks were buffered in 200 mM K2HPO4. The final pH of phenol stocks
31
Results
Alkene Formation Proceeds by Fatty Acid C-H Abstraction by Compound I
Stopped flow absorption studies have shown that first detectable intermediate in the single turnover reaction of perdeuterated eicosanoic acid (D39
-EA) bound high-spin ferric OleT and H2O2 is Ole-I 35, which has absorption maxima
at 370 and 690 nm, as reported for other thiolate-ligated Compound I species 9-10, 41. Ole-I is a chemically competent species as its decay rate constant, determined
directly below, exceeds the turnover number of OleT (~0.2 s-1 at 25oC 34).
Single-turnover reactions of EA-OleT and H2O2 produce nearly one equivalent of alkene
per enzyme 35. Fitting the time course for Ole-I decay at 370 nm using regression
methods (Fig. 2.2, red trace) required a two-summed exponential expression with
reciprocal relaxation times (RRTs) 1/
τ
1 = 77 ± 2 s-1 and 1/τ
2 = 8.1 ± 0.4 s-1 (Table2.1, Fig. 2.3). The complex biphasic kinetic behavior for Ole-I decay may be attributed to multiple populations of the intermediate that react at different rates, or may alternatively hint towards the presence of an additional intermediate that absorbs at this wavelength.
In order to delineate between these possibilities, the decay of Ole-I was alternatively monitored at 690 nm (Fig. 2.4). The data, which could be accurately fit with a single exponential expression, indicates a homogeneously reactive Ole-I
species. Consequently, the measured RRT measured at this wavelength (1/
τ
=8332
Figure 2.2 Stopped flow absorption evidence for a substrate 2H kinetic isotope
effect in the OleT reaction. Representative single wavelength time course for the
reaction of 20 μM OleT-D39EA (red) or OleT-H39EA (blue, and inset) with 10 mM
H2O2 monitored at 370 nm. The superimposed white traces represent two
summed exponential fits to the data.
We 35 and others 34 have postulated that alkene formation may proceed via
initial substrate H atom abstraction based on the accepted mechanism for aliphatic hydroxylations by P450-I, loss of a hydrogen from the Cβ position during conversion of a Cn fatty acid to a Cn-1 alkene, and structural similarity of OleT 33
with fatty acid hydroxylases 42-43 that exhibit significantly large substrate 2H
steady-state kinetic isotope effects (KIEs) 39. Appreciable accumulation of Ole-I was not
previously detected in the OleT single turnover reaction with protiated EA (H39-EA),
33
Figure 2.3 Representative time courses (black) superimposed fits (red) and
residuals for the 20 μM OleT-EA + 10 mM H2O2 time course using single
34
Table 2.1 Reciprocal relaxation times and amplitudes from fitting single wavelength data Reciprocal
relaxation
time number
wavelength 690 nm 370 nm 370 nm 440 nm 440 nm
substrate D39-EA
s-1 (amp)
D39-EA
s-1 (amp)
H39-EA
s-1 (amp)
D39-EA
s-1 (amp)
H39-EA
s-1 (amp)
1 83 ± 2b
(0.06)c
77 ± 2 (0.19)
630 ± 60 (0.14)
82 ± 3 (-0.36)
670 ± 60 (-0.25)
2 8.1 ± 0.4
(0.06)
6.9 ± 0.4 (0.05)
10.8 ± 0.1 (0.24)
9.0 ± 0.2 (0.2) aWith the exception of the 690 nm data, fitting was to a 2 summed exponential
expression by nonlinear regression using ProData viewer software. A 20 μM OleT-EA
complex was mixed with 10 mM H2O2 at 4oC at pH 7.5
b Error represents multiple experimental runs using different preparations of OleT c The sign of an amplitude is opposite that of the observed change in absorbance
Figure 2.4 Time course for the 20 μM OleT-D39EA + 10 mM H2O2
35
In order to further probe the reactivity of Ole-I, the H39-EA single turnover
system was monitored at 370 nm with a photomultiplier tube, providing greater sensitivity. Biphasic characteristics were again observed, although the initial decay phase was significantly more rapid than for D39-EA, reaching completion
within 10 ms (Fig. 2.2, blue trace, Fig. 2.3B). Despite this rapid disappearance, relatively accurate RRTs (within 10% error) were obtained from a two summed
exponential fit of the data, with 1/
τ
1 = 630 ± 60 s-1 and 1/τ
2 = 6.9 ± 0.4 s-1. Onlythe fast RRT demonstrated appreciable isotopic sensitivity. This indicates that if the slower phase indeed derives from a second intermediate species that contributes to the absorbance at 370 nm, it does not directly abstract an H atom. An observed 2H KIE for Ole-I decay at this H
2O2 concentration, which represents
a lower limit for the unmasked value, is provided by a ratio of the fast RRTs, (Hk
app/Dkapp = RRT1 (H39-EA) / RRT1 (D39-EA)), giving a KIE ≥ 8.1 ± 1.1. The large
KIE, which has not been previously measured for a P450-I generated with a bound substrate, is in accord with unmasked KIEs for steady state P450 hydroxylations
12, rapid mixing studies of P450-I 10 and similar thiolate ligated heme iron-oxo
species 41, and theoretical considerations 44. This confirms that the distinctive
36
A Second Intermediate in the Decarboxylation Reaction
Kinetic evidence for an additional chromophoric species in OleT decarboxylation prompted a close examination of the photodiode array data for the EA single turnover reaction. In spectra obtained from mixing EA-D39 bound OleT
with a large excess of H2O2, the loss of Ole-I (Fig. 2.5, green spectrum) over 40
ms is accompanied with the formation of a new transient species (Fig. 2.5 orange spectra). We refer to this second OleT intermediate as Int-2.
Figure 2.5 Identification of an additional intermediate (Int-2) that forms concomitant with OleT Compound I (Ole-I) decay. Photodiode
array spectra of a single turnover reaction of 20 μM OleT-D39EA with
10 mM H2O2, 2 to 40 ms timeframe.
37
enzyme, which formed more slowly over the course of 500 ms (Fig. 2.6, blue spectrum). The optical features of this presumptive new intermediate are partially revealed by subtracting the final Fe3+-H
2O species from the 40 ms spectrum (Fig.
2.6, inset), which shows a prominent positive feature at 440 nm and a secondary
Figure 2.6 Photodiode array spectra of a single turnover reaction of
20 μM OleT-D39EA with 10 mM H2O2, 40 ms to 500 ms timeframe.
Inset is the difference spectrum between the start (orange) spectrum and the end (blue) spectrum.
peak at 370 nm. A similar species was detected in parallel studies of OleT-H39EA
38
Figure 2.7 Photodiode array spectra of a single turnover reaction of
20 μM OleT-H39EA with 10 mM H2O2, 10 ms to 500 ms timeframe.
Inset is the difference spectrum between the start (orange) spectrum and the end (blue) spectrum.
Int-2 is the Decay Product of Compound I
The kinetic behavior of Int-2 was monitored at 440 nm using single wavelength stopped flow. The time courses for both substrates reveal rapid development of the chromophore associated with Int-2 and a subsequent slower decay phase upon conversion to the final ferric low-spin product form (Fe3+-OH
2)
39
Figure 2.8 Transient kinetics of Int-2 formation and decay. (A) Representative single wavelength time course for the reaction of 20
μM OleT-D39EA (red) or OleT-H39EA (blue) with 10 mM H2O2
monitored at 440 nm. The superimposed white traces represent two summed exponential fits to the data.
could be appropriately fit to a sum of two exponential functions with well resolved RRTs (Table 2.1). Intriguingly, the fast phase RRT exhibited a large dependence on the isotopic composition of the substrate and, for both types of substrate, matched the decay rate constant for Ole-I. Both kinetic features suggest that Int-2 results from the decomposition of Ole-I, and therefore represents the next intermediate in the reaction sequence.
-40
EA substrates, the slow RRT associated with Int-2 decay was independent of H2O2
concentration, and demonstrated only minor isotopic sensitivity (Fig. 2.9). This is
Figure 2.9 Peroxide independence and isotopic insensitivity of the slower RRT associated with Int-2 decay at 440 nm.
consistent with an assignment of Int-2 as an intervening intermediate between Ole-I and Fe3+-OH
2. For the D39-EA plot (Fig. 2.10, and inset), the fastest RRT shows
a hyperbolic dependence on H2O2 concentration, indicating that there are at least
two reaction steps that lead to the generation of Int-2. Provided that this phase corresponds to an irreversible step in the reaction sequence, then the measured RRT corresponds to the rate constant for Int-2 formation. Results from a hyperbolic fit of the H2O2 concentration dependence shows that this is the case.
41
Figure 2.10 Plots of the dependence of the larger reciprocal relaxation time at 440 nm on H2O2 concentration in respective colors. The solid
lines represent non-linear fitting to a hyperbolic expression (for the D39
-EA reaction) and linear fitting (H39-EA). Inset is data (for the D39-EA
reaction) at 370 and 440 nm superimposed.
hyperbolic fit of the H2O2 concentration dependence shows that this is the case.
The y-intercept of the plot, zero, corresponds to the reverse rate constant for the Int-2 formation step (k-2 = 0). The asymptote of the plot (equal to k2 + k-2)
represents the formation rate constant for Int-2 (k2 = 86 ± 4 s-1) and gives an
apparent KDH2O2 ≈ 100 μM. These results support a scheme in which Int-2 is
42
substrate C-D bond cleavage, and that its rate of formation is identical to the decay rate constant of Ole-I.
The Ole-I → Int-2 → Fe3+-OH
2 catalytic sequence is further verified by
examination of the fast RRT versus H2O2 for the H39-EA reaction (Fig. 2.10). In
this case, the plot reveals a linear dependence of the RRT and H2O2, with no
evidence of saturation within the accessible range of H2O2 concentrations in which
rates could be reliably measured. This altered kinetic behavior can be interpreted as arising from more facile cleavage of the target substrate C-H bond (relative to C-D), such that Int-2 formation is now partially dominated by the rate constant for H2O2 binding. Accordingly, the forward and reverse rate constants for the peroxide
binding step are provided by the slope (k1 = 5.4 x 10⁵ M-1 s-1), and intercept of the
plot (k-1 = 27 ± 3 s-1), respectively. A kinetic model that accounts for all of the
observed kinetic data is shown in Figure 2.11.
Figure 2.11 Summary of the kinetic parameters for OleT Compound I formation, and subsequent decay to Int-2 and the low-spin ferric enzyme. The decay rate constants for Ole-I with D39-EA snd H39-EA
are indicated as kD and kH respectively. The formation of nonadecene
43
Assignment of Int-2 as an iron(IV)-hydroxide species
If Int-2 derives directly from hydrogen atom abstraction by Compound I, with no intervening reaction steps, it should resemble a Fe4+-OH species similar to
Compound II. Rapid radical recombination by oxygen rebound prohibits the observation of Compound II in P450 hydroxylations. However, the progressive decrease in decay rate constants for Ole-I and Int-2 allows for the latter to appreciably accumulate in OleT, most significantly for the H39-EA reaction (Fig.
2.12 and 2.13).
44
Figure 2.13 Speciation plots for OleT reaction cycle intermediates computed using rate constants determined in single wavelength studies with H39-EA
Using global analysis methods, we extracted the pure optical spectra for Ole-I and Int-2. A comparison of the optical spectra of these species with ferric low-spin Fe3+-OH
2 OleT is shown in Fig. 2.14. The optical spectrum of Int-2 has
characteristics that are highly similar to those reported for protonated thiolate Fe4+
hydroxide complexes prepared in P450 45 and the thiolate ligated heme
peroxygenase Aae-APO 46. Notably, Int-2 is characterized by a Soret maximum at λmax = 426 nm that is clearly red-shifted and has a lower molar extinction
coefficient relative to the Fe3+-OH
2 form of the enzyme. Int-2 also exhibits a split
45
Figure 2.14 The pure component spectra of OleT Int-2 (orange) and
Compound I (green) as obtained from global fitting analysis of photodiode array data, and compared to the ferric-H2O low-spin enzyme (blue).
In order to rule out the possibility that Int-2 could be more appropriately assigned as a deprotonated ferric-hydroxide species (Fe3+-OH), which in principle
could arise from hydrogen abstraction and ensuing rapid electron transfer from the substrate or a neighboring redox active amino acid, this form of the enzyme was generated for direct comparison. The addition of strong base to the substrate free Fe3+-OH
2 enzyme results in generation of a transiently stable Fe3+-OH (Fig. 2.15).
Notably, the Fe3+-OH species did not exhibit any of the principle optical
46
A model-independent approach was also used to verify the optical features of Int-2 obtained from global analysis. Following Ole-I depletion, the reaction consists of only two principle absorbing species, Int-2 and Fe3+-H
2O. As a result,
the spectrum of Int-2 can be simply derived at any timeframe from a linear combination of two spectra, one known. No additional input of kinetic parameters is necessary. This subtraction method consistently reproduced the same Int-2 spectrum determined from global analysis (Fig. 2.16). Moreover, the relative composition of each species is in excellent agreement with those computed using rate constants from the kinetic model.
Additional support for the assignment of Int-2 as having an oxidation state higher than Fe3+ is provided through an examination of its reactivity in
double-mixing studies. Thiolate ligated Compound II species, including that of chloroperoxidase (CPO-II) 47 and AaeAPO (APO-II) 46 are able to oxidize phenols,
albeit with variable proficiency. Int-2 was first prepared by mixing the EA-H39
bound enzyme with H2O2 to favor the rapid depletion of Ole-I and formation of
Int-2. After a 20 ms aging time, various concentrations of pH buffered phenols were added in a second push. The decay of Int-2 was measured at 440 nm and fit to a single exponential decay process (kobs) (Fig. 2.17). The addition of phenols
significantly accelerated the decay of Int-2 in a concentration dependent manner. This, along with the optical characterization of Int-2, rules out possible interpretation a Fe3+-OH species, which is inert to phenols. Representative plots
47
Figure 2.15 (A) Comparison of the optical absorption spectra of OleT Int-2 (red), ferric-H2O (blue), and ferric-OH (black) forms of the
enzyme. The ferric-hydroxide form was generated by a rapid pH jump to 12, and is stable for several seconds prior to decomposition. (B) Difference spectra of the ferric-hydroxide (black) and Int-2 minus ferric-H2O (red) forms show that the two species are readily
48
Figure 2.16 Kinetics independent computation of the Int-2 optical spectrum by the linear combination of two spectra. The H39-EA (A-C) or D39-EA (D-I) reaction
was analyzed at the time points indicated above each column. The Int-2 spectrum was reproduced by subtracting varying amounts of a ferric –H2O component. A
comparison of the Int-2 spectra produced by linear subtraction and from SVD is shown in the middle panel (B, E, H). Speciation plots for Int-2 and the ferric low-spin state based on rates obtained from global analysis are shown in the bottom panel (C, F, I). A dashed line shows the predicted fraction of each species at the time point of interest
49
Fig 2.17 Double mixing studies to probe the reactivity of Int-2 towards phenols. Int-2 was generated by mixing 40 μM OleT:H39-EA with 4 mM H2O2. After aging for 20 ms, the
resulting solution was mixed 1:1 with buffered phenols at various concentrations. Representative time traces at 440 nm and superimposed single exponential fits (red) are shown for a reaction with no phenol (black) and with 10 mM 4-Cl-phenol (gray). The observed rates for these reactions are kobs = 7.3 s-1
and 26.7 s-1 respectively.
Figure 2.18 Plot of the apparent Int-2 decay rate constant with phenol (circle) and 3-chlorophenol (square). OleT-H39EA (40
μM) was mixed with 2 mM H2O2, aged 20 ms and then mixed 1:1
50
Table 2.2 Summary of reactivity of Int-2 with various substituted phenols
substituent k
(mM-1 s-1)
none 1.00 ± 0.07 3-Cl 4.69 ± 0.29 4-Cl 1.72 ± 0.42 4-OMe 0.94 ± 0.08 4-Me 1.06 ± 0.03
Discussion
Transient kinetics directly demonstrate that a P450 Compound I oxidant can carry out reactions that do not get finalized by an oxygen rebound step. Although alternative reactions for CYP-I species have been proposed for decades, prompting considerable discussion, the highly fleeting nature of Compound I prevented prior observation of such a reaction taking place. The ability to rapidly trigger catalysis with the native oxidant utilized by the enzyme in the presence of a tightly bound substrate, and fortuitous rate constants for intermediate interconversions, provides direct insight into the origins for the impressive metabolic versatility of CYP oxidations. As a result of the visualization of two ferryl intermediates during OleT catalysis, C-C bond cleavage can be added to the diverse repertoire of transformations catalyzed by metal-oxo species.
51
thought to be mediated by formation of a nucleophilic iron-peroxide intermediate
49. This species is different from the highly oxidizing dinuclear Fe4+ cluster more
commonly utilized by structurally related monooxygenases 13. Recently, a family
of unrelated non-heme Fe2+ dependent enzymes (UndA) has also been shown to
catalyze the conversion of medium chain length Cn fatty acids to Cn-1 alkenes 50.
Although the active oxidant involved in this O2 dependent reaction has yet to be
clarified, a Fe3+ superoxide intermediate has been proposed on the basis of the
enzyme having no strict requirement for a reductant to facilitate O-O heterolysis. The 2H substrate KIE for Ole-I decay demonstrates that alkene synthesis is not
accommodated by the use of an alternative active-site oxidant that precedes Compound I, nor from the rearrangement of an oxidized product. Instead, the OleT reaction coordinate diverges after C-H abstraction, and results from an apparent suppression of radical recombination.
The remarkable stability of Ole-II provides a framework to compare OleT catalysis with hallmark CYP monooxygenations. Although thiolate ligated Compound II species have recently been prepared in both CYP 45 and Aae-APO 46 enzymes, these species are produced from the deleterious oxidation of nearby
aromatic amino acids from the protein framework (CYP), or by the addition of suitable poised reductants to rapidly quench Compound I (Aae-APO), rendering them quasi stable. The catalytic efficiency of the H2O2 single turnover system 35
and kinetic behavior of the Fe4+-OH species observed in OleT demonstrates that