Article
Thermal Expansion Model of Cement Paste and
Concrete Considering Micro-Structural Changes
under Elevated Temperature
Jaesung Lee 1, Yunping Xi 2,* and Seungcho Yang 1
1 Department of Architectural Engineering, Hannam University, 70, Hannam-ro, Daedeok-gu, Daejeon, Republic of Korea; [email protected], [email protected]
2 Department of Civil Engineering, University of Colorado, Boulder, CO, 80309, USA
* Correspondence: [email protected]; Tel.: +1-303-492-8991 (Y. Xi)
Abstract: The expansion of concrete subjected to extreme elevated temperature is linked with intricate micro-structural variations, such as the transformation of the constituent phases. This study proposes a model to predict the thermal expansion of cement paste and concrete considering micro-structural changes under elevated temperatures ranging from 20°C to 800°C. The model presented can consider characteristics of various aggregates in the calculation of thermal expansion for concrete. The model is a combination of a multi-scale stoichiometric model and a multi-scale composite model. At the cement paste level, the model satisfactorily predicted a test result. At concrete level, upper bounds from the model were matched relatively well with test results by previous researcher. If the mechanical properties, such as elastic modulus (E), Poisson’s ratio (ν), and thermal deformation, of the aggregates used in concrete are given, it is likely that the model will reasonably predict experimental results.
Keywords: Phase change; Composite; Thermal expansion; High temperature; Concrete
1. Introduction
Under extreme elevated temperatures, concrete undergoes intricate physicochemical changes. Various studies of the constituents in concrete have been conducted to investigate essential causes for these physiochemical changes on different scales. In 1970, Harmathy considered theoretical models with experimental data that contained various thermal properties of cement paste, aggregates, and concrete under high temperature[1]. Harada et al., conducted experiments investigating the thermal properties with concrete containing aggregates of varying physical properties under high temperature[2]. Piasta conducted experiments for heat deformation of phases present in hardened cement paste for temperatures between 20-800°C[3]. Piasta also studied studied the reactions of
2
( )
Ca OH , CaCO3(calcite), C− −S H, non-evaporable water and micro-pores using thermal analysis
(TA), X-ray diffraction analysis, infrared spectroscopy analysis and mercury porosity[4]. Cruz et al. conducted an experimental study for thermal expansion of Portland cement, mortar, and concrete[5]. These test results showed that the thermal strain of cement paste is greatly affected by the heating rate rather than curing age. Schneider and Herbst performed a study on the chemical reactions of the hydrate phase of hardened cement paste through elevated temperatures[6]. In a study conducted by Lin et al. the microstructure of concrete exposed to elevated temperatures in both actual fire and laboratory conditions were evaluated with the use of Scanning-Electron-Microscopy (SEM) and stereo microscopy. Wang et al. used SEM to examine the cracking of high performance concrete (HPC) exposed to high temperatures under axial compressive loading of about 200N[7]. Bastami et al. analyzed the thermal deformation of concrete at high temperature according to stress and temperature based on previous research results[8]. The parameters used in this experiment are the stress and heating temperature, the maximum stress of the concrete is 95Mpa, and the maximum
heating temperature is 700 ℃. As a result of comparing the thermal expansion of the concrete according to the temperature with the experimental value and the existing prediction formula, errors up to 20% were found. Hager conducted an experimental study for thermal expansion of concrete by type of aggregates (limestone, siliceous sand, basalt and calcareous quartz sand)[9]. These test results showed that the thermal strain of aggregates affected by the composition of aggregates.
However, despite various experimental studies, a thermal expansion model of concrete considering each phase transformation due increasing temperature from the micro-scale level has not yet been developed. This study proposes a model to predict the thermal expansion of cement paste and concrete considering micro-structural changes under elevated temperature ranging from 20°C to 800°C. The model was obtained by combining a multi-scale stoichiometric model considering micro-structural variations due to high temperature, and a multi-scale composite model proposed by Xi and Jennings[10].
2. The Volume Fraction of Concrete Constituent Phase at Elevated Temperature
Thermal expansion prediction model of concrete at high temperature is determined by combining a multi-scale stochastic model and a multi-scale composite model. This section briefly describes the multi-scale stoichiometry model used to predict the thermal expansion of concrete with increasing temperature. The multi-scale stoichiometry model of concrete with temperature rise proposed by Lee[11] was used to predict the modulus of elasticity of concrete at high temperatures. Properties of concrete decreases with increasing temperature. The main cause of this phenomenon is caused by two main mechanisms. The first one is related to the temperature sensitivity of the mechanical and thermal properties of the constituents in concrete. Thermal expansion or stiffness of each constituent decreases with increasing temperature, which leads to the degradation of the composite. The second mechanism is related to phase transformations of constituents at different temperatures. The initial constituents of concrete transform to other phases due to elevated temperature. The new phases tend to have lower stiffness than the original phases. Therefore, Lee analyzed the physical and chemical behavior under high temperature. In this study, the thermal expansion of concrete was predicted by Lee's model which is the volume faction of concrete constituent phase at elevated temperature. This chapter briefly explains the prediction of volume factions of the concrete constituent phase at elevated temperature.
In order to predict the phase change of the cement paste at high temperature, the initial volume fraction of components with mixing ration should be calculated. The total volume in expressed by Equation (1)
_ . ( ) ( ) ( ) ( ) ( ) capillary voids( )
total ck
level c p w i C S H CH AL
i
V =V t +
V t +V − − t +V t +V t +V t(1)
w
V is the volume of the remaining water, determined by subtraction of the water consumed during hydration from the initial water content. ck
i
V is the volume of the hydrated clinker phases in the cement, determined by the clinker of hydration degree. C S H- - and CH are produced by the hydration of C S3 and C S2 . VC S H− − and VCH is determined by the hydration of C S3 and C S2 .
_ .
total level c p
V is calculated from the initial volume of the cement and water in the mixture because the value is constant with time. The volume fraction occupied by aluminates is calculated from Equation (2) and (3)
_ .
i i
i total o o
level c p c w
V V
f
V V V
= =
+
(2)
capillary voids
1 ck
AL C S H i CH w
i
f f − − f f f f
= − + + + +
(3)
paste and sand can be calculated from Equation (4). The volume fraction at the concrete level are obtained by considering the coarse aggregate and the mortar in Equation (5).
/
; 1
/ / /
o
s s s
s o o o cp s
c c w w s s
c w s
f u
f f f
u u u
f f f
= = = −
+ +
+ + (4)
/
; 1
/ / / /
o
g g g
g o o o o m g
c c w w s s g g
c w s a
f u
f f f
u u u u
f f f f
= = = −
+ + +
+ + + (5)
The initial volume fraction of constituents in concrete will change when the concrete is exposed to high temperature. The changes of the volume fractions can be characterized by considering the phase transformation in the concrete under different ranges of high temperature. However, it is difficult to calculate the phase transformations exactly with temperature increase. Lee formulated some hypothesis to predict the phase transformations in concrete under high temperature[11]. The hypothesis are based on the decomposition of constituents in concrete at elevated temperatures. Table 1 shows processes of decomposition depending on the temperature regime.
Table 1.Processes of decomposition depending on the temperature regime
Temperature Decomposition
20-120°C Evaporation of free water, Dehydration of C-S-H and Ettringite 120-400°C Dehydration of C-S-H
400-530°C Dehydration of C-S-H, Dehydration of CH
530-640°C Dehydration of C-S-H, Decomposition of poorly crystallized CaCO3
640-800°C Dehydration of C-S-H , Decomposition of CaCO3
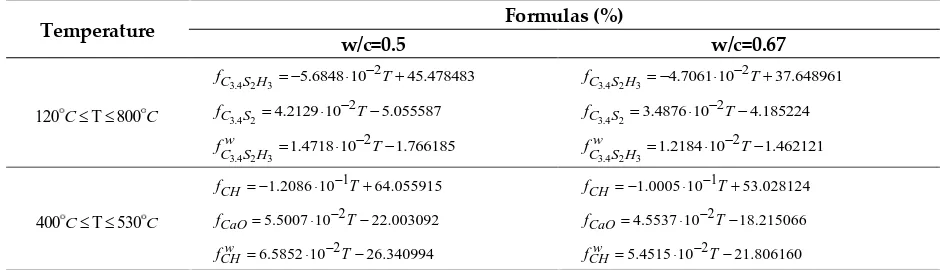
The theoretical formulas for the volume fraction of each phase considering temperature and w/c ratio are obtained from schemes described by Lee[11]. Table 2 shows theoretical formulas for volume fraction change of each phase
Table 2.Theoretical formulas for volume fraction change of each phase
Temperature Formulas (%)
w/c=0.5 w/c=0.67
120C T 800C
3.4 2 3
2
5.6848 10 45.478483 C S H
f = − − T+
3.4 2 3
2
4.7061 10 37.648961 C S H
f = − − T+
3.4 2
2
4.2129 10 5.055587 C S
f = −T−
3.4 2
2
3.4876 10 4.185224 C S
f = −T−
3.4 2 3
2
1.4718 10 1.766185 w
C S H
f = −T−
3.4 2 3
2
1.2184 10 1.462121 w
C S H
f = −T−
400C T 530C
1
1.2086 10 64.055915 CH
f = − −T+ fCH= −1.0005 10 −1T+53.028124
2
5.5007 10 22.003092 CaO
f = −T− fCaO=4.5537 10 −2T−18.215066
2
6.5852 10 26.340994 w
CH
f = −T− fCHw =5.4515 10 −2T−21.806160
At an elevated temperature, sand and gravel in the mortar or concrete expand. However, the expansion is small compared to the initial volume. Therefore, the total volume of aggregates is assumed to be constant in the calculation for the volume fractions of sand and gravels. The volume fractions of each phase with respect to temperature increase at the mortar and concrete levels are calculated with Equation (6) and (7).
'_ _
i mortar i cp mortar
f = f f ; fs motar_ = fs, at mortar level (6)
'_
i con i cp m
In which, fi is the volume fraction for C3.4 2S H3, CH, AL, C3.4 2S , CaO, and void_cement
which changed with temperature increase at the cement paste level.
3. A Multi-Scale Composite Model
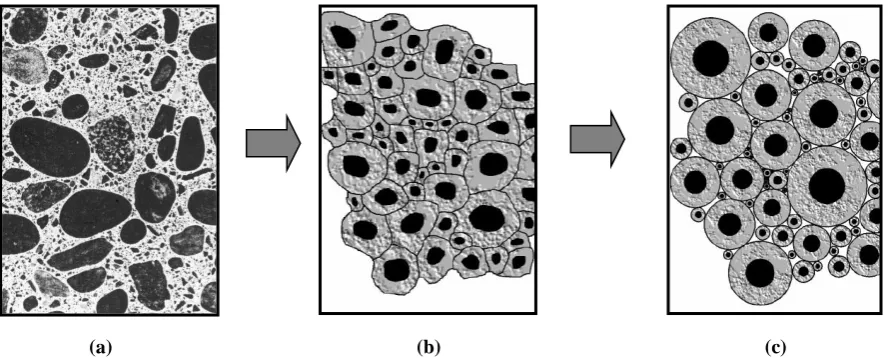
Concrete is a heterogeneous material in which constituents are distributed randomly. Thus, there is no exact solution in modeling material properties considering constituents in concrete. To simplify the internal structure of a material, composite models for effective properties have been developed. The three phase model developed by Cristensen was originally developed for elastic properties only[12,13], but Herve and Zauoi have shown that the model can be extended to nonlinear materials[14].
(a) (b) (c)
Figure 1. Simplification to spherical model. (a) Concrete, (b) Partitioning, (c) Spherical model
Figure 2. Three-phase effective media model
In Figure 1, the meso-structure of concrete (Figure 1a) can be expressed as Figure 1b by partitioning aggregate and matrix. In the spherical model the partitions are simplified using spherical elements, Figure 1c, such that the volume fraction of each phase and internal structure in an element are the same regardless of the size of elements. The spherical elements have three dimensional feathers, reducing the problem to one dimension[10]. On the nanometer and micrometer scales, the spherical model can be applied. Figure 2 shows the three-phase effective media model, where phase 3 is the effective homogeneous medium made equivalent to the heterogeneous medium.
Xi and Jennings proposed a model for shrinkage of cement paste and concrete using the effective homogeneous theory[10]. The proposed thermal expansion model is obtained by combining the multi-scale composite model proposed by Xi and Jennings and the multi-multi-scale stoichiometric model described in section 2. Although the model by Xi and Jennings is for shrinkage, it can also be used for effective
Effective homogeneous medium
Phase1
Phase2
Effective homogeneous medium
Phase1
thermal expansion in a heterogeneous medium. The effective bulk modulus and strain for the effective homogeneous phase shown in Figure 2 are expressed using Equation (8) and Equation (9)respectively.
(
)
1 1 2 1 2 12 21 1 2
1 2 2 2 1 1 4 3 eff V K K V V K K
V K K
V V K G
− + = + − + − + + (8)
(
)
(
)
(
)
(
)
1 11 1 2 2 2 2 1 2
1 2 1 2
12
1
2 2 2 2 2 1
1 2
3 4 1 3 4
3 4 4
eff
V V
K K G K K G
V V V V
V
K K G G K K
V V + + − + + + = + − − + (9)
In which, Ki, Vi and Gi are the bulk modulus, volume fraction, and shear modulus of phase i
, respectively. For multiphase, the effective bulk modulus and strain are delineated as Equation. (10), (11) and (12)[10].
( )
( )
(
)
( )
1, 1 1 1, 1 1 4 3i i eff i i
eff i i
eff i i i i
i i
c K K
K K K K c K G − − − − − = + − + − +
(10)
( )
( ) ( )
1( )
1 1,(
)
(
1,( )
)
( )
11,
1 1
3 4 1 4 3
3 4 4
eff i eff i i i i i i i i i i eff i
eff i
i eff i i i i i i eff i
K c K G K c G K
K K G c G K K
− − − − − − − − + + − + = + − −
(11)
where N i 2;
( )
Keff 1=K1 and( )
eff 1=1.Parameter ci−1,i is:
1 1,
1 1
i i
i i j j
j j
c V V
− −
= =
=
for N i 2 and1 1,
1
1 N
N N j N
j
c V V
− −
=
=
= − for i=N (12)The parameters Gi and Ki can be expressed easily in terms of elastic modulus and Poisson’s
ratio. From elastic theory, Ki =Ei/ 3(1 2 )− i and Gi =Ei/ 2 (1+i).
4. Material Properties of Constituents
To predict thermal expansion the information for the stiffness, Poisson’s ratio, and thermal expansion of each phase should be given.
Figure 3. Thermal strain test data of dehydrated substances
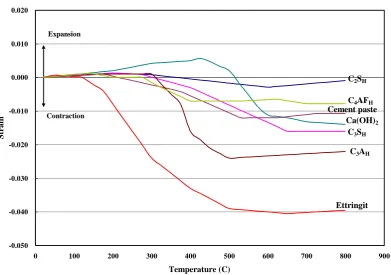
Figure 4. Thermal strain test data of hydrated substances
Generally up to 150°C hydrate substances expand because the expansion in the dehydrated parts is more prevalent than the shrinkage of hydrated parts[3]. At temperatures above 150°C shrinkage prevails due to dehydration.
In phases considered for the model at the cement paste level are C3.4 2S H3, C3.4 2S , CH, CaO,
aluminum hydrates, and void space. The test data of CH and CaO shown in Figure 3 are used in the model. However, because there is no exact information for the thermal strain of the chemical components C3.4 2S and C3.4 2S H3 from literatures, the average thermal strain of C S2 H and C S3 H
0.000 0.005 0.010 0.015 0.020 0.025 0.030 0.035 0.040
0 100 200 300 400 500 600 700 800 900
Temperature (C)
S
tr
ai
n
C2S
Potland Cement
C4AF
C3S
CaO
C3A
-0.050 -0.040 -0.030 -0.020 -0.010 0.000 0.010 0.020
0 100 200 300 400 500 600 700 800 900
Temperature (C)
S
tr
ai
n
C2SH
Cement paste
C4AFH
C3SH
Ettringit e
C3AH
Expansion
Contraction
are shown in Figure 4 and is used as the thermal strain for C3.4 2S H3. The thermal stain of C3.4 2S is
assumed on the basis of the test data for C S2 and C S2 in Figure 3.
In the model, the thermal strain for alumina hydrates should be considered because the thermal deformations of alumina hydrates, i.e. ettringite and C A3 H are large compared to other components,
shown in Figure 4. In cement paste, alumina hydrates exist in various chemical components which make it difficult to create a model that contains the all chemical components for alumina hydrates. Usually, the hydration of C A3 and C AF3 in Portland cement involve reactions with sulfate ions
which are supplied by the dissolution of gypsum. The primary reactions of C A3 and C AF3 are
expressed with Equation. (13) and (14) respectively[16]
3 3 2( ) 26 6 3 32( )
C A+ CSH gypsum + H→C AS H ettringite (13)
4 3 2( ) 21 6( , ) 3 32 ( , ) 3
C AF+ CSH gypsum + H→C A F S H + A F H (14)
Ettringite is the first hydrate to crystallize because of the high ratio of sulfate to aluminates in the solution phase during the first hour of hydration. In Portland cement, which contains 5-6 percent gypsum, ettringite contributes to early strength development. After the depletion of sulfate when the aluminate concentration goes up again due to renewed hydration of C A3 and C AF4 , ettringite
becomes unstable and is gradually converted into monosulfate, the final product[17]. Equation. (15) contains the chemical reaction from ettringite to monosulfate. Equation. (16) shows the chemical reaction converted from C A F S H6( , ) 3 32 to 3C A F SH4( , ) 12.
6 3 32( ) 2 3 4 3 4 12( )
C AS H ettringite + C A+ H→ C ASH monosulfate (15)
6( , ) 3 32 4 7 3 4( , ) 12 ( , ) 3
C A F S H +C AF+ H→ C A F SH + A F H (16)
In Equation. (14) and Equation. (16), iron oxide plays the same role as alumina during hydration. F can substitute for A in the hydration products. The use of a formula such as C A F S H6( , ) 3 32 indicates
that iron oxide and alumina occur interchangeably in the compound, but the A/F ratio need not be the same as that of the parent compound. When monosulfate comes in contact with a new source of sulfate ions ettringite can be formed once again. This potential for reforming ettringite is the basis for sulfate attack on Portland cement[16]. In the current model alumina hydrates are assumed as monosulfate. However, the information for thermal strain of monosulfate could not be found from literatures. As a matter of fact, there is no known mineral of monosulfate. Thus, the thermal strain of the monosulfate is assumed on the basis of the test data of C A3 H and ettringite shown in Figure 4. Table 3 is a summary
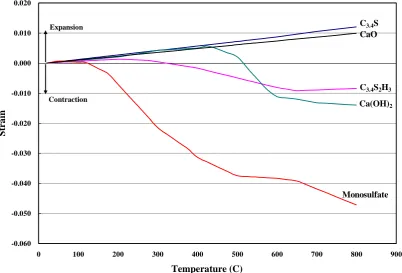
Figure 5. Thermal strains of phases in cement paste used in model
-0.060 -0.050 -0.040 -0.030 -0.020 -0.010 0.000 0.010 0.020
0 100 200 300 400 500 600 700 800 900
Temperature (C)
St
ra
in
C3.4S
C3.4S2H3
Monosulfate CaO
Expansion
Contraction
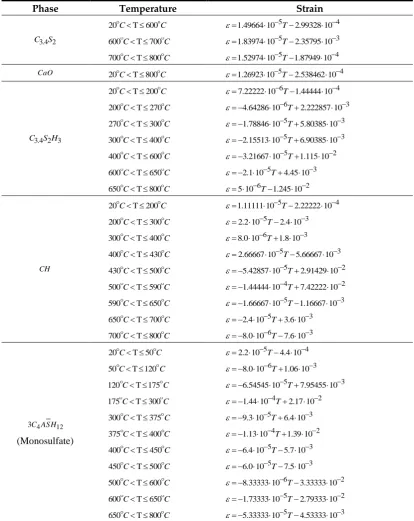
Table 3. Summary for thermal strain of phases in cement paste used in model
Phase Temperature Strain
3.4 2
C S
20C T 600C =1.49664 10 −5T−2.99328 10 −4 600C T 700C =1.83974 10 −5T−2.35795 10 −3 700C T 800C =1.52974 10 −5T−1.87949 10 −4
CaO 20C T 800C =1.26923 10 −5T−2.538462 10 −4
3.4 2 3
C S H
20C T 200C =7.22222 10 −6T−1.44444 10 −4 200C T 270C = −4.64286 10 −6T+2.222857 10 −3 270C T 300C = −1.78846 10 −5T+5.80385 10 −3 300C T 400C = −2.15513 10 −5T+6.90385 10 −3 400C T 600C = −3.21667 10 −5T+1.115 10 −2 600C T 650C = − 2.1 10−5T+4.45 10 −3 650C T 800C = 5 10−6T−1.245 10 −2
CH
20C T 200C =1.11111 10 −5T−2.22222 10 −4 200C T 300C =2.2 10 −5T−2.4 10 −3 300C T 400C =8.0 10 −6T+1.8 10 −3 400C T 430C =2.66667 10 −5T−5.66667 10 −3 430C T 500C = −5.42857 10 −5T+2.91429 10 −2 500C T 590C = −1.44444 10 −4T+7.42222 10 −2 590C T 650C = −1.66667 10 −5T−1.16667 10 −3 650C T 700C = −2.4 10 −5T+3.6 10 −3 700C T 800C = −8.0 10 −6T−7.6 10 −3
4 12
3C ASH (Monosulfate)
Table 4. Elastic properties of each phase
Phases E Gpa( ) v( )− References
CSH
314
29.42.4
-
0.24
Acker (2001)
Constantinides and Ulm (2004)
3
C S
1475
1357
0.3
0.3
Acker (2001)
Velez et al. (2001)
2
C S
140 10
13020
0.3
0.3
Acker (2001)
Velez et al. (2001)
CH
35.24
48
39.77−44.22
363
385
-
-
0.305−0.325
-
-
Beaudoin (1983)
Wittmann (1986)
Monteriro and Chang
Acker (2001)
Constantinides and Ulm (2004)
CaO 194.540.5 0.207 Oda et al. (1992)
3
C A
160 10
145 10
-
-
Acker (2001)
Velez et al. (2001)
3
C AF 12525 - Velez et al. (2001)
Table 4 is a summary of the elastic properties of the phases obtained from literatures. It is noticed that the elastic modulus of CSdecomposed from C− −S H and CaO decomposed from CH vary depending on the porosity of the phase. The porosity of CaO and C3.4 2S are calculated using the
volume fractions of phases decomposed from CH and C3.4 2S H3. The functions are shown in
Equation. (17).
2
2 _
_ _
H O CH CaO
CaO CH H O CH
V
p
V
V
=
+
;
2 3.4 2 3 3.4 2
3.4 2 3.4 2 3 2 3.4 2 3 _
_ _
H O C S H C S
C S C S H H O C S H
V
p
V
V
=
+
(17)
Table 5. Elastic modulus of each phase used in the current model
Phases pi (Porosity) E (Gpa)
3.4 2 3
C S H - 32.0
3.4 2
C S 0.26 29.79 [from
3.4 2 120 (1 C S )n
E= −p , n=4.65]
CH - 40.2
CaO 0.54 8.35 [fromE=194.54 (1 −pCaO)n, n=4]
Monosulfate 0.25 40.0
Void - 0
Table 5 shows the elastic modulus of phases used in the model. The functions for the elastic modulus of CaO and C3.4 2S with respect to porosity are modified in the basis of empirical functions
by Velez et al[18]. The fixed variable (n) in the function, on Table 5, for the elastic modulus of CaOis assumed as 4, which is an average value for variables used in the functions for C S2 and C A2 . The
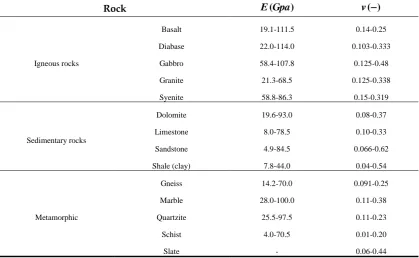
of various aggregates are summarized in Table 6. It should be noticed that there are no consistency for the properties in the Table 6 because the chemical portions consisting rocks are different each other, even if the rocks are called with the same name.
Table 6. Elastic properties of various aggregates (Jumijis, 1983)
Rock E Gpa( ) v( )−
Igneous rocks
Basalt 19.1-111.5 0.14-0.25
Diabase 22.0-114.0 0.103-0.333
Gabbro 58.4-107.8 0.125-0.48
Granite 21.3-68.5 0.125-0.338
Syenite 58.8-86.3 0.15-0.319
Sedimentary rocks
Dolomite 19.6-93.0 0.08-0.37
Limestone 8.0-78.5 0.10-0.33
Sandstone 4.9-84.5 0.066-0.62
Shale (clay) 7.8-44.0 0.04-0.54
Metamorphic
Gneiss 14.2-70.0 0.091-0.25
Marble 28.0-100.0 0.11-0.38
Quartzite 25.5-97.5 0.11-0.23
Schist 4.0-70.5 0.01-0.20
Slate - 0.06-0.44
Table 7 shows the thermal strain functions of sandstone and limestone obtained from curve fitting of test data by Soles and Geller[19].
Table 7. Summary for thermal strain of limestone and sandstone
Phase Temperature Strain
Sandstone
20C T 600C =4.0 10 −14T4−2.0 10 −11 3T +2.0 10 −8 2T +9.0 10 −6T−0.0002 600C T 650C =1.75 10 −5T+2.625 10 −3
650C T 800C =3.80 10 −6T+1.153 10 −2
Limestone 20C T 800C =4.0 10 −12 3T +1.0 10 −8 2T +9.0 10 −6T−0.0003
5. Comparison between model and experimental results
Figure 6. Arrangement of phases in cement paste
Before cement paste is exposed to high temperature, void and crystal phases are surrounded by gel phase. When cement paste are exposed to high temperature, the decomposed solid phases, ie CaO
from CH and C3.4 2S from C3.4 2S H3 are located in close proximity to primary phases and the
decomposed voids from C3.4 2S H3 and CH are located at the center of cement paste in the model. The
Figure 7. Comparison between model and experimental data for cement paste
Table 8 is a summary for the thermal strain functions according to temperature rage of cement paste with w/c=0.5 obtained from the model.
Table 8. Summary for thermal strain functions of cement paste from model (w/c=0.5)
From model Temperature Strain
Cement
paste
20C T 50C =1.17667 10 −5T−2.35333 10 −4 50C T 120C =4.62857 10 −6T+1.21571 10 −4 120C T 175C = −8.60 10 −6T+1.709 10 −3 175C T 300C = −3.0032 10 −5T+5.4596 10 −3 300C T 400C = −2.493 10 −5T+3.929 10 −3 400C T 425C = −3.80 10 −5T+9.157 10 −3 425C T 500C = −5.712 10 −5T+1.7283 10 −2 500C T 530C = −3.66 10 −5T+7.023 10 −3 530C T 575C =4.66667 10 −6T−1.48483 10 −2 575C T 625C =9.32 10 −6T−1.7524 10 −2 625C T 650C =1.264 10 −5T−1.9599 10 −2 650C T 800C =5.08667 10 −6T−1.46893 10 −2
-0.015 -0.013 -0.011 -0.009 -0.007 -0.005 -0.003 -0.001 0.001 0.003 0.005
0 100 200 300 400 500 600 700 800 900
Temperature (C)
S
tr
ai
n
Cement paste_Exp. [(Piasta, 1984a), w/c=0.5]
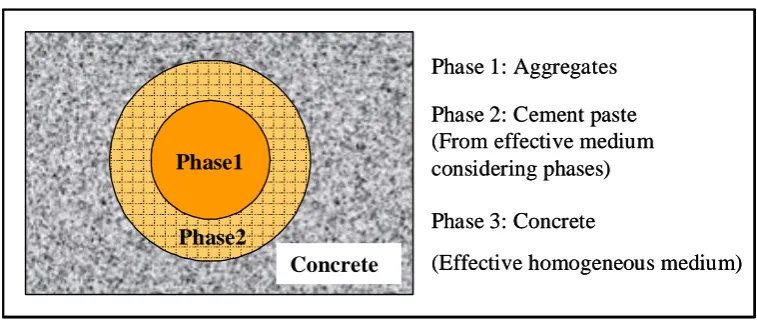
Figure 8. Arrangement of phases in concrete
In calculation of thermal strain of concrete from model, Figure 8 shows that aggregates are surrounded by cement paste. The bulk moduli of cement paste according to temperature increase are calculated using Equation (10) with the volume fractions of phases according to temperature increase from the multi-scale stoichiometric model. In application of Equation (9) to calculate thermal expansion of concrete from the model, shear modulus of cement paste is calculated using the mixture theory of Equation (18).
1
N
cp i i
i
G f G
=
=
(18)In which, Gi and fi , which changed with temperature increase, are the shear modulus and the
volume fraction for C3.4 2S H3, CH, Monosulfate, C3.4 2S , and CaO calculated at cement paste level.
Figure 9. Comparison between model and experimental data for limestone concrete
Phase1
Phase2
Concrete
Phase 3: Concrete
(Effective homogeneous medium)
Phase 2: Cement paste
(From effective medium
considering phases)
Phase 1: Aggregates
Phase1
Phase2
Concrete
Phase 3: Concrete
(Effective homogeneous medium)
Phase 2: Cement paste
(From effective medium
considering phases)
Phase 1: Aggregates
Phase1
Phase2
Concrete
Phase 3: Concrete
(Effective homogeneous medium)
Phase 2: Cement paste
(From effective medium
considering phases)
Phase 1: Aggregates
-0.005 0.000 0.005 0.010 0.015 0.020
0 100 200 300 400 500 600 700 800 900
Temperature (C)
S
tr
ai
n
Figure 10. Comparison between model and experimental data for sandstone concrete
In the ranges of material properties of aggregates given in Table 6, the upper and lower bounds for strains of limestone concrete and sandstone concrete are shown in Figure 9 and Figure 10 with the test data, respectively. The functions, which are based on the test data of Soles and Geller [19], in Table 7 were used as the thermal strains of the aggregates in the model. The test data by Scheider [6] were plotted in Figure 9 and Figure 10. The test samples by Scheider [6] were sleeve shaped with diameter 80mm and height 300mm. The samples were cured for 750days under the condition of 65% relative humidity at a temperature of 20 2 °C after water curing for 7 days. The test data for the sandstone concrete is contained between the upper and lower bound from the model. While the test data of the limestone concrete is a little higher than the upper bound from the model. The upper bounds from the model are matched relatively well with the test results.
The rocks have different material properties due to different chemical portions in the rocks, even if they have the same name, the thermal strains are also different from each other. In the model, the test data of the aggregates by Soles and Geller[19] was used to calculate the thermal strains of limestone concrete and sandstone concrete. The test data for the concretes used to compare with the model is from Scheider[6]. When aggregates and concrete (containing the same aggregates) undergo the same test conditions, and the material properties of the aggregates are given, it is likely that the proposed model predicts the thermal expansion of concrete reasonably.
5. Conclusions
(1) At cement paste level, the model, obtained by a combination of the multi-scale composite model and the multi-scale stoichiometric model, was compared with test results from Piasta[3], and satisfactorily predicted them.
(2) The test data for the sandstone concrete was contained in the upper bound and lower bound from the model. While the test data for limestone concrete was a little higher than the upper bound from the model.
(3) At concrete level, the upper bounds from the model were matched relatively well with test results by Scheider[6].
(4) The thermal deformation of the aggregates used is an important factor in the thermal deformation of concrete because aggregates occupy about 70% of the total volume of concrete. When aggregates and concrete (containing the same aggregates) undergo the same test conditions, and the material
-0.005 0.000 0.005 0.010 0.015 0.020
0 100 200 300 400 500 600 700 800 900
Temperature (C)
S
tr
ai
n
properties of the aggregates are given, it is likely that the proposed model predicts the thermal expansion of concrete reasonably.
Author Contributions: Conceptualization, Jaesung Lee and Yunping Xi; Formal analysis, Seungcho Yang; Methodology, Yunping Xi; Writing – original draft, Jaesung Lee and Seungcho Yang; Writing – review & editing, Jaesung Lee.
Funding: This research received no external funding
Acknowledgments: This research was supported by a grant(18AUDP-B100356-04) from Architecture & Urban Development Research Program funded by Ministry of Land, Infrastructure and Transport of Korean government.
Conflicts of Interest: The authors declare no conflict of interest.
References
1. Harmathy, T.J.J.o.M. Thermal properties of concrete at elevated temperatures. 1970.
2. Harada, T.; Takeda, J.; Yamane, S.; Furumura, F.J.S.P. Strength, elasticity and thermal properties of
concrete subjected to elevated temperatures. 1972, 34, 377-406.
3. Piasta, J.; Sawicz, Z.; Rudzinski, L.J.M.e.C. Changes in the structure of hardened cement paste due to
high temperature. 1984, 17, 291-296.
4. Piasta, J.J.M.e.C. Heat deformations of cement paste phases and the microstructure of cement paste.
1984, 17, 415-420.
5. Cruz, C.R.; Gillen, M.J.F.; materials. Thermal expansion of Portland cement paste, mortar and concrete
at high temperatures. 1980, 4, 66-70.
6. Schneider, U.; Herbst, H.J.D.A.f.S. Permeability and porosity of concrete at high temperature. 1989, 23-52.
7. Wang, X.-S.; Wu, B.-S.; Wang, Q.-Y.J.C.; Research, C. Online SEM investigation of microcrack
characteristics of concretes at various temperatures. 2005, 35, 1385-1390.
8. Bastami, M.; Aslani, F.; ESMAEILNIA, O.M. High-temperature mechanical properties of concrete. 2010. 9. Hager, I.J.B.o.t.P.A.o.S.T.S. Behaviour of cement concrete at high temperature. 2013, 61, 145-154. 10. Xi, Y.; Jennings, H.M.J.M.; Structures. Shrinkage of cement paste and concrete modelled by a multiscale
effective homogeneous theory. 1997, 30, 329.
11. Lee, J.; Xi, Y.; Willam, K.; Jung, Y.J.C.; Research, C. A multiscale model for modulus of elasticity of
concrete at high temperatures. 2009, 39, 754-762.
12. Christensen, R.; Lo, K.J.J.o.t.M.; Solids, P.o. Solutions for effective shear properties in three phase sphere
and cylinder models. 1979, 27, 315-330.
13. Christensen, R.M. Mechanics of composite materials; Courier Corporation: 2012.
14. Hervé, E.; Zaoui, A.J.E.j.o.m.A.S. Modelling the effective behavior of nonlinear matrix-inclusion
composites. 1990, 9, 505-515.
15. Okajima, S.J.M.S.t., Okayama University, Japan. Study of thermal properties of rock-forming minerals.
1978.
16. Mindess, S.; Young, J. Concrete Civil Engineering and Engineering Mechanics Series. Prentice-Hall,
New Jersey, USA: 1986.
17. Mehta, P.K. Concrete. Structure, properties and materials. 1986.
18. Velez, K.; Maximilien, S.; Damidot, D.; Fantozzi, G.; Sorrentino, F.J.C.; Research, C. Determination by
19. Soles, J.A.; Geller, L.B. Experimental studies relating mineralogical and petrographic features to the thermal
piercing of rocks; Queen's Printer: 1963.