Benchmark calculation for radioactivity inventory using MAXS library
based on JENDL-4.0 and JEFF-3.0/A for decommissioning BWR plants
Ken-ichi Tanaka
The Institute of Applied Energy, 1-14-2 Nishi-shinbashi, minato-ku, Tokyo, 105-003, Japan
Tokyo Institute of Technology, 2-12-N1-9 Ookayama, Meguro-ku, Tokyo 152-8550, Japan
Abstract. We performed benchmark calculation for radioactivity activated in a Primary
Containment Vessel (PCV) of a Boiling Water Reactor (BWR) by using MAXS library, which
was developed by collapsing with neutron energy spectra in the PCV of the BWR. Radioactivities
due to neutron irradiation were measured by using activation foil detector of Gold (Au) and
Nickel (Ni) at thirty locations in the PCV. We performed activation calculations of the foils with
SCALE5.1/ORIGEN-S code with irradiation conditions of each foil location as the benchmark
calculation. We compared calculations and measurements to estimate an effectiveness of MAXS
library.
1 Introduction
According to the Japanese law, any operating organization of decommissioning of nuclear facilities such as electric power companies needs to submit an application for decommissioning and to receive the authorization. Tasks for the decommissioning planning start with radiological characterization of the facilities. Reliable information about radioactivity inventory obtained from the task is much important to establish a decommissioning strategy and to perform decommissioning activities safely and rationally.
We performed benchmark calculation of radioactivity of activation foils irradiated by neutrons in a Primary Containment Vessel (PCV) of a Boiling Water Reactor (BWR) by using SCALE5.1/ORIGEN-S code [1] with MAXS library [2]. MAXS library is activation cross section data library for activation calculation in the PCV of the BWR.
Neutron energy spectra in the PCV of the BWR tend to show a peak in epi-thermal energy range. Thus, use of ORIGEN-S cross section library that was developed by collapsing cross sections with a typical neutron energy spectrum of a Light Water Reactor (LWR) is considered to be inappropriate under the condition in the PCV. In particular, applying it to estimations of a radionuclide generated by a reaction that has threshold energy would make a large ambiguity. To give values of cross sections by weighting with the neutron energy spectra in the PCV would be one of solutions.
problem mentioned above in JAEA based on JENDL-4.0 and JEFF-3.0/A. Activation cross sections are collapsed by using various neutron energy spectra in the PCV (e.g. core internals, a reactor pressure vessel,
PCV internals and a Biological Shielding Wall (BSW)). Furthermore, data of cross section for a number of reactions such as (n,γ), (n,p), (n,α),(n,2n) and so on were considered to generate the library.
We performed activation calculations at activation foils in the PCV of the BWR by using SCALE5.1/ORIGEN-S with MAXS library as a benchmark calculation. We compared calculated radioactivities with measured ones to estimate the effectiveness.
2 Outline of benchmark problem
2.1 A typical spectrum of a LWR and neutron energy spectra in the PCV of the BWR
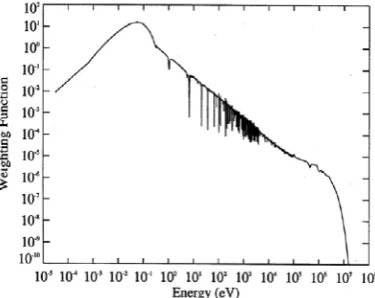
A typical spectrum of the LWR used as a weighting function in a generation of ORIGEN library is shown in Figure 1 [3].
Figure 1 A typical neutron energy spectrum of a Light Water Reactor used as a weighting function in a generation of ORIGEN library [3]
The typical spectrum is comprised of three kinds of spectra; thermal Maxwellian spectrum in thermal energy
range, 1/E spectrum in epi-thermal energy range and fission spectrum in fast energy range.The shape of the typical spectrum has been given as results from neutron transport phenomena which are supposed to be observed in the LWR. Emitting neutrons by nuclear fission and moderation by light water are being considered in the phenomena. However, the phenomena would be too simple to apply to a complicated structure like inside the PCV of the BWR.
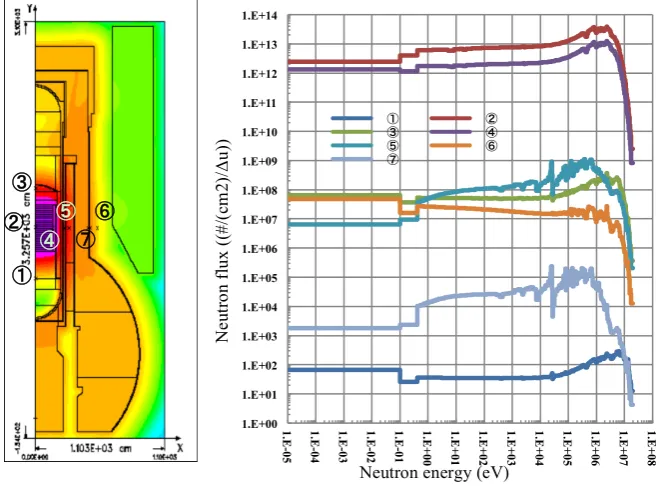
Various kinds of neutron transport phenomena occur in the PCV. Spectra around a reactor core such as
positions , , and are almost similar to a fission spectrum. Neutrons leak from the reactor core
and are moderated in coolant water flowing through an area between a shroud, which surrounds the reactor
core, and a reactor pressure vessel (RPV). Although a spectrum in the area shows a shape which similar to the
typical LWR spectrum, thermal neutrons are absorbed during penetrating the RPV. Because of a mechanism of
the transport phenomena mentioned here, spectra in the PCV tend to show a peak in epi-thermal range such as
positions and .
According to a comparison between the shape of the typical spectrum of a LWR and those of spectra in
the PCV of the BWR, it would be inappropriate to apply ORIGEN library, which is generated with the typical
spectrum, to activation calculation in the PCV. In the benchmark calculations, we applied MAXS library,
which is generated by collapsing with neutron energy spectrum at position , to activation calculation for
radioactiveities measured with activation foils in the PCV.
Figure 2 Neutron energy spectra in the PCV of the BWR
2.2 Radioactivity measurements with activation foil in the PCV
We measured radioactivities induced by neutrons in the PCV with three types of activation foils as
foil activation detectors; Gold (Au) foils, Gold foils covered by Cadmium (Au+Cd) foils and Nickel (Ni) foils.
We can obtain radioactivities induced by neutron-flux of thermal energy range (thermal-flux: energy less than
1.0 eV) from a difference between measurements of Au foils and Au+Cd foils because Cd cover cuts off
thermal-flux on the Au+Cd foils, which measures radioactivities induced by neutron-flux of epi-thermal energy 1.E+00 1.E+01 1.E+02 1.E+03 1.E+04 1.E+05 1.E+06 1.E+07 1.E+08 1.E+09 1.E+10 1.E+11 1.E+12 1.E+13 1.E+14
1.E-05 1.E-04 1.E-03 1.E-02 1.E-01 1.E+
00 1.E+ 01 1.E+ 02 1.E+ 03 1.E+ 04 1.E+ 05 1.E+ 06 1.E+ 07 1.E+ 08
Neutron energy (eV)
range (epi-thermal-flux: energy within 1.0 eV to 1.0 MeV). We used Ni foils as threshold detectors to measure radioactivities induced by neutron-flux of fast energy range (fast-flux: energy higher than 1.0 MeV).
Activation foils at location 1 to 15 were irradiated from Feb. 17th 2001 to Feb.25th 2002; 373 days. Further, we added fifteen locations at 16 to 30 from Oct.26th 2004 to Nov.11th 2005; 381 days.
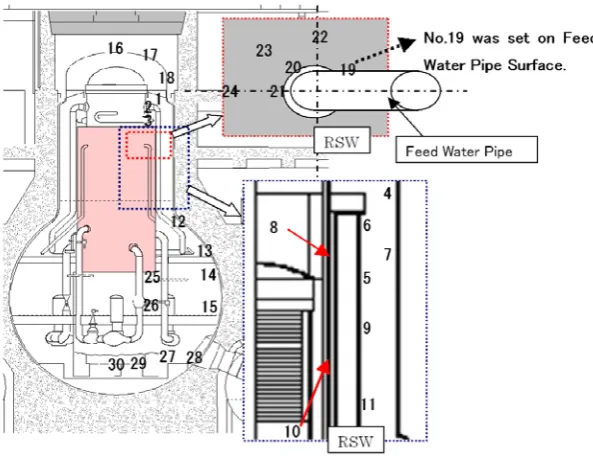
Locations of activation foil in the PCV are shown in Figure 3. We set foils at thirty locations where
characteristics of neutron transport phenomena in the PCV can be observed [4]. To observe neutron streaming caused by a Feed Water (FW) pipe, we set 6 sets of activation foils around the pipe as shown in the upper right corner in the figure.
Figure 3 Locations of activation foil in the PCV of the BSW
3 Activation calculations
3.1 Calculation conditions
We performed activation calculations on irradiation conditions of each foil location by using SCALE5.1/ORIGEN-S [1]. We input spectrum indexes, which are input data of ORIGEN-S code, given by three group neutron-fluxes at each location, which were obtained from two dimensional (2D) distribution calculation of neutron-flux in our previous work [4]. Distribution of spectrum indexes such as RES, Fast and
th are shown in Figure 4 (Here, th indicates distribution of thermal flux). We extracted values of the
spectrum indexes at each foil location from the distributions to input ORIGEN-S code. We also input irradiation histories as mentioned above.
Applying the library with the spectrum of to the activation calculations in the PCV would be appropriate.
However, applying the library to the calculation of foil locations around the FW pipe might be
inappropriate because effects of neutron-streaming around the FW pipe make distribution of neutron-flux
around it complex.
Figure 4 Distribution of ORIGEN spectrum indexes
3.2 Calculation results
In works to be related to estimations of radioactivity for decommissioning, reliability of calculated
radioactivity is verified with measured radioactivity. We judge calculation radioactivity distribution “Reliable”,
when comparison between calculated value and measured value (C/M) is less than one order magnitude
(1.0<C/M<10.0) [5].
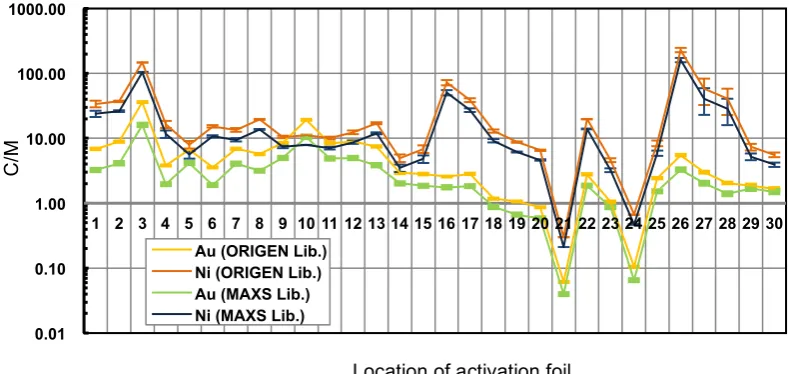
C/Ms of the calculations with ORIGEN library and with MAXS library at each foil
location are shown in Figure 5. C/Ms of Au foils and Ni foils, which were calculated both with ORIGEN
library and with MAXS library, are shown in the figure. When C/M nears 1.0, it means that calculated value
simulates measured value well. C/Ms with MAXS library are smaller than those with ORIGEN library by
almost half.
In C/Ms of Au foils, MAXS library is effective to improve the reliability of the activation
calculations in the PCV except locations around the PCV as seen in the figure. C/Ms of these locations were
less than 1.0. C/M, which is less than 1.0, indicates that calculation is underestimation. We suppose that the
underestimation would result from the complex phenomena around FW pipe as mentioned above. <ORIGEN-S Spectrum Index>
RES Fast Φth
10
10
1
0.1
0.01
Value of spectrum indexes in RES and
Fast Φth is distribution of thermal-flux
Figure 5 Comparisons between calculated and measured radioactiveities (C/M) with ORIGEN library and with
MAXS library at each foil location
In C/Ms of Ni foils, almost all C/Ms with ORIGEN library were larger than 10.0. These means
calculations were overestimation. Although applying MAXS library improved C/Ms, Applying it was not so
effective as those of Au foils. Activation reaction of Ni foil has threshold energy. ORIGEN-S code performs
activation calculation with not fast neutron-flux but with total neutron-flux. Since using total neutron-flux as
irradiation neutron would cause the overestimation, the effectiveness of the library could not made clear. C/Ms
at foil locations around the FW pipe shows similar tendency as Au foils.
4 Summary and conclusions
We performed activation calculations at the locations in the PCV of the BWR where radioactiveities
of both Au and Ni were measured as benchmark calculation for MAXS library. To examine an applicability
of the library, we compered calculated radioactivities with measured ones. For Au foils, the calculations
provided the applicability of applying MAXS library except around FW pipe where the complex phenomena
of neutron transport would occur. We suppose that the library would be effective to the other nuclides of which
activation reaction cross section spread through whole energy range that the activation calculations deal with.
On the other hand, the applicability of the library for Ni foils were not so clear because of the threshold
energy of activation reaction of Ni.
In this work, only one spectrum was used to generate the library. The underestimations shown
around FW pipe would be improved by applying libraries which were generated with appropriate spectra in the
PCV. Activation calculations of nuclides, which have threshold energy of activation reaction, activation
calculations might need not only libraries generated with appropriate spectra but also neutron-flux of
irradiation.
0.01 0.10 1.00 10.00 100.00 1000.00
1 2 3 4 5 6 7 8 9 10 11 12 13 14 15 16 17 18 19 20 21 22 23 24 25 26 27 28 29 30 Au (ORIGEN Lib.)
Ni (ORIGEN Lib.) Au (MAXS Lib.) Ni (MAXS Lib.)
C/
M
References
1. I.C.Gauld et.al, ORNL/TM2005/39 Version5.1 Vol.II, Book1, Sect.F7, (2006) 2. K. Okumura et.al, Proc. of SND 2014 150716 (2014)
3. K. Tanaka et al, PNE,85: 254-270 (2015)