DOI: 10.1534/genetics.104.040402
Likelihoods From Summary Statistics: Recent Divergence Between Species
Scotland C. Leman,* Yuguo Chen,*
,1Jason E. Stajich,
†Mohamed A. F. Noor
‡and
Marcy K. Uyenoyama
‡,2*Institute of Statistics and Decision Sciences,†Department of Molecular Genetics and Microbiology and‡Department of Biology, Duke University, Durham, North Carolina 27708
Manuscript received December 29, 2004 Accepted for publication August 5, 2005
ABSTRACT
We describe an importance-sampling method for approximating likelihoods of population parameters based on multiple summary statistics. In this first application, we address the demographic history of closely related members of theDrosophila pseudoobscuragroup. We base the maximum-likelihood estimation of the time since speciation and the effective population sizes of the extant and ancestral populations on the pattern of nucleotide variation atDPS2002, a noncoding region tightly linked to a paracentric inversion that strongly contributes to reproductive isolation. Consideration of summary statistics rather than entire nucleotide sequences permits a compact description of the genealogy of the sample. We use importance sampling first to propose a genealogical and mutational history consistent with the observed array of summary statistics and then to correct the likelihood with the exact probability of the history determined from a system of recursions. Analysis of a subset of the data, for which recursive computation of the exact likelihood was feasible, indicated close agreement between the approximate and exact likelihoods. Our results for the complete data set also compare well with those obtained through Metropolis-Hastings sampling of fully resolved genealogies of entire nucleotide sequences.
E
STIMATION of population parameters in classical population genetics has traditionally proceeded through a moments approach, based on closed-form expressions for the expectation and variance of sum-mary statistics (reviewed by Hey and Machado 2003;Beaumont 2004). For the purposes of this discussion,
we regard as a summary statistic any measure of genetic variation that can be determined directly from numbers of derived mutations observed in a sample without ex-plicit reference to the genealogy of the sampled genes.
Felsenstein(1992) proposed a maximum-likelihood
(ML) approach to the estimation of population param-eters, treating the intervals separating the nodes of the sample genealogy as missing data. He showed that ML methods that use knowledge of the node intervals scaled to the mutation rate have greater statistical power than classical moments-based methods that use summary statistics. Metropolis-Hastings (MH) sampling to simu-late the posterior distribution of the gene genealogy based on entire nucleotide sequences now forms the basis of the dominant ML and Bayesian approaches to both population parameter estimation and phylogeny reconstruction (Kuhneret al.1995; Huelsenbeckand
Ronquist2001).
Among the appealing properties of estimation pro-cedures based on summary statistics are greater simplic-ity and potential for customization to specific biological systems. While computation of summary statistics by definition requires no knowledge of the genealogy of the sample, the intimate relationship between the pat-tern of segregating variation and the sample genealogy lies at the core of coalescence theory and molecular population genetics (Ewens 1972; Watterson1975).
In deriving not only the first two moments but also entire probability distributions of summary statistics, those works laid the basis for parameter estimation through likelihoods as well as for the parametric tests for which they are well known. Our objective here is to develop a likelihood-based method for inferring demographic history from multiple summary statistics.
Classes of segregating mutations:Wakeleyand Hey
(1997) introduced a set of summary statistics suitable for exploring the demographic history of two groups: num-bers of sites polymorphic in both groups, polymorphic in only one group, or showing fixed differences. Our classification expands theirs by using an outgroup to distinguish between ancestral and derived bases (see
materials and methods). With respect to the genes
sampled from a given group, we describe each segregat-ing derived mutation as absent (a), segregating (s; pres-ent in at least one but not all), or fixed (f; present in all). A joint classification with respect to two groups com-prises only seven types because segregating mutations are neither absent nor fixed in both groups.
1Present address: Department of Statistics, University of Illinois, Champaign, IL 61820.
2Corresponding author:Department of Biology, Duke University, Box 90338, Durham, NC 27708-0338. E-mail: [email protected]
Distinguishing between the effects of recent diver-gence and introgression after diverdiver-gence on the sharing of polymorphisms between closely related species can be difficult, particularly in single-locus analyses (Wang
et al.1997). To address the time since divergence alone, we chose to study variation at DPS2002, a noncoding region for which tight linkage to a paracentric inversion strongly associated with multiple reproductive isolating mechanisms precludes its introgression between the closely related Drosophila speciesDrosophila pseudoobs-curaandD. persimilis(Noorand Smith2000; Nooret al.
2001a,b) (seematerials and methods).
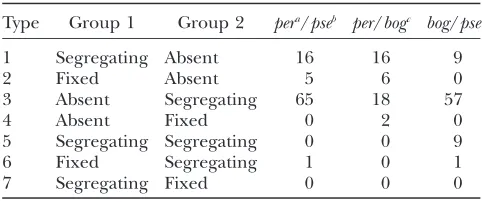
Table 1 shows the array of mutations observed in DPS2002haplotypes sampled fromD. persimilisand two subspecies of D. pseudoobscura,D. p. pseudoobscura and D. p. bogotana(Machadoet al.2002). Consistent with the
absence of introgression at DPS2002, the D. persimilis sample shares no mutations with theD. p. bogotana sam-ple and only one (f/s) with the D. p. pseudoobscura sample. In contrast, the two subspecies ofD. pseudoobs-curashare 10 mutations, suggesting recent divergence or ongoing gene flow. In the interspecific comparison involving D. p. bogotana (per/bog), the observation of both reciprocal arrangements of fixed differences (f/a and a/f) indicates that the most recent common ancestor (MRCA) of genes sampled from each species postdates any between-species coalescence events: the DPS2002gene genealogy shows reciprocal monophyly. While the reciprocal numbers of DPS2002 polymor-phisms restricted to one species (s/a anda/s) appear similar between D. p. bogotana and D. persimilis, D. p. pseudoobscurashows fourfold more polymorphisms than D. persimilis, perhaps reflecting larger effective popula-tion size. These observapopula-tions suggest that the numbers of the various kinds of mutations segregating in the sample contain information about genealogical and de-mographic history.
Models of speciation:Under the Dobzhansky-Muller scenario for the origin of species (reviewed by Turelli
et al.2001), genetic factors contributing to reproduc-tive isolation arise during an initial phase of allopatry
between the incipient species. We identify species diver-gence with the onset of the allopatric phase and not in particular with the origin of genetic isolating mecha-nisms. Speciation corresponds to a change in coalescence structure, the most recent point at which ancestral lineages with descendants in different species can have coalesced.
We assume that the paracentric inversion that pre-cludes introgression atDPS2002 betweenD. pseudoobs-cura and D. persimilisarose as a neutral mutation and became associated with isolating barriers during the allopatric phase. That this second chromosome region is homosequential inD. pseudoobscuraand outgroupD. miranda(Dobzhanskyand Tan1936) indicates that it
is the D. persimilis arrangement that is derived. This inversion appears to correspond to a fixed difference, not only in our sample but also between the species (Dobzhansky and Powell 1975). For simplicity, we
assume instantaneous fixation of the alternative gene orders in the two descendant species, with the inversion having arisen immediately before the MRCA of the sampled inverted chromosomes.
Likelihoods from summary statistics: Marjoram
et al.(2003) introduced a Markov chain Monte Carlo (MCMC) method that directly approximates the poste-rior distribution of the model, obviating the need to determine the probability of the data. Numerically gen-erating genealogical and mutational histories that match the data may require extensive simulation.
We address methods that base inferences about demographic history and population parameters (M) on a set of summary statistics (D). Implementation of likelihood-based approaches entails the development of a practical means of determining or approximating probability distributions that depend on the unknown genealogical history (G) of the sampled genes and the number and location (U) of mutations that occurred on it,
LðMÞ ¼PMðDÞ ¼X
G
X
U2VG
PMðD;U;GÞ; ð1Þ
forVG, the set of all possible placements of mutations on a givenG. We adopt the infinite-sites model, under which neutral base substitutions occur independently, with the number in a given time interval following a Poisson distribution. Many likelihood-based methods proceed from the prior distribution of the genealogy, dependent on the population parameters alone, while others, including fully Bayesian approaches (Wilson
and Balding1998), incorporate the posterior
distribu-tion of histories given D (reviewed by Stephens and
Donnelly2000).
With respect to time since divergence of populations, exact analytical expressions are available for certain sim-ple demographic histories (Watterson1985; Takahata
et al.1995); however, the derivation of closed-form so-lutions is intractable for most systems of biological
TABLE 1
Segregating mutations
Type Group 1 Group 2 pera/pseb per/bogc bog/pse
1 Segregating Absent 16 16 9
2 Fixed Absent 5 6 0
3 Absent Segregating 65 18 57
4 Absent Fixed 0 2 0
5 Segregating Segregating 0 0 9
6 Fixed Segregating 1 0 1
7 Segregating Fixed 0 0 0
a
D. persimilis, 13 sequences. bD. p. pseudoobscura, 19 sequences. cD. p. bogotana, 13 sequences.
interest. Uyenoyama and Takebayashi (2004)
de-scribed a method for the recursive determination of exact likelihoods from joint probability-generating functions of correlated summary statistics (compare Griffithsand Tavare´1996). Takebayashiet al.(2004)
used this approach to obtain a maximum-likelihood estimate (MLE) of the rate of recombination between a determinant of mating type in a flowering plant and a closely linked marker locus from the numbers of seg-regating sites at the two loci. While this method can in principle accommodate multiple summary statistics and general evolutionary models, the computation time makes its application impractical.
Likelihoods have been approximated by simulating complete genealogical and mutational histories under a coalescent model and computing summary statistics for each realization (for example, Fu and Li 1997; Weiss
andvonHaeseler1998; Pritchardet al.1999). While
full simulation can accommodate a wide range of evo-lutionary questions, analysis of even small data sets under simple models may impose a considerable com-putational burden (Wall et al. 2002; Wall 2003),
reflecting the exceedingly low probability of any par-ticular realization (Stephens and Donnelly 2000;
Marjoramet al.2003).
Tavare´ et al. (1997) introduced an
acceptance-rejection algorithm for the estimation of the age of the MRCA of a sample of genes that entails simulating a gene genealogy and accepting the value for this random variable on the basis of the probability for the tree of the observed total number of segregating mutations. Beaumontet al.(2002) used a local regression method
to approximate the likelihood of the actual data from realizations within a certain tolerance (Estoup et al.
2004; Tallmonet al.2004; Hamiltonet al.2005).
Alternatively, the ‘‘fixed-S’’ approach (e.g., Hudson
1993; Depaulisand Veuille1998) entails generating
a genealogy under a standard coalescent model, ran-domly placing the observed total number of segregating sites (S) on the genealogy, and determining the fraction of outcomes consistent with the remaining observed summary statistics (H, forD¼ fS,Hg). Markovtsova
et al.(2001) showed that the distribution generated by this procedure does not in fact approximatePM(HjS), the conditional distribution ofHgivenS. In particular, the genealogy should be sampled, not from a prior distribution determined by the standard coalescent, but from a conditional distribution, givenSand the model parametersM. This discrepancy can become problem-atic under large departures of the observed value ofS from its expectation (Depauliset al.2001; Markovtsova
et al.2001; Walland Hudson2001).
Approach through importance sampling:We develop an importance-sampling (IS) approximation (see Liu
2001) to the likelihood (1). We use a proposal distribu-tion to sample a genealogical and mutadistribu-tional history consistent with the observed array of seven types of
seg-regating sites and then correct the bias by determining the exact probability of the history.
Here, a genealogical path (G) corresponds to an ordered list of the states assumed by the process at the nodes of the full genealogy, without specification of the mutations. Observation of the segregating sites present in a sample (D) provides multiple kinds of information,
D¼ fD1;D2g;
for D1the types andD2the numbers of base
substitu-tions observed. We rewrite (1) as LðMÞ ¼PMðDÞ
¼X
G
X
U2VG
PMðD;U;GÞ
QMðD;U;GÞQMðD2;UjD1;GÞQMðD1;GÞ; ð2Þ
forQM(D1,G), the stationary distribution of genealogies
compatible with D1, and QM(D2, UjD1, G), a heuristic
distribution of placements of mutations onG compat-ible withD2. We approximate this average (2) by
PMðDÞ 1
m
Xm
i¼1
PMðD;Ui;GiÞ
QMðD;Ui;GiÞ
; ð3Þ
for (Ui, Gi) independent and identically distributed (i.i.d.) samples from the proposal densityQM(D2,UjD1,
G)QM(D1,G).
Likelihoods approximated through this procedure may serve as the basis of either Bayesian or maximum-likelihood analyses. Here, we use IS to determine MLEs of the time since divergence between closely related species of Drosophila and the effective population sizes of the extant and ancestral species.
MATERIALS AND METHODS
Sequence information:We studied the pattern of
nucleo-tide variation segregating among DPS2002 sequences ob-tained by Machadoet al. (2002) from theD. pseudoobscura species group, including 19 D. p. pseudoobscura, 13 D. p. bogotana, and 13 D. persimilis sequences (GenBank nos. AF450689–AF450734). This region,940 bp in length, shows numerous single-nucleotide polymorphisms and variable oligonucleotide repetitive motif tracts, but no detectable open-reading frames. For each site segregating within the ingroup, we assumed that the base present in the singleD. mirandasequence represented the ancestral base.
Although Machadoet al.(2002) localizedDPS2002within a fixed paracentric inversion that distinguishesD. persimilisfrom
In the present study, we assume complete linkage of sites withinDPS2002and ofDPS2002to the inversion. Association of the inversion with multiple reproductive isolating mecha-nisms, including hybrid male sterility, hybrid inviability, hybrid male courtship dysfunction, and behavioral isolation, prevents introgression of linked regions, including DPS2002 (Noor and Smith2000; Nooret al.2001a,b).
Classification of mutations:Our assumption of the absence of intragenic recombination entails that all sites within a locus share a single genealogical history. This common history con-strains the observed array of neutral, independent mutations,
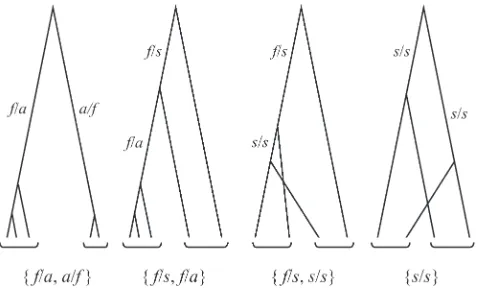
n¼ ðn1;n2;. . .;n7Þ;fornithe number of mutations of typei (Table 2). For example, the observation of a mutation fixed in group 1 and absent from group 2 implies a topology in which the MRCA of the haplotypes sampled from group 1 postdates all between-group coalescence events. This topology excludes the presence in group 2 of mutations segregating in group 1 (s/s and s/f). With the exception of types 1 and 3, the presence of each mutational type excludes the presence of two other types, implying observation of a maximum of four dis-tinct types of mutations. Figure 1 illustrates the four possible distinguishable topologies (modulo reciprocals) assumed by the sample genealogy:ff/a,a/fg,ff/s,f/ag,ff/s,s/sg, and
fs/sg.
Summary statistics:We used CLUSTAL-W (Thompsonet al.
1994), with minor manual modifications, to generate a multiple alignment of the 46DPS2002sequences. After elim-ination of sites with gaps in any of the sequences, 892 ho-mologous sites remained. For each of three triads (outgroup
D. mirandaand a pair of ingroup taxa), we restricted attention to sites at which more than one base segregated within the
ingroup taxa under consideration. In accordance with an infinite-sites model of mutation, we designated the base in the outgroup sequence as ancestral and any other base as a muta-tion. After removing sites at which the ancestral base was absent from both ingroup taxa, we counted the number of mutations in each category shown in Table 1. For sites at which more than two bases segregated, both derived bases contrib-uted to our mutation counts: for example, at a site at which C was designated ancestral, C and G segregated in the sample from one ingroup taxon, and C and T in the other, we counted each mutation (G and T) as segregating in one group and absent in the other. A Bioperl (Stajichet al.2002) script for counting the various types of mutations is available from its author on request ( J.E.S.: [email protected]).
METHODS OF ESTIMATION
We present an evolutionary model for the demographic history of a sample of haplotypes from two species. We then construct a recursion in the exact probability of the observed array of the seven kinds of segregating sites under this model and describe its importance-sampling approximation (3).
Evolutionary model: We assume that the time since divergence of species 1 and 2 from ancestral species 0 follows an exponential distribution with parameter l, treating las the rate of species fusion. During the in-terval spanned by the gene genealogy, speciesi(i¼0, 1, 2) maintains a constant effective size of Ni genes (for autosomal regions, twice the effective number of individuals).
At any point within the gene genealogy of a sample, we classify each lineage according to its species member-ship and the distribution of its descendants between the two groups of the initial sample. A type 1 lineage has descendants among the genes sampled from species 1 but not from species 2, and type 2 has those from species 2 but not from species 1. Type 3 lineages have descend-ants in both groups. On level lof the gene genealogy (the interval in which a total oflancestral lineages remain), the state or configuration of the process corresponds to (l01,l02,l03,l11,l22), forlij, the number of ancestral lineages
of typej(j¼1, 2, 3) in speciesi(i¼0, 1, 2).
Speciation corresponds to a change in population structure: transition from two isolated groups to a single panmictic group. Our assumption of the instantaneous fixation of the alternative chromosomal types upon spe-ciation entails that postspespe-ciation coalescence events occur at rate
lii 2 =Ni (i¼1, 2), in which
lii
2 ¼0 forlii,2:
Our speciation scenario stipulates the origin of the in-version immediately before the MRCA of theD. persimilis
Figure 1.—Possible topologies of gene genealogies of a
nonrecombining region. Brackets below the trees indicate se-quences sampled from the same group. Branch labels indi-cate branch type (Table 2).
TABLE 2
Incompatibilities
Type Group 1/group 2 Incompatible Compatible
1 s/a None All
2 f/a s/s,s/f a/forf/s
3 a/s None All
4 a/f s/s,f/s f/aors/f
5 s/s f/a,a/f f/sors/f
6 f/s a/f,s/f f/aors/s
7 s/f f/a,f/s a/fors/s
subsample. For cases in which its origin predated the speciation event, we assume that it segregated in the an-cestral species at frequencyp. During the interval between the speciation event and the MRCA of the inverted chro-mosomes, coalescence among type 1 lineages occurs at rate
l01 2
=pN0
and among type 2 lineages at rate l02
2
=ð1pÞN0;
with no between-type coalescence events. Upon the or-igin of the inversion, all pairs of lineages coalesce at the same rate (1/N0), irrespective of type.
A genealogical path G corresponds to an ordered list of descriptions of the nodes of the full geneal-ogy, without specification of mutations or within-level transitions,
G¼ ðSL;SL1;. . .;S2;S1Þ; ð4Þ forSl;the entry (most recent) state on levell, andLtotal sample size. For a sample comprising L1 haplotypes
from species 1 andL2from species 2 (L¼L11L2), the
initial stateSLcorresponds to (0, 0, 0,L1,L2) and the
MRCA of the entire sample S1 to (0, 0, 1, 0, 0). Characterization of the stationary distribution of gene-alogical paths requires only determination of Markov matrices of within- and between-level transition rates (appendix a). We extend the procedure introduced
by Wiufand Donnelly(1999) to condition the gene
genealogies proposed in the IS procedure to have a topology compatible with the observed combination of mutational types (appendix b). Restricting sampling to
compatible genealogies affords a considerable increase in efficiency for a modest computational cost.
Exact recursion in likelihoods:We derive a recursion in the joint probability-generating function (PGF) for the array of summary statistics.
Array of mutations in the sample: For each configura-tion on level l, we determine a PGF for the array of mutations accumulated in the subtree extending from levellto the MRCA. LetglðaÞdenote the vector of these PGFs, fora¼ ða1;a2,a3,a4,a5,a6,a7) comprising PGF
parameters corresponding to the seven types of segre-gating mutations (Table 1). Figure 2 illustrates that the total number of mutations accumulated within the subtree beginning on levellcorresponds to the sum of numbers accumulated on level l and in the subtree beginning on levell1:
glðaÞ ¼RlðaÞgl1ðaÞ: ð5Þ
appendix apresents the derivation ofRlðaÞ;the PGF of
mutations accumulated within levell. Recursion (5) has initial condition
g1ðaÞ[1;
reflecting that mutations in the MRCA do not segregate in the sample. The PGF of the numbers of the seven types of mutations observed in a sample of sizeL corre-sponds to
gLðaÞ ¼Y
L
l¼2
RlðaÞ;
in which the matrix product begins on the left with the largest index value.
Recursive computation of exact likelihoods:We determine likelihoods from a recursion in probabilities rather than in the PGFs themselves. Taking derivatives of (5), we obtain an expression for the probability of observing the array p¼ ðp1; p2,. . .,p7) of mutations in the subtree
extending from levellto the MRCA,
gQðpÞl ð0Þ pi! ¼
X
q
RQðqÞl ð0Þ qi!
gðpqÞl1 ð0Þ
Q
ðpiqiÞ!; ð6Þ
in which q denotes the array of mutations that arose within level landpq the remaining mutations; the summation inqruns over all possible subsets of the total array p; and superscripts of the form (p) indicate the order of derivatives with respect to the parameters representing the mutational types (the pith derivative with respect toai,i¼1, 2, . . ., 7).
We initialize the recursion in probabilities (6) by considering all possible assignments of mutations to level 2,
gðqÞ2 ð0Þ=Yqi!¼R ðqÞ 2 ð0Þ=
Y
qi!;
for q, a subset of the observed mutations n. We then determine gð3pÞð0Þ=
Q
pi! for all possible mutational arrayspthat can occur in the subtree comprising levels 2 and 3. This recursion ends with gðLnÞð0Þ=
Q
ni!; the probability of the array of mutations observed in the initial sample.
Figure2.—Recursion in probability-generating functions.
Mutations in the subtree extending from the MRCA to level
Importance-sampling approximation: To approxi-mate (2), we first sample from an analytical stationary distribution a genealogical pathG (4) consistent with the types of mutations observed in the sample (D1) as
well as the speciation scenario, place the observed num-bers of mutations n alongG according to a heuristic distribution, and then correct the bias introduced by the proposal, using the exact probability of the genealogical and mutational history.
Genealogical path: Given entry stateSlon level l, the stationary distribution of the levell1 entry stateSl1is
given by the corresponding row of
˜
Vl1U˜lV˜l1U˜2lV˜l1 ¼ ½IU˜l1V˜l; ð7Þ forU˜landV˜lmatrices of rates of within- and
between-level transition probabilities (appendix a), conditional
on the observed types of mutations (D1;appendix b).
Beginning with the state of the initial sample (0, 0, 0,L1,
L2), we construct a genealogical pathGiby sampling, for each successive level until termination in the MRCA, a path segment from the row of (7) that corresponds to the entry state for the level.
Proposal distribution:Given a genealogical pathGi, we propose placements of the observed mutations accord-ing to a multinomial distribution,
QMðD2;UjD1;GiÞ ¼
Y7
j¼1 nj!Y
L
l¼2
ðrl;jÞnj;l nj;l!
;
in whichnj,lrepresents the number of typejmutations on level l (Pnj;l ¼nj) and rl,j the probability that a lineage on levellreceives a typejmutation. Forel,jthe number of lineages on levellthat are eligible to receive mutations of typej,
rl;j¼
el;jwl
PL k¼2ek;jwk
; ð8Þ
in whichwlrepresents the relative weight assigned to levell. Weightwlreflects the expected duration of level l, which has an exponential distribution with parameter corresponding to the rate of coalescence within the level (appendix c).
For the path segment corresponding to level l, we obtain the true probability PM(D, Ui,l, Gi,l) from the
element ofRðlqÞð0Þ=Qqj!(A8) in the row and column associated with the entry (most recent) states on levels landl 1, respectively, forq, the array of mutations assigned to levell.
Likelihood function: Griffiths and Tavare´ (1994)
described an importance-sampling procedure for gen-erating likelihoods of arbitrary models (M) from those obtained under a particular driving model (M0). This
approach entails first intensively sampling genealogical paths and placements of mutations underM0and then
characterizing the entire likelihood function by rescal-ing the probabilities (see Griffithsand Tavare´1994;
Kuhneret al.1995; Felsensteinet al.1999; Stephens
and Donnelly 2000). For (Ui,Gi) i.i.d. samples from
QM0ðD2;UijD1;GiÞQM0ðD1;GiÞ;we approximate the like-lihood by
LðMÞ ¼PMðDÞ ¼ X
G X
U2VG
PMðD;U;GÞ QM0ðD;U;GÞ
QM0ðD2;UjD1;GÞQM0ðD1;GÞ
ffi1 m
Xm
i¼1
PMðD;Ui;GiÞ QM0ðD;Ui;GiÞ
:
Because the choice of M0 affects the reliability of the
approximation (Kuhner et al. 1995, 1998; Stephens
and Donnelly2000), we first estimate the MLE through
a two-tier search (appendix d) and then sample
inten-sively under this driving model.
APPLICATION
We began our exploration with a comparison between D. p. bogotana and D. persimilis. For this smaller data set (Table 1,per/bog), determination of both the exact likelihoods by recursive computation (6) and their importance-sampling approximations was in fact feasi-ble. Having established a basis for confidence in our IS implementation, we then addressed the estimation of population parameters from the comparison between D. p. pseudoobscuraandD. persimilis(Table 1,per/pse).
That the inversion difference appears to be fixed be-tween the species as well as in our sample (Dobzhansky
and Powell1975) suggests the absence or segregation
in very low frequency (p) of the derived gene order in the ancestral species. In accordance with this expecta-tion, preliminary results (not shown) indicated higher likelihoods of lower values ofp. As the data set contains little information about this aspect, we arbitrarily as-signedpas 0.0001 in estimating the remaining parameters.
Comparison of D. p. bogotana and D. persimilis: We used our two-phase search procedure (appendix d) to
locate the maximum-likelihood values of the four pa-rameters of the system (l/u, uN0, uN1, uN2). Our IS
approximations compare well to the exact likelihood computed using (6).
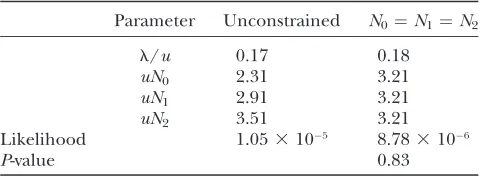
Maximum-likelihood estimates: Table 3 provides the MLE array (‘‘Unconstrained’’ column), with probabili-ties estimated using (3), based on a sample of 43 106
TABLE 3
D. p. bogotana/D. persimilisdivergence
Parameter Unconstrained N0¼N1¼N2
l/u 0.17 0.18
uN0 2.31 3.21
uN1 2.91 3.21
uN2 3.51 3.21
Likelihood 1.053105 8.783106
P-value 0.83
genealogical paths. A likelihood-ratio test detected no significant differences in effective population size among the species (comparison to ‘‘N0-N1-N2’’).
Comparison of exact and IS likelihood curves: To assess the accuracy of our IS approximation, we constructed conditional-likelihood curves for the speciation rate (l/u) with the remaining parameters assigned to their MLE values (Table 3) under both the exact recursion (6) and our IS method. Figure 3 presents the exact-likelihood function and 18 IS curves, each based on 500,000 sampled genealogies generated using the MLEs as the driving values. The average of the IS curves (blue line), based on a total of 93106samples, corresponds
well to the exact conditional likelihood (red line), al-though it somewhat underestimates the absolute value of the likelihood.
Computation using (6) of a single point of the exact-likelihood function required 4 hr on a Macintosh PowerPC G5 (2.5-GHz processor, 3.5 GB DDR SDRAM). Construction of the 200 points constituting the entire conditional-likelihood curve in Figure 3 required800 hr using the exact recursion, compared to30 min using our IS method based on 500,000 sampled genealogical histories. While computation time under the exact re-cursion increases roughly with the product of the num-bers of mutations observed (elements ofn), observation of more mutations has virtually undetectable effect on computation time under IS.
Figure 4 compares the exact log-likelihood function for the speciation rate (l/u) computed under (6) to the
IS approximation. Our IS curve provides an excellent indication of both the MLE and the breadth of the like-lihood function. As noted by Stephensand Donnelly
(2000), error of the IS approximation generally in-creases farther from the driving value. In the case stud-ied here, however, detectable discrepancies arise only in regions quite distant from the MLE, well beyond the
95% confidence range spanned by 2 log-likelihood units.
Comparison ofD. p. pseudoobscuraandD. persimilis:
The interspecific comparison involvingD. p. pseudoobs-cura(Table 1) comprises more sequences (longer gene-alogies) and many more mutations (87 compared to 42). Both factors, but especially the increase in mutation number, render computation of the exact-likelihood function impractical.
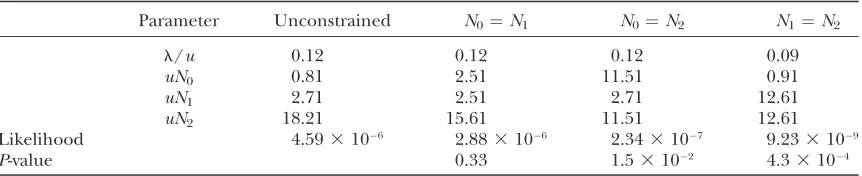
Maximum-likelihood estimates:Table 4 provides maximum-likelihood estimates of the population parameters, de-termined by our IS method using 4 3 106 sampled
genealogies. Likelihood-ratio tests suggest that the ef-fective size of D. p. pseudoobscura (uN2) significantly
ex-ceeds those of both D. persimilis(uN1) and the ancestor
(uN0).
Profile-likelihood curves: Various approaches exist for conveying a sense of the level of confidence in the es-timate of a parameter in a multiple-parameter model (e.g., Bergeret al.1999). Within the maximum-likelihood
framework adopted here, we have chosen to present our results in terms of the profile likelihood, under which the likelihood of a given value of a parameter corre-sponds to the maximum achieved over all assignments of the other parameters.appendix edescribes our
pro-cedure for approximating the full four-dimensional likelihood surface using interpolating splines.
Figure 3.—Exact and IS-approximated
conditional-likelihood function of the instantaneous rate of speciation (l/u), withuN0,uN1, anduN2assigned to their MLE values. Using the unconstrained MLEs (Table 3) as the driving val-ues, we generated 18 IS curves, each based on 500,000 sam-pled genealogies. Red indicates the exact likelihood surface ofl/u, computed using (6) under the same assignments of the other parameters, and blue shows the average of the IS curves (93106total samples).
Figure4.—Exact and IS-approximated log-likelihood
Figure 5 shows the profile-likelihood curve for the relative rate of speciation (l/u), and Figure 6 shows the relative effective size of D. persimilis (uN1). Table 5
provides 90% confidence intervals for our MLEs, de-termined under the assumption of ax2-distribution for
the log-likelihood.
DISCUSSION
We have described a likelihood-based method for the estimation of population parameters. This first applica-tion addresses the time since divergence of closely related species in the D. pseudoobscura group. More importantly, it serves as a proof-of-concept demonstra-tion of the speed and reliability of our approach, based on summary statistics rather than on entire nucleotide sequences.
Divergence betweenD. pseudoobscuraandD. persimi-lis: Our maximum-likelihood analysis indicates a signifi-cantly larger effective population size forD. pseudoobscura than for D. persimilis (Table 4) and a speciation event somewhat more ancient than some previous estimates.
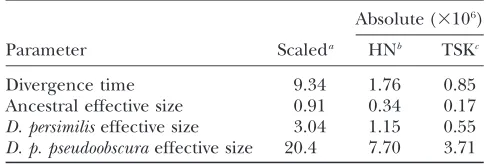
Table 6 presents our estimates (Table 5) scaled to the rate of mutation per kilobase (u˜¼u1000=892;for our
892-bp region). Numbers for effective population size correspond touN˜ i(i¼0, 1, 2) and those for divergence time to u˜=l; the expectation of the exponentially dis-tributed speciation-time variable.
Calibration of mutation rate:Rescaling of our estimates into units of numbers of years or individuals requires determination of the rate of substitution of neutral mutations in noncoding regions. For the same Dro-sophila species studied here, Heyand Nielsen(2004)
(HN) estimated 5.33106mutations per kilobase per
year. This number, an average across 14 regions for which their analysis indicated substantial heterogeneity, reflects divergence in both coding and noncoding regions and both synonymous and nonsynonymous substitutions.
For mammals (humans and rodents), Bustamante
et al. (2002) estimated a 70% reduction in the rate of substitution at silent sites in expressed genes compared to their homologous pseudogenes. This accelerated sub-stitution in pseudogenes, particularly marked in genes with high GC content, reflects in part the release from selective constraints on hypermutable CpG dinucleotides (Sved and Bird1990). In primates, Subramanianand
Kumar(2003) found a significant overallexcessin neutral TABLE 4
D. p. pseudoobscura/D. persimilisdivergence
Parameter Unconstrained N0¼N1 N0¼N2 N1¼N2
l/u 0.12 0.12 0.12 0.09
uN0 0.81 2.51 11.51 0.91
uN1 2.71 2.51 2.71 12.61
uN2 18.21 15.61 11.51 12.61
Likelihood 4.593106 2.883106 2.343107 9.233109
P-value 0.33 1.53102 4.33104
Figure 5.—Profile-likelihood function for the scaled
in-stantaneous rate of speciation (l/u).
Figure6.—Profile-likelihood function for the scaled
substitution in exons compared to noncoding regions (pseudogenes, introns, and intergenic tracts), which dis-appeared upon exclusion of CpG sites.
While Drosophila genomes do not show significant CpG deficiency (Gentlesand Karlin 2001), selective
constraints on codon usage do influence the pattern of substitution at synonymous sites (Akashi1995). Using
the skew in base composition as an index of codon usage bias, Tamura et al. (2004) (TSK) inferred a neutral
substitution rate of 1.13 105mutations per kilobase
per year for recently diverged (5.1 million years) Dro-sophila species.
Effective population size:We identify Wright’s ‘‘inbreed-ing effective number’’ of individuals (Crow and
Denniston 1988) with half the inverse of the rate of
coalescence (half the expected number of generations to coalescence between a random pair of genes; see Slatkin1991). Our estimates of scaled population size
(uNi), a ratio of rates, have units of mutations per coalescence. Division of these estimates by twice the rate of mutation per generation converts the scale to generations per coalescence, which we identify with effective numbers of individuals. Table 6 reports ‘‘abso-lute’’ effective population sizes (millions of individuals), obtained under the assumption of four generations per year (Schaeffer1995) and HN and TSK mutation rates.
Under the TSK rate, our analysis suggests an effective population size forD. p. pseudoobscuraof 3.73106, with
1.4 3 106 the lower bound of the 90% confidence
interval, comparable to Schaeffer’s (1995) estimates
(1.93106, 4.53106), based on theAdhregion. Heyand
Nielsen’s (2004) estimate obtained from DPS2002
alone corresponds to 7.3 3 106 and 3.5 3 106 under
the HN and TSK rates, respectively. Credible intervals, presumably obtainable from their method, were not reported.
For the effective population size of D. persimilis, we obtained an MLE of 0.553 106, with 90% confidence
interval (0.25, 1.17). Heyand Nielsen’s (2004) value
based on DPS2002alone (‘‘u2 3uS’’ in their Table 1)
corresponds to 0.813106and 0.393106under the HN
and TSK rates, respectively (credible intervals not provided).
Divergence time: Under the TSK mutation rate, our MLE of the time since speciation betweenD. pseudoobs-cura and D. persimilis corresponds to 850 thousand years (KY), identical to the number obtained by Tamuraet al.(2004) from their moments-based analysis
of nuclear protein-coding genes located throughout the genome. Our estimate shows an insignificant excess over that of Aquadroet al.(1991) (500 KY), based on
restriction site differences at theAmyregion calibrated by DNA-DNA hybridization data.
Heyand Nielsen(2004) based their ML analysis on
MCMC reconstruction of the gene genealogy of entire nucleotide sequences from 14 genomic regions. It per-mits variation among regions in rates of substitution and introgression, but does not accommodate the popula-tion substructuring induced by linkage of DPS2002to theD. persimilisinversion, which prevents its introgres-sion. Their estimates of divergence time scaled to sub-stitution rate (t3uS, analogous to ouru˜=l) vary over a
13-fold range across the 14 regions, and those of abso-lute divergence time vary 238-fold. Their overall esti-mate of absolute divergence time (589 KY) corresponds to the average scaled divergence time divided by the average substitution rate.
Heyand Nielsen’s (2004) estimate of divergence time
based on DPS2002 alone exceeds the average across the 14 regions by.86%. This number corresponds to 1113 KY under the average substitution (HN) rate and to 536 KY under the TSK rate. Expressed on the same scale, our MLEs (l/u¼0.12,uN0¼0.81,uN1¼2.71,
uN2 ¼ 18.21) show nonsignificant differences from
theirs forDPS2002alone (0.19, 0.9, 1.9, 17.2), in which we associate their number for divergence time with the inverse of the parameter of the exponentially distrib-uted speciation-time variable.
Approaches to estimation:Basing the estimation on summary statistics rather than on entire nucleotide sequences permits considerable simplification of the description of genealogical history. Streamlining of the evidentiary and computational basis affords greater com-putational and analytical freedom to address more re-alistic demographic scenarios and biological processes.
TABLE 5
MLEs and confidence intervals forD. p. pseudoobscura/ D. persimilisdivergence
Parameter MLEa 90% confidence intervalsb
l/u 0.12 (0.02, 0.46)
uN0 0.81 (0.1, 5.0)
uN1 2.71 (1.25, 5.75)
uN2 18.21 (8, —)c
a
Based on 43106sampled genealogies.
b
From profile likelihood. c
Beyond bounds of approximated surface.
TABLE 6
Maximum-likelihood estimates
Absolute (3106)
Parameter Scaleda HNb TSKc
Divergence time 9.34 1.76 0.85 Ancestral effective size 0.91 0.34 0.17
D. persimiliseffective size 3.04 1.15 0.55
D. p. pseudoobscuraeffective size 20.4 7.70 3.71
a
Mutations per kilobase. b
5.33106mutations/kb/year.
c
Genealogies as nuisance parameters:Our primary inter-ests lie in the characterization of the evolutionary process of speciation and genetic divergence. In this context, the genealogy of the sampled genes represents a nuisance parameter, an unknown aspect that influen-ces the estimation of population parameters but that holds little interest in itself. More precisely, the gene genealogy is not a parameter but another manifestation of the evolutionary process under study (Donnellyand
Tavare´1995; Stephens2001).
To accommodate some of the diversity of evolutionary processes, a number of methods entail estimation of a great many parameters. For example, full genealogical reconstruction in structured populations requires esti-mation of the ages of all nodes, mutations, migration events, changes in population size, and population divergences (Beerli and Felsenstein 2001; Nielsen
and Wakeley 2001; Wilson et al. 2003; Hey and
Nielsen 2004). A given biological system may
corre-spond to a set of parameter assignments within the full model (for example, Yang 1996; Hey and Nielsen
2004). However, a model that accommodates the unique origin of the second chromosome inversion that pre-vents introgression at theDPS2002region is not nested within available data analysis packages.
Griffithsand Tavare´(1996) showed that the variance
of estimates of population parameters obtained from full genealogical reconstruction of entire nucleotide sequences tends to be smaller than that based on sum-mary statistics. Even so, one may well prefer simpler methods based on summary statistics in cases for which they are nearly sufficient for the estimation of the popu-lation parameters of interest (Marjoram et al. 2003).
The development and implementation of analyses capable of accommodating additional evolutionary pro-cesses can demand literally years of effort (Felsenstein
et al. 1999), and even entire sequences may contain insufficient information to support the estimation of fully resolved gene genealogies as well as all parameters of a heavily parameterized model (Wiuf 2003). A
re-lated observation is that less detailed models can some-times generate more accurate estimates (Takahashi
and Nei 2000; Piontkivska 2004; Kosakovsky Pond
and Frost2005).
Reflecting our interest in population parameters rather than gene genealogies themselves, our method adopts a much-condensed genealogical description. A genealogical path in our analysis corresponds to an ordered list of lineage types associated with the nodes of the gene genealogy (4). It differs, in particular, from the genealogical history of Griffithsand Tavare´ (1994),
for which the state space includes the mutations. Reduction of the computational burden invested in estimating genealogy may permit analysis of more realistic biological processes or demographic histories for which full genealogical reconstruction of entire nucleotide sequences may be altogether infeasible. For
the application at hand, our model explicitly conditions the genealogical histories on the unique origin of the inversion that prevents introgression in the genomic region studied (appendix b). Incorporation of this
biological information into the estimation procedure entailed only modification of Markov matrices of rates of within- and between-level transitions (appendix a).
This structural flexibility may permit customization of the analysis to a wide variety of biological systems.
Estimation of divergence times:Species divergence cor-responds to a change in coalescence structure: the most recent point at which ancestral lineages with descend-ants in different species can have coalesced. Using the age of the most recent node with descendants sampled from different populations as a surrogate for divergence time generates negligible error only for ancient di-vergence events involving small ancestral population sizes and little interpopulation gene flow (see Nichols
2001). A number of recent reviews of moment- and likelihood-based approaches have addressed the esti-mation of population divergence apart from node age (Arbogastet al.2002; Rosenbergand Feldman2002;
Takahataand Satta2002).
Many likelihood-based methods related to ours treat time since speciation as a parameter. Takahataet al.
(1995), Rannalaand Yang(2003), and Wall(2003)
based the estimation of divergence time and ancestral population size on numbers of segregating sites in a present-day sample comprising one sequence from each of two or more species. Nielsenand Wakeley(2001)
and Hey and Nielsen (2004) used MH sampling to
approximate the posterior distribution of fully resolved gene genealogies, including all node ages and time since speciation.
To incorporate time into the method of Griffiths
and Tavare´(1994), for which the genealogical histories
record only the relative order of events, Nielsen(1998)
determined the probability distribution of the numbers of ancestral lineages remaining in each group at the divergence event. Our method characterizes the time since speciation as an exponentially distributed random variable and estimates the instantaneous rate of speci-ation (l/u). This construction obviates the need to incorporate time into the backward construction of genealogical histories.
Unique evolutionary events: Slatkin and Rannala
(1997, 2000) based the estimation of the age of an advantageous or deleterious mutation on the relative magnitudes of neutral variation segregating within the affected and unaffected subsamples. The sample gene-alogy reflects coalescence of affected lineages only among themselves, with the number of ancestors from which they could have descended determined from a branching-process model. In contrast, Wiuf and
Donnelly(1999) addressed the age of a neutral marker
restricted to a subset $ of genes sampled from a population. Determination of the likelihood entails
conditioning a random gene genealogy to contain a node from which all members of$ and none of the other sampled genes descend and requiring the occur-rence of exactly one neutral mutation on the branch immediately ancestral to that node. These approaches differ with respect to more than statistical philosophy. In the latter case, the partitioning of the sample arises only after observation of the mutation of interest, while in the former, the distinction between affected and un-affected genes exists before observation of the sample.
We chose to study theDPS2002region precisely be-cause tight linkage to a second chromosome inversion precludes its introgression. We have imposed the sim-plifying assumption that the origin of the inversion occurred immediately before the MRCA of the inverted lineages. Further, for cases in which the MRCA of the inverted lineages predates the speciation event, our model assumes a constant frequency (p) of the inversion in the ancestral species and permits coalescence only within and not between gene orders. A more detailed analysis would incorporate a description of evolutionary change inp(e.g., Slatkinand Rannala1997; DeIorio
and Griffiths2004).
Importance sampling:The high complexity of virtually all biological systems of interest ensures that any par-ticular realization of the evolutionary process occurs with extremely low probability, making approximation of likelihoods by ‘‘naive’’ Monte Carlo simulation im-practical (Stephensand Donnelly2000). Importance
sampling offers a means of compensating for discrep-ancies generated by sampling from convenient but incorrect proposal distributions. As discussed in the introductory section, sprinkling the observed number of mutations over a random genealogy under the ‘‘fixed-S’’ procedure very rapidly generates genealogical and mutational histories consistent with the data, but ap-proximates an incorrect distribution (Markovtsova
et al.2001).
Our method (2) proposes genealogical paths (4) by sampling, not from a posterior distribution given the full data (D ¼ fD1, D2g), but from an analytically
determined stationary distribution (7) of paths consis-tent with the types of segregating mutations observed (QM(D1,G)). It then sprinkles the observed numbers of
mutations on the genealogical path (QM(D2,UjD1,G))
according to a heuristic weighting scheme (8). We then correct the bias introduced by the proposal distribution using the exact probability of the proposed genealogical and mutational history (appendix a).
Expansion of the evidentiary basis to include additional summary statistics would extract more information from the sampled sequences. Through straightforward redefi-nition of the state space, our method can incorporate counts of mutations of various kinds, including numbers of mutations classified according to their distribution among groups (Wakeleyand Hey 1997; Wakeleyet al.
2001), the number of haplotypes and their frequency
spectrum (Ewens1972), and the frequency spectrum of
mutation numbers (Fu1995). Our approach is less well
suited to summary statistics defined as various moments, including average pairwise differences, variances, regres-sions, and correlations. However, the distribution of mutations among groups can replace pairwiseFSTvalues
as the basis for the characterization of gene flow (Wakeley
and Hey1997), and the relative numbers of segregating
sites at linked loci can replace pairwise linkage disequilib-rium as the basis for the estimation of recombination rate (Takebayashiet al.2004). The simplicity of our approach
(appendix a) facilitates structural modification both to
incorporate more information contained in the sampled sequences and to broaden the scope of evolutionary processes amenable to analysis.
We thank Beatrix Jones for perceiving the relevance of importance sampling to this problem, Michael Lavine for comments and sugges-tions that improved the analysis, Sudhir Kumar for insights into rate calibration and CpG avoidance, John Willis for reminding us of the unique evolutionary origin of inversions, and two anonymous reviewers and John Wakeley for comments. This research was supported in part by funding from National Science Foundation (NSF) [DMS-0203762 (Y.C.), NSF DEB-0314552 (M.A.F.N.), and an NSF predoctoral fellowship ( J.E.S.)] and by the National Institutes of Health [GM 37841 (M.K.U.)].
LITERATURE CITED
Akashi, H., 1995 Inferring weak selection from patterns of
poly-morphism and divergence at ‘‘silent’’ sites in Drosophila DNA. Genetics139:1067–1076.
Aquadro, C. F., A. L. Weaver, S. W. Schaefferand W. W. Anderson,
1991 Molecular evolution of inversions inDrosophila pseudoobs-cura: the amylase region. Proc. Natl. Acad. Sci. USA88:305–309. Arbogast, B. S., S. V. Edwards, J. Wakeley, P. Beerliand J. B. Slowinski,
2002 Estimating divergence times from molecular data on phy-logenetic and population genetic timescales. Annu. Rev. Ecol. Syst.33:707–740.
Beaumont, M. A., 2004 Recent developments in genetic data
anal-ysis: What can they tell us about human demographic history? Heredity92:365–379.
Beaumont, M. A., W. Zhangand D. J. Balding, 2002 Approximate
Bayesian computation in population genetics. Genetics 162:
2025–2035.
Beerli, P., and J. Felsenstein, 2001 Maximum likelihood
estima-tion of a migraestima-tion matrix and effective populaestima-tion sizes inn sub-populations by using a coalescent approach. Proc. Natl. Acad. Sci. USA98:4563–4568.
Berger, J. O., B. Liseoand R. L. Wolpert, 1999 Integrating
likeli-hood methods for eliminating nuisance parameters. Stat. Sci.14:
1–28.
Bustamante, C. D., R. Nielsenand D. L. Hartl, 2002 A maximum
likelihood method for analyzing pseudogene evolution: implica-tions for silent site evolution in humans and rodents. Mol. Biol. Evol.19:110–117.
Crow, J. F., and C. Denniston, 1988 Inbreeding and variance
effec-tive population numbers. Evolution42:482–495.
de Boor, C., 2001 A Practical Guide to Splines. Springer-Verlag,
New York.
DeIorio, M., and R. C. Griffiths, 2004 Importance sampling on
coalescent histories. I. Adv. Appl. Probab.36:417–433. Depaulis, F., and M. Veuille, 1998 Neutrality tests based on the
dis-tribution of haplotypes under an infinite-site model. Mol. Biol. Evol.15:1788–1790.
Depaulis, F., S. Moussetand M. Veuille, 2001 Haplotype tests
Dobzhansky, T., and J. R. Powell, 1975 Drosophila pseudoobscura
and its American relatives,Drosophila persimilisandDrosophila mi-randa, pp. 537–587 inInvertebrates of Genetic Interest, edited by R. C. King. Plenum Press, New York.
Dobzhansky, T., and C. C. Tan, 1936 Studies on hybrid sterility III.
A comparison of the chromosome structure in two related spe-cies,Drosophila pseudoobscuraandDrosophila miranda.Z. Indukt. Abstammungs-Vererbungsl.72:88–113.
Donnelly, P., and S. Tavare´, 1995 Coalescents and genealogical
structure under neutrality. Annu. Rev. Genet.29:401–421. Estoup, A., M. A. Beaumont, F. Sennedot, C. Moritz and J.-M.
Cornuet, 2004 Genetic analysis of complex demographic
sce-narios: spatially expanding populations for the cane toad,Bufo marinus.Evolution58:2021–2036.
Ewens, W. J., 1972 The sampling theory of selectively neutral alleles.
Theor. Popul. Biol.3:87–112.
Felsenstein, J., 1992 Estimating effective population size from
sam-ples of sequences: inefficiency of pairwise and segregation sites as compared to phylogenetic estimates. Genet. Res.59:139–147. Felsenstein, J., M. K. Kuhner, J. Yamatoand P. Beerli, 1999
Like-lihoods on coalescents: a Monte Carlo sampling approach to in-ferring parameters from population samples of molecular data, pp. 163–185 inStatistics in Molecular Biology and Genetics, edited by F. Seillier-Moiseiwitsch. Institute of Mathematical Statistics
and American Mathematics Society, Haywood, CA.
Fu, Y.-X., 1995 Statistical properties of segregating sites. Theor.
Popul. Biol.48:172–197.
Fu, Y.-X., and W.-H. Li, 1997 Estimating the age of the common
ances-tor of a sample of DNA sequences. Mol. Biol. Evol.14:195–199. Gentles, A. J., and S. Karlin, 2001 Genome-scale compositional
comparisons in eukaryotes. Genome Res.11:540–546. Griffiths, R. C., and S. Tavare´, 1994 Simulating probability
distri-butions in the coalescent. Theor. Popul. Biol.46:131–159. Griffiths, R. C., and S. Tavare´, 1996 Monte Carlo inference
meth-ods in population genetics. Math. Comput. Model.23:141–158. Hamilton, G., M. Currat, N. Ray, G. Heckel, M. A. Beaumontet al.,
2005 Bayesian estimation of recent migration rates after a spa-tial expansion. Genetics170:409–417.
Hey, J., and C. A. Machado, 2003 The study of structured
popula-tions—new hope for a difficult and divided science. Nat. Rev. Genet.4:535–543.
Hey, J., and R. Nielsen, 2004 Multilocus methods for estimating
population sizes, migration rates and divergence time, with appli-cations to the divergence ofDrosophila pseudoobscuraandD. persi-milis.Genetics167:747–760.
Hudson, R. R., 1993 The how and why of generating gene
geneal-ogies, pp. 23–36 inMechanisms of Molecular Evolution, edited by N. Takahataand A. G. Clark. Sinauer, Sunderland, MA.
Huelsenbeck, J. P., and F. Ronquist, 2001 MRBAYES: Bayesian
in-ference of phylogenetic trees. Bioinformatics17:754–755. KosakovskyPond, S. L., and S. D. W. Frost, 2005 A simple
hierar-chical approach to modeling distributions of substitution rates. Mol. Biol. Evol.22:223–234.
Kuhner, M. K., J. Yamatoand J. Felsenstein, 1995 Estimating
effective population size and mutation rate from sequence data using Metropolis-Hastings sampling. Genetics140:1421–1430. Kuhner, M. K., J. Yamatoand J. Felsenstein, 1998 Maximum-likelihood
estimation of population growth rates based on the coalescent. Genetics149:429–434.
Liu, J. S., 2001 Monte Carlo Strategies in Scientific Computing.
Springer-Verlag, New York.
Machado, C. A., R. M. Kliman, J. A. Markertand J. Hey, 2002
In-ferring the history of speciation from multilocus DNA sequence data: the case ofDrosophila pseudoobscuraand close relatives. Mol. Biol. Evol.19:472–488.
Marjoram, P., J. Molitor, V. Plagnoland S. Tavare´, 2003 Markov
chain Monte Carlo without likelihoods. Proc. Natl. Acad. Sci. USA100:15324–15328.
Markovtsova, L., P. Marjoramand S. Tavare´, 2001 On a test by
Depaulis and Veuille. Mol. Biol. Evol.18:1132–1133.
Navarro, A., E. Betra´ n, A. Barbadillaand A. Ruiz, 1997
Recom-bination and gene flux caused by gene conversion and crossing over in inversion heterozygotes. Genetics146:695–709. Nichols, R., 2001 Gene trees and species trees are not the same.
Trends Ecol. Evol.16:358–364.
Nielsen, R., 1998 Maximum likelihood estimation of population
di-vergence times and population phylogenies under the infinite sites model. Theor. Popul. Biol.53:143–151.
Nielsen, R., and J. Wakeley, 2001 Distinguishing migration from
isolation: a Markov chain Monte Carlo approach. Genetics
158:885–896.
Noor, M. A. F., and K. R. Smith, 2000 Recombination, statistical
power, and genetic studies of sexual isolation in Drosophila. J. Hered.91:99–103.
Noor, M. A. F., K. L. Grams, L. A. Bertucci, Y. Almendarez,
J. Reilandet al., 2001a The genetics of reproductive isolation
and the potential for gene exchange between Drosophila pseu-doobscura and D. persimilisvia backcross hybrid males. Evolution
55:512–521.
Noor, M. A. F., K. L. Grams, L. A. Bertucci and J. Reiland,
2001b Chromosomal inversions and reproductive isolation of species. Proc. Natl. Acad. Sci. USA98:12084–12088.
Piontkivska, H., 2004 Efficiencies of maximum likelihood
meth-ods of phylogenetic inferences when different substitution mod-els are used. Mol. Phylogenet. Evol.31:865–873.
Pritchard, J. K., M. T. Seielstad, A. Perez-Lezaun and M. W.
Feldman, 1999 Population growth of human Y chromosomes:
a study of Y chromosome microsatellites. Mol. Biol. Evol. 16:
1791–1798.
Rannala, B., and Z. Yang, 2003 Bayes estimation of species
diver-gence times and ancestral population sizes using DNA sequences from multiple loci. Genetics164:1645–1656.
Rosenberg, N. A., and M. W. Feldman, 2002 The relationship
be-tween coalescence times and population divergence times, pp. 130–164 inModern Developments in Theoretical Population Genet-ics—The Legacy of Gustave Male´cot, edited by M. Slatkin and
M. Veuille. Oxford University Press, Oxford.
Schaeffer, S. W., 1995 Population genetics inDrosophila pseudoobs-cura: a synthesis based on nucleotide sequence data for theAdh
gene, pp. 329–352 inGenetics of Natural Populations: The Continu-ing Importance of Theodosius Dobzhansky, edited by L. Levine.
Columbia University Press, New York.
Slatkin, M., 1991 Inbreeding coefficients and coalescence times.
Genet. Res.58:167–175.
Slatkin, M., and B. Rannala, 1997 Estimating the age of alleles by
use of intraallelic variability. Am. J. Hum. Genet.60:447–458. Slatkin, M., and B. Rannala, 2000 Estimating allele age. Annu.
Rev. Genomics1:225–249.
Stajich, J. E., D. Block, K. Boulez, S. E. Brenner, S. A. Chervitz et al., 2002 The Bioperl toolkit: Perl modules for the life scien-ces. Genome Res.12:1611–1618.
Stephens, M., 2001 Inference under the coalescent, pp. 213–238 in Handbook of Statistical Genetics, edited by D. J. Balding, M. J.
Bishopand C. Cannings. John Wiley & Sons, Chichester, UK.
Stephens, M., and P. Donnelly, 2000 Inference in molecular
pop-ulation genetics. J. R. Stat. Soc. B62:605–635.
Subramanian, S., and S. Kumar, 2003 Neutral substitutions occur
at a faster rate in exons than in noncoding DNA in primate ge-nomes. Genome Res.13:838–844.
Sved, J., and A. Bird, 1990 The expected equilibrium of the CpG
dinucleotide in vertebrate genomes under a mutation model. Proc. Natl. Acad. Sci. USA87:4692–4696.
Takahashi, K., and M. Nei, 2000 Efficiencies of fast algorithms of
phylogenetic inference under the criteria of maximum parsimony, minimum evolution, and maximum likelihood when a large num-ber of sequences are used. Mol. Biol. Evol.17:1251–1258. Takahata, N., and Y. Satta, 2002 Pre-speciation coalescence and
the effective size of ancestral populations, pp. 52–71 inModern Developments in Theoretical Population Genetics—The Legacy of Gus-tave Male´cot, edited by M. Slatkinand M. Veuille. Oxford
Uni-versity Press, Oxford.
Takahata, N., Y. Satta and J. Klein, 1995 Divergence time and
population size in the lineage leading to modern humans. Theor. Popul. Biol.48:198–221.
Takebayashi, N., E. Newbigin and M. K. Uyenoyama,
2004 Maximum-likelihood estimation of rates of recombina-tion within mating-type regions. Genetics167:2097–2109. Tallmon, D. A., G. Luikartand M. A. Beaumont, 2004 Quantitative
evaluation of a new effective population size estimator based on ap-proximate Bayesian computation. Genetics167:977–988.
Tamura, K., S. Subramanianand S. Kumar, 2004 Temporal
pat-terns of fruit fly (Drosophila) evolution revealed by mutation clocks. Mol. Biol. Evol.21:36–44.
Tavare´, S., D. J. Balding, R. C. Griffiths and P. Donnelly,
1997 Inferring coalescence times from DNA sequence data. Genetics145:505–518.
Thompson, J. D., D. G. Higginsand T. J. Gibson, 1994 CLUSTAL W:
improving the sensitivity of progressive multiple sequence align-ment through sequence weighting, position-specific gap penalties and weight matrix choice. Nucleic Acids Res.22:4673– 4680.
Turelli, M., N. H. Bartonand J. A. Coyne, 2001 Theory and
spe-ciation. Trends Ecol. Evol.16:330–343.
Uyenoyama, M. K., and N. Takebayashi, 2004 A simple method for
computing exact probabilities of mutation numbers. Theor. Popul. Biol.65:271–284.
Wakeley, J., and J. Hey, 1997 Estimating ancestral population
parameters. Genetics145:847–855.
Wakeley, J., R. Nielsen, S. N. Liu-Corderoand K. Ardlie, 2001 The
discovery of single-nucleotide polymorphisms—and inferences about human demographic history. Am. J. Hum. Genet. 69:
1332–1347.
Wall, J. D., 2003 Estimating ancestral population sizes and
diver-gence times. Genetics163:395–404.
Wall, J. D., and R. R. Hudson, 2001 Coalescent simulations and
statistical tests of neutrality. Mol. Biol. Evol.18:1134–1135.
Wall, J. D., P. Andolfattoand M. Przeworski, 2002 Testing
mod-els of selection and demography inDrosophila simulans.Genetics
162:203–216.
Wang, R. L., J. Wakeleyand J. Hey, 1997 Gene flow and natural
selection in the origin ofDrosophila pseudoobscuraand close rela-tives. Genetics147:1091–1106.
Watterson, G. A., 1975 On the number of segregating sites in
ge-netical models without recombination. Theor. Popul. Biol. 7:
256–276.
Watterson, G. A., 1985 The genetic divergence of two populations.
Theor. Popul. Biol.27:298–317.
Weiss, G., and A.vonHaeseler, 1998 Inference of population
his-tory using a likelihood approach. Genetics149:1539–1546. Wilson, I. J., and D. J. Balding, 1998 Genealogical inference from
microsatellite data. Genetics150:499–510.
Wilson, I. J., M. E. Wealeand D. J. Balding, 2003 Inferences from
DNA data: population histories, evolutionary processes and fo-rensic match probabilities. J. R. Stat. Soc. A166:155–201. Wiuf, C., 2003 Inferring population history from genealogical trees.
J. Math. Biol.46:241–264.
Wiuf, C., and P. Donnelly, 1999 Conditional genealogies and the
age of a neutral mutant. Theor. Popul. Biol.56:183–201. Yang, Z., 1996 Maximum-likelihood models for combined analyses
of multiple sequence data. J. Mol. Evol.42:587–596.
Communicating editor: J. Wakeley
APPENDIX A: PROBABILITY-GENERATING FUNCTIONS
For convenience, we summarize the recursive determination of a PGF of the arraynof segregating sites observed in a sample of arbitrary size from the two species (see Uyenoyamaand Takebayashi2004).
MatricesPland andQl, respectively, provide per-generation rates of within-level and between-level transitions for states on levell. For state a within level l, let Cl;adenote the total rate of transition to any other configuration,
irrespective of level,
Cl;a¼Pl;a1Ql;a; ðA1Þ
forPl;aandQl;arepresenting row sums of the within- and between-level transition rate matrices. MatricesUlandVl
denote within- and between-level transition probabilities, given the occurrence of a transition,
Ul¼C1l Pl
Vl¼C1l Ql;
ðA2Þ
forCl, a diagonal matrix in which the diagonal element in rowacorresponds toCl;a(A1).
Under a geometric distribution for the total number of mutations accumulated in the interval terminated by the first transition from stateaand a multinomial distribution, given this total number, for the number of mutations arising on the three types of lineages, we obtain the joint PGF of mutation numbers,
fl;aðaÞ ¼
Cl;a
Cl;a1u½l1ð1c1Þ1l2ð1c2Þ1l3ð1c3Þ
; ðA3Þ
in whicha¼(a1,a2,a3,a4,a5,a6,a7) represents the array of seven PGF parameters corresponding to the seven types of
observed segregating mutations (Table 1), and the assignment of these PGF parameters toc1,c2, andc3depends on the
configuration of statea:
c1 ¼
a1 ifl1.1 or bothl1 ¼1 andl3.0 a2 ifl1 ¼1 andl3¼0
c2 ¼
a3 ifl2.1 or bothl2 ¼1 andl3.0 a4 ifl2 ¼1 andl3¼0
c3 ¼
a5 ifl3.1 or bothl3 ¼1 andl1;l2.0 a6 ifl1 ¼0;l2.0;andl3¼1
a7 ifl1.0;l2¼0;andl3¼1:
8 > < > :
These expressions indicate that the conditional transition matrices (A2) and the joint distribution of mutation numbers (A3) depend only on the relative rates of transition and mutation:l/u,uN0,uN1, anduN2.
To obtain an expression forRlðaÞ(5), the joint PGF of mutations occurring within levellof the sample genealogy, we consider the array of mutations that occurred before and after the most recent transition,
glðaÞ ¼FlðaÞ½UlglðaÞ1Vlgl1ðaÞ; ðA5Þ forFlðaÞ;a diagonal matrix with the PGFs of mutation numbers (A3) for states within levellarrayed along the diagonal. Rearrangement of (A5) completes the recursion (5),
RlðaÞ ¼ ½IFlðaÞUl1FlðaÞVl
¼ ½IDlðaÞPl1DlðaÞQl;
ðA6Þ
for
DlðaÞ ¼FlðaÞC1l :
Because speciation alone induces within-level transitions and occurs exactly once in a genealogy,
Pkl ¼Ukl ¼0 fork$2; ðA7Þ
under which the matrix inverses in (7) and (A6) reduce to
½IUl1Vl¼ ½I1UlVl
RlðaÞ ¼ ½I1FlðaÞUlFlðaÞVl
¼ ½I1DlðaÞPlDlðaÞQl:
In determining the recursion in probabilities (6), we observe that the PGF parameters (a1,a2,. . .,a7) appear only
in theDlðaÞ:Derivatives of these diagonal matrices with respect to theaitake the form dDlðaÞ
dai ¼DlðaÞ 2E
l;i;
forEl;i;a diagonal matrix of the absolute values of the coefficients ofaiin the denominators of the elements ofDlðaÞ (A3). All configurations within a given block (l1,l2,l3) share the same coefficient ofai, implying that the corresponding
submatrix ofEl;iis proportional to the identity matrix ulxI;
forx, the lineage type associated withaiin this block (A4). Using
PlEl;i¼El;iPl
and (A7), we obtain
RðqÞl ð0Þ ¼q!
Y7
i¼1
Eqil;i
!
½Dlð0Þq1
Xq
j¼0
½Dlð0ÞjFlð0ÞUl½Dlð0Þqj
!
Flð0ÞVl; ðA8Þ
in whichqð¼Pqi.0Þrepresents the total number of mutations arising on levell. The product of theEl;imatrices in
(A8) is nonzero only for arraysqthat specify a combination of mutations that can occur on levell.
APPENDIX B: CONDITIONED GENEALOGIES
We extend the method of Wiuf and Donnelly (1999) to restrict the genealogical paths proposed by our IS
procedure to those consistent with the kinds of mutations observed in the sample (D1). We describe the conditioning
of genealogies on each of the four possible topologies (ff/a,a/fg,ff/a,f/sg,fs/s,f/sg, andfs/sg), both with and without the substructuring of the ancestral species induced by the presence of the chromosomal inversion that precludes introgression atDPS2002. In the system under study, the unique origin of this inversion entails the presence of anf/abranch (first two topologies), whether or not the data set includes anf/amutation.
LetT0(x,y,z) represent the probability that a process presently in the prespeciation state (l01¼x,l02¼y,l03¼z, 0, 0)
has a genealogy of the required kind, and let T1(x, y, 0) be the corresponding probability for a process in the