ISSN(Online): 2319-8753 ISSN (Print): 2347-6710
I
nternational
J
ournal of
I
nnovative
R
esearch in
S
cience,
E
ngineering and
T
echnology
(A High Impact Factor, Monthly, Peer Reviewed Journal) Visit: www.ijirset.com
Vol. 7, Issue 3, March 2018
A Brief Study of Chassis of a BAJA ATV and
its Analysis
Shripad Mane
Research Scholar, Sinhgad Academy of Engineering, Pune, India
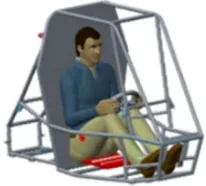
Abstract: A BAJA is an ATV(All Terrain Vehicle) which is known to be manufactured by international teams and also college students. This vehicle is used for competing in inter-collegiate competitions at national and international level. A BAJA ATV is designed keeping in mind the driver's ergonomic comfort in focus. As BAJA is a vehicle which competes in competitions and is not a kind of vehicle which cannot be used commercially, the driver is first selected who will drive it for the competitions. The approach begins with driver sitting in most comfortable position, capable of withstanding fatigue for minimum of 4-6 Hours. This ensures a proper methodology for design of roll cage and thereby rest of the vehicle. The report summarises the methodology adapted for manufacturing the vehicle and use of Finite Element Analysis for validation of design. The analysis provides clear understanding on projected stresses and possible failure locations. This allows one to consider new techniques and adjustments in design to lower the possibility of failure. This marks the efforts put in CAE of chassis of vehicle. The report also focuses on optimisation done to ensure proper use of resources. An ATV BAJA Manufacturer understands importance of cost value of product and efficient design, hence this report keeps optimisation of chassis within focus, without compromising safety of driver.
KEYWORDS: Automobile, BAJA, Chassis, Analysis, Hypermesh, Ansys, ATV
I. INTRODUCTION
Designing of a chassis is a challenging task. It is the goal to minimize as much weight as possible. Focus is on cutting off unnecessary members from chassis that had no help whatsoever in strengthening the rollcage. In addition, plan is to make the rollcage as compact as possible. Various parameters are considered while designing chassis such as adequate Ground clearance, light structure without compromising the strength, ergonomically and aesthetically sound and driver’s safety
Roll Cage Design Procedure
ISSN(Online): 2319-8753 ISSN (Print): 2347-6710
I
nternational
J
ournal of
I
nnovative
R
esearch in
S
cience,
E
ngineering and
T
echnology
(A High Impact Factor, Monthly, Peer Reviewed Journal) Visit: www.ijirset.com
Vol. 7, Issue 3, March 2018
The roll cage design begins by considering the fatigues the driver faces during 4-6 hour endurance race held in competitions. Therefore, driver is asked to assume most comfortable position and measurements were done on templates.
This escalates the process to confronting with rulebook standard if there is any. The material selection was done without arguing with the standards set in section- B7.3.12 of SAEINDIA BAJA Rulebook .which in this case is taken as reference for design of chassis.
Material for making roll cage is AISI 4130. The primary members are of 29.2 mm OD and 1.65 mm thickness. The equivalency calculations are as follows:
Table 1. Material equivalency calculations
Dimension MI
(mm4) Bending Stiffness
( N.mm2)
Bending Strength ( N-mm) 25.4x3 13478.368 2.7631x10⁹ 656931.7
29.2x1.65 13597.643 2.7875x10⁹ 798168.8
25.4x1.2 6695.049 1.3724x10⁹ 326317.7
Tube Size Selection
During FEA simulation, specific tubes of areas are considered. Considering rules from BAJA SAEINDIA rulebook, main structural members were placed.
During analysis, the areas of high stresses are to be concentrated and alleviated by adding bracing members to tune the stiffness.
I performed torsional analysis in order to obtain desired torsional rigidity and according to that, gusseting members were placed.
II. METHODOLOGY AND PROCEDURE:
The chassis can be designed on softwares such as CATIA, Creo, Solidworks. The Analysis can be done with the help of softwares such as Hypermesh and Ansys. Here, the chassis is designed on Creo taking into consideration the BAJA SAEINDIA Rulebook. Analysis is done on Hypermesh as well as Ansys
FEA ANALYSIS:
Front impact analysis:
1) Car to car dynamic impact analysis:
ISSN(Online): 2319-8753 ISSN (Print): 2347-6710
I
nternational
J
ournal of
I
nnovative
R
esearch in
S
cience,
E
ngineering and
T
echnology
(A High Impact Factor, Monthly, Peer Reviewed Journal) Visit: www.ijirset.com
Vol. 7, Issue 3, March 2018
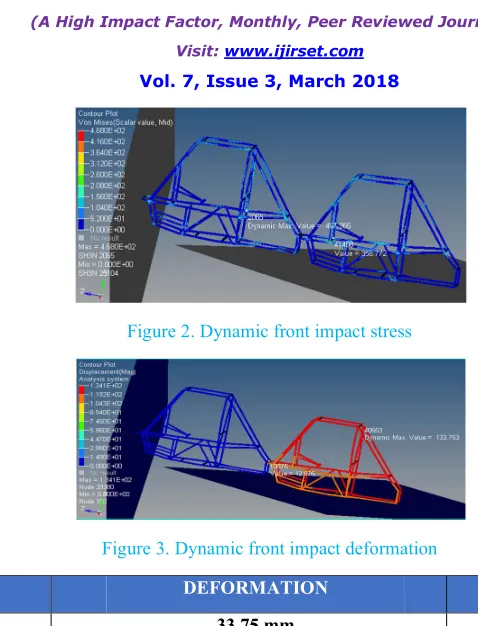
Figure 2. Dynamic front impact stress
Figure 3. Dynamic front impact deformation
STRESS DEFORMATION FOS
356.77 N/mm2 33.75 mm 1.73
2) Static front impact analysis:
Assumptions made :
Car travelling at 16.67m/s rams into stationary mass longitudinally.
Crash impulse of 0.25s.
The total load acting on front bulkhead was calculated using following empirical relations:
Final velocity(v) = Initial velocity(u) + acceleration(a)*time(t)
0=16.67+acceleration(a)*0.25
Acceleration(a)= -66.68m/s^2 (retarding) Total force acting on the body = 240*66.68 = 16003.2N
ISSN(Online): 2319-8753 ISSN (Print): 2347-6710
I
nternational
J
ournal of
I
nnovative
R
esearch in
S
cience,
E
ngineering and
T
echnology
(A High Impact Factor, Monthly, Peer Reviewed Journal) Visit: www.ijirset.com
Vol. 7, Issue 3, March 2018
Figure 5. Static front impact deformation
STRESS DEFORMATION FOS
361.5 N/mm2 2.28 mm 1.71
Rear impact analysis:
1) Car to car dynamic impact analysis:
For front impact analysis the vehicle was assumed to be making an impact upon another vehicle with the speed of 60 km/hr.
Figure 6. Dynamic Rear impact stress
ISSN(Online): 2319-8753 ISSN (Print): 2347-6710
I
nternational
J
ournal of
I
nnovative
R
esearch in
S
cience,
E
ngineering and
T
echnology
(A High Impact Factor, Monthly, Peer Reviewed Journal) Visit: www.ijirset.com
Vol. 7, Issue 3, March 2018
STRESS DEFORMATION FOS
467.96 N/mm2 12.975 mm 1.32
2) Static rear impact analysis:
Assumptions made :
Car travelling at 16.67m/s makes impact on rear bulkhead longitudinally.
Crash impulse of 0.25s
The total load acting on rear bulkhead was calculated using following empirical relations:
Final velocity(v) = Initial velocity(u) + acceleration(a)*time(t)
0=16.67+acceleration(a)*0.25
Acceleration(a)= -66.68m/s^2 (retarding) Total force acting on the body = 240*66.68 = 16003.2N
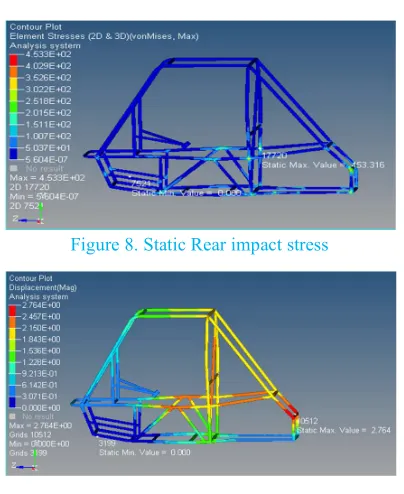
Figure 8. Static Rear impact stress
Figure 9. Static Rear impact deformation
STRESS DEFORMATION FOS
ISSN(Online): 2319-8753 ISSN (Print): 2347-6710
I
nternational
J
ournal of
I
nnovative
R
esearch in
S
cience,
E
ngineering and
T
echnology
(A High Impact Factor, Monthly, Peer Reviewed Journal) Visit: www.ijirset.com
Vol. 7, Issue 3, March 2018
Side impact analysis:
1) Car to car dynamic impact analysis:
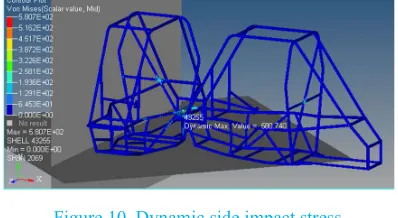
For front impact analysis the vehicle was assumed to be making an impact on one side of another vehicle with the speed of 40 km/hr.
Figure 10. Dynamic side impact stress
Figure 11. Dynamic side impact deformation
STRESS DEFORMATION FOS
580.74 N/mm2 35.727 mm 1.06
2) Static side impact analysis:
Assumptions made :
Car travelling at 9.72m/s makes impact on one side of another vehicle.
Crash impulse of 0.25s
The total load acting on side was calculated using following empirical relations:
Final velocity(v) = Initial velocity(u) + acceleration(a)*time(t)
0=9.72+acceleration(a)*0.25
ISSN(Online): 2319-8753 ISSN (Print): 2347-6710
I
nternational
J
ournal of
I
nnovative
R
esearch in
S
cience,
E
ngineering and
T
echnology
(A High Impact Factor, Monthly, Peer Reviewed Journal) Visit: www.ijirset.com
Vol. 7, Issue 3, March 2018
Figure 12. Static side impact stress
Figure 13. Static side impact deformation
STRESS DEFORMATION FOS
563.3 N/mm2 4.33 mm 1.1
Rollover analysis:
1) Dynamic impact analysis:
For the simulation of Roll over analysis, the vehicle was assumed to be getting toppled from a bump at speed of 27.83 km/hr.
ISSN(Online): 2319-8753 ISSN (Print): 2347-6710
I
nternational
J
ournal of
I
nnovative
R
esearch in
S
cience,
E
ngineering and
T
echnology
(A High Impact Factor, Monthly, Peer Reviewed Journal) Visit: www.ijirset.com
Vol. 7, Issue 3, March 2018
Figure 15. Dynamic roll over deformation
STRESS DEFORMATION FOS
585.61 N/mm2 29.8 mm 1.05
2) Static roll over analysis:
For the simulation of Roll over analysis, the vehicle was assumed to be getting toppled from a bump. The forces were applied on the front bracing and roll hoop member and the suspension pick up points were constrained. For the worst case scenario the force was assumed as 3G force.
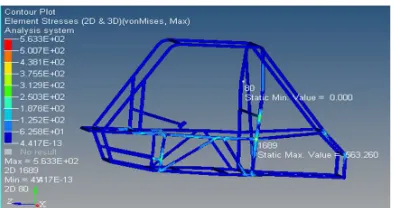
Figure 16. Static roll over stress
ISSN(Online): 2319-8753 ISSN (Print): 2347-6710
I
nternational
J
ournal of
I
nnovative
R
esearch in
S
cience,
E
ngineering and
T
echnology
(A High Impact Factor, Monthly, Peer Reviewed Journal) Visit: www.ijirset.com
Vol. 7, Issue 3, March 2018
STRESS DEFORMATION FOS
568.59 N/mm2
5.9 mm 1.09
Torsional analysis:
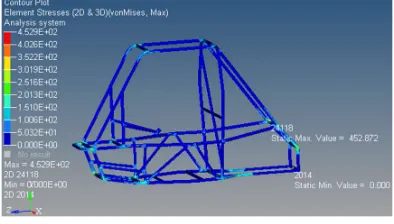
Torsional analysis was performed on the rollcage and the gusseting members were added at the highly stressed areas to increase the stiffness of the chassis.
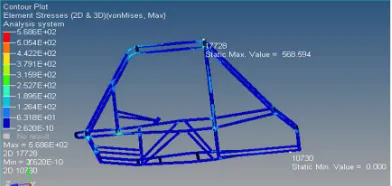
Figure 18. Torsional stress
Figure 19. Torsional deformation
STRESS DEFORMATION FOS
452.87 N/mm2
7.27 mm 1.36
Total deformation in Y-direction = Δy1= 7.27mm. Total deformation in -Y-direction = Δy2= 7.27mm.
We calculated the torsional rigidity of the chassis by using following formula,
Torsional Rigidity =
ISSN(Online): 2319-8753 ISSN (Print): 2347-6710
I
nternational
J
ournal of
I
nnovative
R
esearch in
S
cience,
E
ngineering and
T
echnology
(A High Impact Factor, Monthly, Peer Reviewed Journal) Visit: www.ijirset.com
Vol. 7, Issue 3, March 2018
Where, l = distance between centre of car and suspension pick up points.
Torsional Rigidity = .
(. ∗ . . )
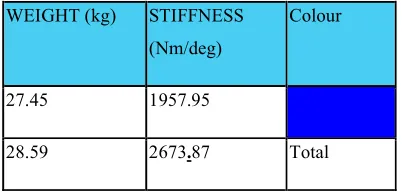
Torsional Rigidity = 2673.87 N.m/Degree
Figure 20. Torsional analysis
Table 2. Torsional analysis results
Modal analysis:
Modal analysis or vibration analysis has been done to ensure that the natural frequency of the roll cage does not match the frequency of vibration of the engine in its working range from 1700 rpm to 3800 rpm.
In the working range, the frequency of vibration of the engine has the value from 14.16 Hz to 31.57 Hz. After modal analysis, the following results were obtained.
Figure 21. Mode 1
WEIGHT (kg) STIFFNESS (Nm/deg)
Colour
27.45 1957.95
ISSN(Online): 2319-8753 ISSN (Print): 2347-6710
I
nternational
J
ournal of
I
nnovative
R
esearch in
S
cience,
E
ngineering and
T
echnology
(A High Impact Factor, Monthly, Peer Reviewed Journal) Visit: www.ijirset.com
Vol. 7, Issue 3, March 2018
Figure 22. Mode 2
Figure 23. Mode 3
Figure 24. Mode 4
ISSN(Online): 2319-8753 ISSN (Print): 2347-6710
I
nternational
J
ournal of
I
nnovative
R
esearch in
S
cience,
E
ngineering and
T
echnology
(A High Impact Factor, Monthly, Peer Reviewed Journal) Visit: www.ijirset.com
Vol. 7, Issue 3, March 2018
Figure 26. Mode 6
Figure 27. Mode 7
Figure 28. Mode 8
ISSN(Online): 2319-8753 ISSN (Print): 2347-6710
I
nternational
J
ournal of
I
nnovative
R
esearch in
S
cience,
E
ngineering and
T
echnology
(A High Impact Factor, Monthly, Peer Reviewed Journal) Visit: www.ijirset.com
Vol. 7, Issue 3, March 2018
Table 3. Modes of vibration
III. CONCLUSION
From the result, we can see that resonance is not occurring as no mode of vibration of chassis is matching with natural frequency of engine.
REFERENCES
1) Jornsen Reimpell, Helmut Stoll, Jurgen Betzler. "The Automotive Chassis", Butterworth Heinemann Publication. 2) Nitin S.Gokhale, Sanjay S.Deshpande, Sanjeev V.Bedekar. "Practical finite element analysis".
Mode Frequency