ABSTRACT
ANBALAGAN, PRASANTH. A Study of Software Security Problem Disclosure, Correction and Patching Processes. (Under the direction of Dr. Mladen Vouk.)
Quantitative analysis of software security problems plays an important role in understanding software security. Information on how and when software security problems are disclosed, exploited in the field, fixed by developers and patched by users, is often analysed from a calendar time perspective. This provides worst-case assessment and effort-to-fix information, but is not directly related to actual operational impact of the discovered problems. Given that security problems are a subset of the more general category of software problems, employing usage metrics typically found in classical software reliability engineering, such as inservice time, appears to be a reasonable approach for assessing security problems. The main goal of this thesis is to investigate operational software security problem disclosure, correction and patching processes through publicly available information, and through that improve our understanding of of the issues, as well as enable better process and defense planning and related decision making.
One of the issues one runs into almost immediately when studying open software security data is the distributed nature and diversity of such data. The data reside in numerous data bases, in different formats, and it is a challenge to collect that information. The first step in the current work was to develop a set of tools for automated collection of linked information across public repositories. Investigated were products that follow a process of full disclosure of security problems before fixes are available (we call them “full disclosure” products), and those that disclose security problems along with fixes and possibly only limited information about them (we call them “limited disclosure” products). To analyse and understand collected information, a comprehensive security problem response model was developed that describes interactions of events associated with users, developers, attackers, software security problems, and fixes. The model captures the states through which a software may go based on the discov-ery, disclosure, exploit, failure, and correction of security problems. The model distinguishes itself from published models by emphasizing roles and operational impact perspectives.
As part of the analyses, two sub-models are investigated for estimating the disclosure of unique security problems - the classical Logarithmic Poisson Execution Time (LPET) model, and a Bayesian model. The latter model was included to capture the subjective views of risk and exposure. Both models were found to work well - the LPET in the context of security problem rates across releases, and the Bayesian model in the context of disclosure of security problems per release.
c
Copyright 2011 by Prasanth Anbalagan
A Study of Software Security Problem Disclosure, Correction and Patching Processes
by
Prasanth Anbalagan
A dissertation submitted to the Graduate Faculty of North Carolina State University
in partial fulfillment of the requirements for the Degree of
Doctor of Philosophy
Computer Science
Raleigh, North Carolina
2011
APPROVED BY:
Dr. Laurie Williams Dr. Xuxian Jiang
Dr. Jason Osborne Dr. Mladen Vouk
DEDICATION
BIOGRAPHY
ACKNOWLEDGEMENTS
First, I would like to thank my advisor, Dr. Mladen Vouk, for his valuable guidance and support during my Ph.D program. I thank Drs. Laurie Williams, Xuxian Jiang, and Jason Os-borne for serving on my dissertation committee and providing valuable suggestions in improving this research work. This work was supported by the U.S. Army Research Office under grant W911NF-08-1-0105 managed by NCSU Secure Open Systems Initiative (SOSI). The contents of this paper do not necessarily reflect the position or the policies of the U.S. Government.
TABLE OF CONTENTS
List of Tables . . . vii
List of Figures . . . .viii
Chapter 1 Introduction . . . 1
1.1 Motivation and Problem . . . 1
1.2 Solution Overview . . . 3
1.3 Summary of Contributions . . . 3
1.4 Outline . . . 6
Chapter 2 Empirical Analysis . . . 8
2.1 Introduction . . . 8
2.2 Mining Security Data From Public Repositories . . . 8
2.2.1 Approach . . . 9
2.2.2 Implementation . . . 14
2.2.3 Discussion . . . 15
2.3 Empirical Results . . . 15
2.3.1 Security vs Non-security Problems . . . 16
2.3.2 Voluntary and Involuntary Security Problems . . . 17
2.3.3 Security Exploits . . . 19
2.3.4 Security Failures . . . 20
2.4 Case Study - Security Problems in Linux Distributions . . . 22
2.4.1 Metrics . . . 23
2.4.2 Data . . . 27
2.4.3 Numerical Results and Discussion . . . 28
Chapter 3 Security Problem Response Model . . . 32
3.1 Introduction . . . 32
3.2 Model . . . 32
3.3 Case Study - Security Problems from Open Source Vulnerability Data Base . . . 35
3.3.1 Numerical Results and Discussion . . . 37
Chapter 4 Predictive Modeling . . . 42
4.1 Classical Software Reliability Model on Security Data . . . 42
4.2 Bayesian Model . . . 45
4.2.1 Modeling Disclosure related Beliefs . . . 45
4.2.2 Evaluation . . . 54
4.3 Variability in the Operational Use . . . 57
4.3.1 Sensitivity Analysis . . . 62
Chapter 5 Analysis of Disclosure and Patching Policies . . . 65
5.1 Introduction . . . 65
5.2 Time-line View of the Security Model . . . 65
5.3 Simulation Results and Discussion . . . 74
5.3.1 Developer Response to Security Problems . . . 74
5.3.2 Impact of Security Failures . . . 77
5.3.3 Impact of Patching Policies . . . 81
Chapter 6 Conclusion . . . 88
6.1 Future Work . . . 89
Chapter 7 Related Work . . . 90
7.1 Security Data . . . 90
7.2 Attacker Perspective . . . 90
7.3 Developer Perspective . . . 91
7.4 User perspective . . . 93
7.5 Predictive Modeling . . . 93
7.6 Simulation Analyses . . . 94
LIST OF TABLES
Table 2.1 Tool statistics . . . 15
Table 2.2 Security problems from the NVD . . . 18
Table 2.3 Data on exploits known/unknown . . . 20
Table 2.4 Voluntary/Involuntary . . . 20
Table 2.5 Bugzilla security problems . . . 21
Table 2.6 Security failures . . . 21
Table 2.7 Symantec information on security threats (2000-2010) . . . 22
Table 2.8 Broad spread security threats . . . 22
Table 2.9 Fedora Statistics . . . 26
Table 2.10 Ubuntu Statistics . . . 28
Table 2.11 RedHat Enterprise Linux Statistics . . . 29
Table 2.12 SuseLinux Statistics . . . 30
Table 2.13 Rates and Average values . . . 31
Table 3.1 Fedora rates . . . 38
Table 3.2 Bugzilla rates (number of security problems per minute (per week)) . . . . 39
Table 3.3 OSVDB rates (number of security problems per minute (per week)) . . . . 41
Table 4.1 Security faults statistics . . . 54
Table 4.2 Disclosure rate prediction results . . . 56
Table 4.3 Sensitivity analysis for parameter alpha on Y . . . 63
Table 4.4 Sensitivity analysis for parameter mu and sigma on theta . . . 63
Table 5.1 Timeline events parameters . . . 73
Table 5.2 User patch trend . . . 74
LIST OF FIGURES
Figure 1.1 Security problems disclosed vs calendar time . . . 2
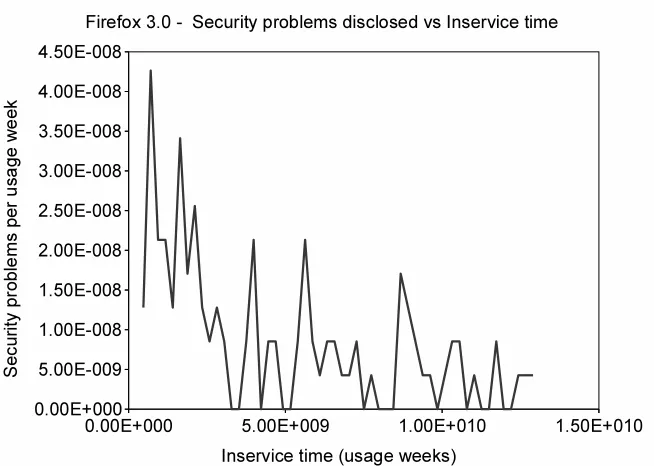
Figure 1.2 Security problems disclosed vs inservice time . . . 2
Figure 2.1 Framework . . . 10
Figure 2.2 NVD and bug repositories using Launchpad . . . 12
Figure 2.3 NVD and bug repositories using Bugzilla . . . 13
Figure 2.4 Trend test for non-security problems . . . 16
Figure 2.5 Trend test for security problems . . . 17
Figure 2.6 Problem report, exploit and correction time intervals . . . 24
Figure 3.1 Security problem response model . . . 33
Figure 3.2 Security model . . . 36
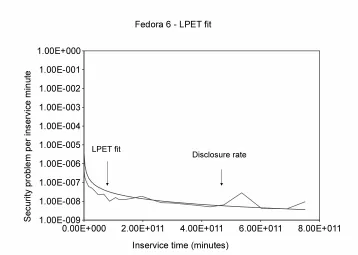
Figure 4.1 Fedora 6 - LPET fit (security problems per minute) . . . 43
Figure 4.2 Fedora 6 - Security problems . . . 43
Figure 4.3 Fedora 7 - Security problems . . . 44
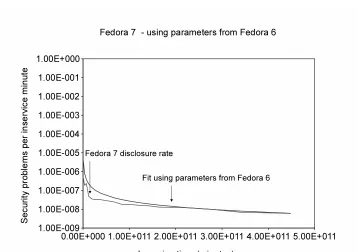
Figure 4.4 Fedora-7 fit using parameters from Fedora-6 . . . 44
Figure 4.5 Test for exponential distribution of time between disclosures . . . 48
Figure 4.6 Test for poisson distribution of number of unique disclosures . . . 49
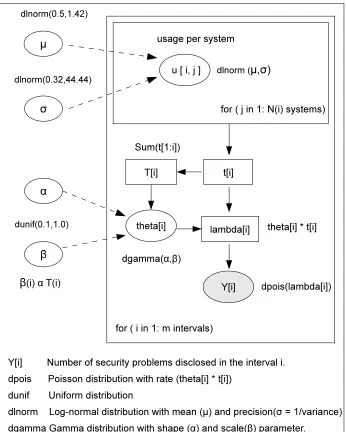
Figure 4.7 Disclosure model . . . 51
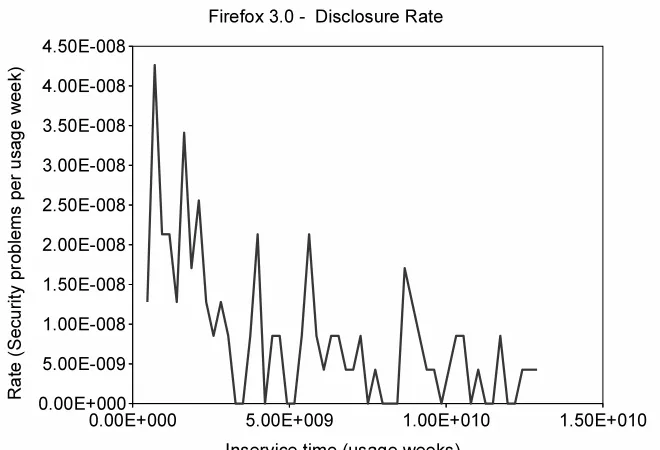
Figure 4.8 Firefox-3.0 disclosure rate . . . 55
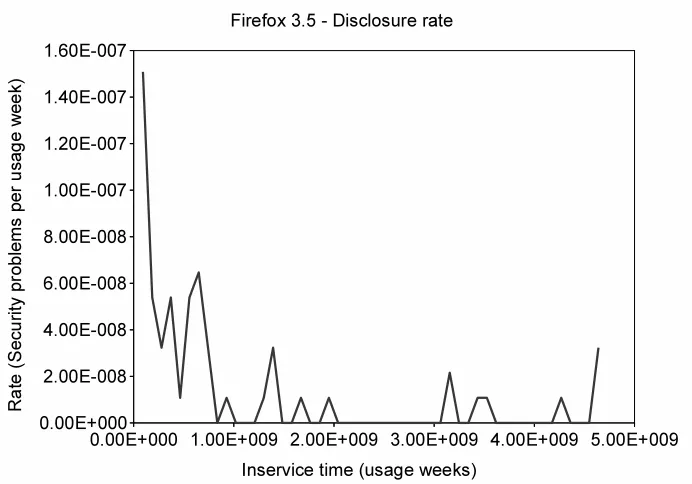
Figure 4.9 Firefox-3.5 disclosure rate . . . 56
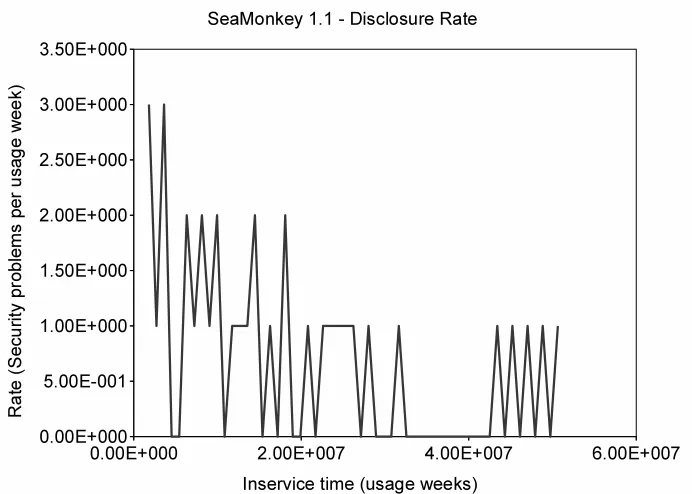
Figure 4.10 SeaMonkey-1.1 disclosure rate . . . 57
Figure 4.11 Firefox-3.0 prediction using 20% of the total execution time . . . 58
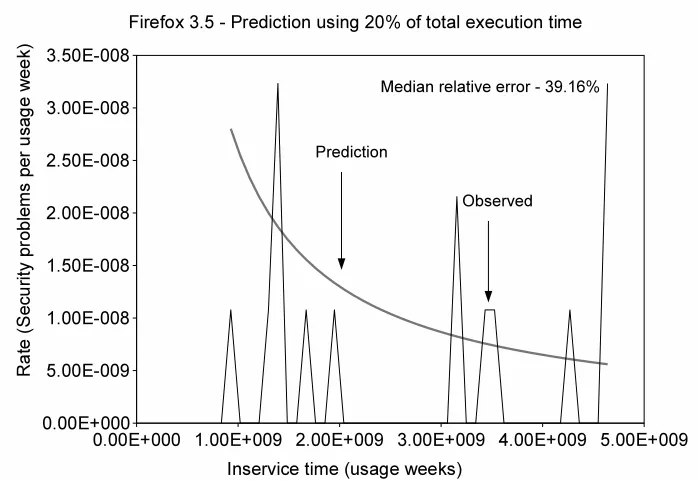
Figure 4.12 Firefox-3.5 prediction using 20% of the total execution time . . . 58
Figure 4.13 SeaMonkey-1.1 prediction using 20% of the total execution time . . . 59
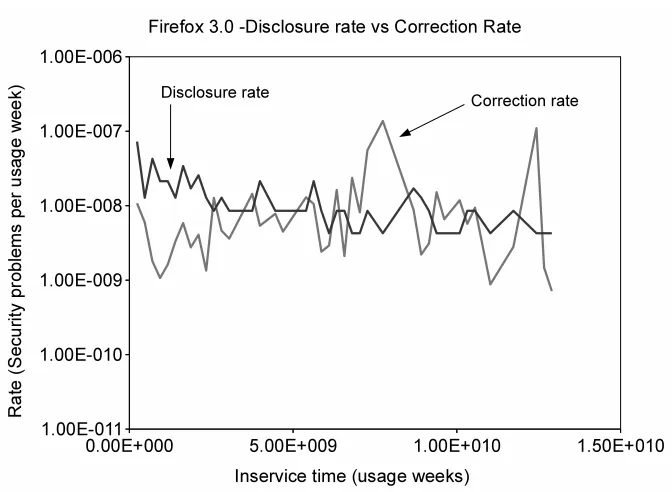
Figure 4.14 Firefox-3.0 disclosure Rate vs correction rate . . . 59
Figure 4.15 Firefox-3.5 disclosure rate vs correction rate . . . 60
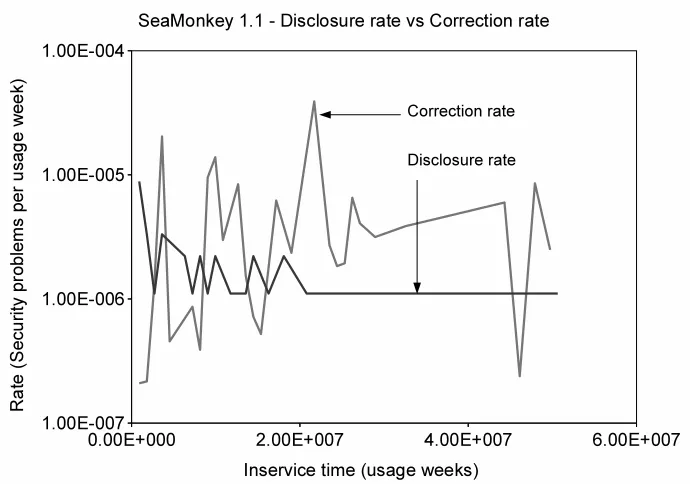
Figure 4.16 SeaMonkey-1.1 disclosure rate vs correction rate . . . 60
Figure 4.17 Bayesian model with variability in operational use . . . 61
Figure 4.18 Firefox-3.6 security problems . . . 64
Figure 5.1 Timeline view of the security model . . . 66
Figure 5.2 Full disclosure products - Time between discovery of security problems . 69 Figure 5.3 Limited disclosure products - Time between discovery of security problems 69 Figure 5.4 Full disclosure products - Disclosure of voluntary security problems . . . 70
Figure 5.5 Full disclosure products - Disclosure of involuntary security problems . . 70
Figure 5.6 Full disclosure products - Intrusion of voluntary security problems . . . . 71
Figure 5.7 Full disclosure products - Intrusion of involuntary security problems . . . 71
Figure 5.8 Limited disclosure products - Intrusion of voluntary security problems . . 72
Figure 5.11 Full disclosure products - Time to release security patches . . . 75
Figure 5.12 Active number of users daily . . . 76
Figure 5.13 Patching behavior . . . 76
Figure 5.14 Mann-Whitney U test for developer response . . . 77
Figure 5.15 Security failure propagation . . . 79
Figure 5.16 Mann-Whitney U test for security failures (case 1) . . . 80
Figure 5.17 Mann-Whitney U test for security failures (case 2) . . . 81
Figure 5.18 Mann-Whitney U test for security failures (case 3) . . . 82
Figure 5.19 Mann-Whitney U test for security failures (case 4) . . . 82
Figure 5.20 Impact of patching policies . . . 83
Figure 5.21 Impact of patching policies in Internet Explorer . . . 84
Figure 5.22 Mann-Whitney U test for early disclosure (18% users) . . . 85
Figure 5.23 Mann-Whitney U test for early disclosure (19% users) . . . 86
Figure 5.24 Mann-Whitney U test for early disclosure (20% users) . . . 86
Chapter 1
Introduction
1.1
Motivation and Problem
Security problems (or fault, or flaws), discovery and disclosure of such problems, failure of security problems in the field, and correction of such problems, are some of the important considerations in evaluating software quality. In analysing the operational security quality of software systems with large number of users, researchers often focus on security problem counts and frequencies independently of the operational profile of the software that harbors them [40, 4, 33, 65]. However, one may be able to see a different behavior when including usage metrics in to security analyses. For example, Figures 1.1 and 1.2 show the number of security faults disclosed for Firefox 3.0 per calendar unit time (e.g., weeks), and per software execution unit time or inservice unit time (e.g., inservice weeks [50], [32]) respectively.
It is interesting to observe that that the number of security problems disclosed per unit time remains approximately constant when viewed from the calendar perspective. An observation might be that the security quality of the software is probably not improving. On the other hand, when viewed from the usage perspective, an observation might be that the usage of the product is intensifying and yet we are not finding more problems over time, so perhaps things are getting better, and perhaps the impact of problems is smaller (e.g., less new problems per inservice hour) [32]. Thus, an operational view can be helpful and should to be taken into account explicitly when analysing the security profile of a software product.
Figure 1.1: Security problems disclosed vs calendar time
disclosures are not directly accompanied by instant repair of the problem in the form of a fix or a workaround by developers, end-user perceptions may be less favorable despite the fact that in actuality the probability that the product will fail due to a security breach may not have changed in a particular environment. When information such as software usage level, developer response process, user patching process, and attacker intrusion processes are (publicly) available, it is necessary to also consider these factors in security analyses. Therefore, in this work, we recognize roles and usage based metrics in analysing publicly disclosed security problems, as well as field usage levels of a product.
1.2
Solution Overview
There were four principal goals for the work described in this dissertation 1) develop an automa-tion framework to facilitate collecautoma-tion and collaautoma-tion of data on software security problems from public repositories, 2) develop and assess a state-based process model of the security problem discovery, disclosure, correction, exploit, failure, and patching, 3) develop security sub-models, as a part of the overall process model, to predict disclosure events of security problems, and 3) use empirical data and simulations with the overall process model to asses several practices for handling disclosure, correction and patching of security problems.
1.3
Summary of Contributions
The principal contributions and findings are:
• Data CollectionOne of the issues is the distributed nature of security data and difficul-ties in collecting that data [66]. A toolset for automated collection of linked information across public repositories was developed to address the issue [11]. The toolset has been effectively used as a part of the research reported here to collect information on both security and non-security problems for a broad range of software products [Chapter 2]. Investigations included different versions of products such as Firefox, Linux, SeaMonkey, Microsoft Internet Explorer, Windows XP, Adobe products, etc. Analysis of the collected data yielded some interesting results. For example,
– About 0.05% to 5% of the total number of problems reported are related to secu-rity [11]. This is consistent with what other researchers [4, 2, 55, 3] have reported.
correction tends to decrease as the product progresses in time, possibly indicating that product is getting better [Chapter 3].
– On the average, about 35% of the total security problems receive public exploits. Thirty-four percent (34%) of the total security problems receive exploits even before developers discover the problem and are disclosed as a result of an exploit, and only 1.3% of the problems receive public exploits after the security problem is publicly disclosed [9].
– Only about 0.05% to 2% of the total number of software security problems in a software result in field failures. This is a very small, albeit potentially dangerous number. Ninety-five percent (95%) of the field failures impact less than 50 systems (limited impact) and 3% of the field failures impact between 50 and 1000 systems (medium spread impact), and 2% of the field failures impact more than 1000 systems (broad spread impact). However, popular security threats during the past 10 years are known to have infected as many as 50,000 to 50 million users.
– A significant proportion of real software security problems (ranging from 30% to 80%) (so called “voluntary” problems) will fail in the field only when users interact with the attack mechanism [9]. This suggests that these failures could be avoided if users are alerted of such problems, i.e., a disclosure is made to users in a timely manner, and users take precautions. This is further evident from the study of popular security threats during the past 10 years, where 50% of the security threats involved voluntary security problems [Chapter 4].
– Fedora and Suse Linux distributions show positive results by resolving high and medium severity1 security problem reports without a backlog. On the other hand,
Ubuntu and Redhat Enterprise Linux distributions show backlogs in resolving high and medium severity security problem reports.
– In products that follow a process where full disclosure of security problems happen before fixes are available, the time taken to release patches for failed security prob-lems is about a week. In products that do not follow a process of full disclosure of security problems, the time taken to release patches for failed security problems ranges from a week to a month.
• Process Modeling. To analyse and understand collected information, we developed a security problem response model that describes the interactions of events associated with users, developers, attackers and security problems, and fixes. The model captures the
1
states through which a system may go based on the discovery and disclosure of security problems, exploits, field failures, type of problems, correction status (e.g., a developer fixes a security problem or not), etc. The model is quite comprehensive, and distinguishes itself from published models by emphasizing roles and usage perspectives [26, 15, 56].
• Predictive Modeling As part of the security problem response modeling, one would be interested in being able to predict things like time-to-problem-correction, mean-time-to-problem-disclosure, etc. If the process does not change, one might be able to use classical software and system reliability models. An assumption is that security problem behave in much the same way as non-security problems. Transfer of such models into security space is still at an early stage (e.g., [66, 4, 60, 55]). In [55, 60], researchers used classical software reliability models on security fault data, from a calendar time perspective, but without much success. An observation in this context is that classical reliability models work much better when the exposure is expressed not in calendar time, but in terms of system usage or inservice time (e.g., [50], [19]). This led to investigation of two security-oriented models for description and prediction of some of the transitions in our overall model. For example,
– Classical Reliability ModelsThis work finds that classical reliability models (such as Logarithmic Poisson Execution Time model [49]) can well predict problem rates per release and across software releases in the context of operational use of a sys-tem [8, 58, 9, 10].
– Bayesian Disclosure ModelIt is important to note that software security includes not only objective measures, but also subjective measures such as implied variability in the operational profile, influence of attacks, and subjective impressions of exposure and severity of the problems, etc. In order to reflect the uncertainty in the security behavior of a system as well as the uncertainty in our knowledge about the security behavior of a system, Bayesian approaches used in classical software reliability models were extended in this work to the security space. [12]. This work finds that a Bayesian disclosure model can predict the disclosure of security problems with respect to the operational use of a software at a performance level (relative error of 26%) at least on par with that of some other classical software reliability models.
• Analysis of Practices and Policies
events covered by the security model, and guide users and developers in making appropri-ate decisions, we used simulation in combination with real measurements. This yielded some interesting results. For example,
– The time-to-fix a security problem (measured from the discovery of a problem to the release of a patch) is shorter in “full disclosure” software products than “lim-ited disclosure” software products. Obviously, and perhaps not unexpectedly, “full disclosure” software products’ need and have quicker response to security problems than “limited disclosure” software products.
– “Full disclosure” software products that follow “automatic updates” will impact less number of systems with actual failures than “limited disclosure” software prod-ucts that follow non-automatic updates. Some examples of the former category are Mozilla Firefox and Google Chrome, and the latter category are Internet Explorer and Apple Safari.
– Using publicly available security related information for software products, users can estimate the optimal time to apply security patches when switching between products. For example, can a user of Internet Explorer with an average time-to-patch of 30 days, determine the optimal time to apply security patches after switching to Firefox and continue to be as secure as when using Internet Explorer? The model developed in this work suggests that a user should apply patches within 5 days of a patch release in Firefox in order to achieve this.
– Early disclosure/early waring of voluntary security problems may help users in taking precautions. Can a developer or a vendor decide under what conditions the policy of early disclosure of voluntary security problems is a good one? Perhaps developers may want to take this opportunity to allow additional time to fix a security problem. To do so, they need to know what percentage of the users must heed the warning to compensate for the additional impact due to the delay in fixing the security problem. For example, consider that a Firefox developer makes an early disclosure of 1 week before the “normal fix time”. To allow an additional time of 1 week to fix the security problem, there must be a high probability that at least 19% of users (as opposed to no users taking precautions in the 1 week slot) take precautions to achieve protection as the 1 week process.
1.4
Outline
Chapter 2
Empirical Analysis
2.1
Introduction
In order to analyse software security problems, we need to collect security related information like the number of security problems disclosed, , time-to-discovery, time-to-disclose, time-to-fix the security problems, software usage level in terms of the number of downloads or registrations or active users, time-to-intrusion, etc. We do this by developing a toolset that automatically retrieves such security related information from public repositories. We then analyse the col-lected data to understand various characteristics of security problems from the perspective of events related to users, developers and attackers.
2.2
Mining Security Data From Public Repositories
Mining software repositories is an important activity when analysing projects. Mining infor-mation across multiple data sources is one of the challenges [74, 28]. We observed that relevant information from one repository can complement the mining activity on another repository. For example, the Bugzilla bug tracker for Mozilla1 and Red Hat projects2 contain custom “keywords”, textual tags, that help identify specific categories of faults in the database. The keywordsecurity relates to a security bug3. This could have been used to identify the security faults in projects like Fedora4,Firefox5 etc. But the usage of the keyword was not consistent across bug reports. The Common Vulnerability Exposure6(CVE) site maintains information
about publicly known vulnerabilities. The vulnerabilities tagged by CVE are contained in the
1
https://bugzilla.mozilla.org/
2
https://bugzilla.redhat.com/
3
https://bugzilla.redhat.com/describekeywords.cgi
4
http://fedoraproject.org/
5
http://www.mozilla.com/en-US/firefox/
6
National Vulnerability Database7(NVD), a U.S. government repository devised to manage
vul-nerability data. The NVD database lists vulnerabilities specific to different types of products including Fedora (Red Hat), Firefox (Mozilla) etc. The external resource section of each vul-nerability listed in the NVD has a mapping or link to the faults in their respective bug-tracking system. This implies that information from the NVD can be utilised in mining security faults in projects likeFirefox,Fedora etc.
For projects, like Ubuntu, that deploy the Launchpad bug tracker, the search engine allows to search for faults with CVE tags. These CVE tags in turn can be used to collect linked vulnerability characteristics in terms of the nature of exploits, impacts, and their metric values present in the the NVD. Extracting such information would give additional context to informa-tion available through individual repositories. Manually extracting such informainforma-tion is tedious. In this Chapter we
• Discuss a framework that helps in automatically mining linked information across repos-itories.
• Discuss its implementation in the context of identifying security related information in projects that use the Bugzilla bug tracker by mining linked information from the NVD.
• Discuss its implementation in the context of mining security faults from repositories that deploy the Launchpad bug tracker along with related vulnerability information from the NVD.
• Discuss the use of the tool on theFedora,Ubuntu,Suse,RedHat, and Firefox projects.
2.2.1 Approach
Figure 2.1 shows an overview of our framework. It consists of: the exploratory study, the HTML downloader, and the HTML parser. we discuss the components in detail in the following sections.
Exploratory study
Exploratory study refers to the preliminary work done to identify the relation between the repos-itories under consideration and collect details required to extract data from the reposrepos-itories. The output of this study would be therepository relation identifier,URL patterns, and thedata formats.
We define a repository relation as an identifier obtained from one repository that would help in search of information in another repository. For example, the vulnerability summary provided
7
Figure 2.1: Framework
by the NVD contains a mapping or link to individual faults in the project’s bug repositories. Consider the vulnerability summary for theFirefox vulnerability CVE-2007-36568 in the NVD. The external source section of this summary has the link “https://bugzilla.mozilla.org/show -bug.cgi?id=387333” which maps to theFirefox bug repository. We call this mapping or link a repository relation. Also, the vulnerabilities listed in NVD have a unique CVE tag (eg.CVE-2007-3656) associated with each of them. We observed that bug repositories use this CVE tag either in the bug summary or the bug description section. This unique CVE id could also be used as a repository relation. Projects like Ubuntu quote the CVE tag in their bug reports. This may not be true for all projects. It is necessary to carefully examine the repositories, understand their usage of keywords or tags, and make sure the usage is consistent across bug reports.
URL patterns refer to the patterns observed in the HTTP or HTTPS requests used by the
8
search engines of the respective project’s bug tracker. In our implementation, the patterns are simple URL links observed in the address bar of the browser when one uses the search engines but without the parameter values. For example, consider the URL used by the search engine in the Redhat’s Bugzilla “https ://bugzilla.redhat.com/buglist.cgi? query f ormat =
advanced&classif ication = F edora&product= F edora&bug status= N EW”. This URL is used to list allNEW faults for theFedora product. Here theURL patternwould include the url but without the parameters Fedora and New. Parameters will be passed as arguments to the
HTML downloader based on the URL pattern and type of data or product required. We need to identify the URL pattern for generic search engine usage as well as for viewing individual sections in a bug report. The latter is required to extract information for each bug while the former is required to collect the list of all the faults in the bug repository using generic search requests. For example, “https: //bugzilla.redhat.com/show activity.cgi?id = ” refers to the
URL pattern to view the activity log of each bug report. As the bug ids are collected, thisURL pattern will be appended with the individual bug ids and executed to view their activity log.
Data formats refer to the formats in which the required data is stored in the repositories. In our implementation, we collected information in terms of calendar time when the bug was reported and fixed. For example, Redhat’s Bugzilla maintains the timing usingYear-month-day hour-minute-seconds format (Example: 2007-01-11 08:20:30). Vulnerability characteristics in NVD are storied in the format (AV: x /AC: x /Au: x /C: x /I: x /A: x), where the attribute AV is the access complexity, Au is the authentication complexity, C is the confidentiality impact, I is the integrity impact, A is the availability impact, and x is the respective attribute’s value.
HTML downloader and HTML parser
2.2.2 Implementation
Figures 2.3 and 2.2 show the implementation of our framework between the NVD and projects that deploy BUGZILLA and Launchpad bug trackers respectively. Figure 2 shows the imple-mentation where information from the NVD is used to identify security faults in the respective project’s bug repositories. Figure 2.3 shows the implementation where security faults are di-rectly mined from project bug repositories that deploy Launchpad bug tracker and then collect related vulnerability characteristics from the NVD.
In our first implementaion, a list of CVE ids for vulnerabilities specific to a project is given as input to theHTML downloader. TheHTML downloader retrieves the HTML data of the vul-nerability summary for each vulvul-nerability in the list using their CVE ids. In this case, each CVE id is appended to the URL pattern “http : //web.nvd.nist.gov/view/vuln/detail?vulnId= ” to retrieve the vulnerability summary. Then the HTML parser identifies the mapping or link to the bug repositories from the HTML output. Next, the HTML downloader uses the iden-tified links and retrieves the HTML data of the activity log section of each bug report in the respective bug repository. The activity log contains the timestamp when the bug was reported and fixed. Based on the data format in which the timestamps were stored, the HTML parser
identifies the date and time when each bug was reported and fixed. This implementation was evaluated on projects like Firefox and Fedora. We collected the timestamps for use in our published works [8, 58, 10, 9, 12].
In our second implementation, the HTML downloader automatically retrieves the list of faults from the bug repository using the URL pattern similar to the implementation that works on projects with Launchpad bug tracker. Launchpad bug tracker allows to search for faults tagged with CVE id. The CVE ids are displayed along with the bug ids when one uses the search engine. TheHTML parser parses this output and extracts the bug ids, and the CVE ids associated with them. Once the bug ids and CVE ids are extracted, the activity log data and the vulnerability characteristics were extracted by using theHTML downloader and theHTML parser in a similar fashion as in the first implementation. This implementation was evaluated on the Ubuntu project. It is possible to find more than one repository relation and retrieve data across repositories. In our implementations, we identified the relation as the mapping or links present in the NVD vulnerability summary. Since these links could be used directly by the HTML downloader, we considered such a repository relation. One could also search for CVE ids in the summary section of the faults, and there by identify security faults. In this case, the tool can be modified to collect the CVE ids from each of the faults and then retrieve the corresponding vulnerability information from the NVD. We have implemented this approach for Suse and RedHat projects.
9
Table 2.1: Tool statistics
Project Non-security Security Total Percentage
Fedora (1 - 8) 48077 908 48985 1.85
Ubuntu (4.10 - 8.10) 71408 1086 72494 1.49
OpenSuse (10.2 - 10.3) 8747 66 8813 0.75
SuseLinux (10.1 - 10.2) 6975 56 7031 0.80
Firefox (1 - 2) 8506 367 8139 4.30
RedHat Enterprise Linux (2.1 - 5) 22496 822 23318 3.52
2.2.3 Discussion
We collected time specific information for security faults from the individual bug repositories along with the data from the NVD. Table 2.1 shows the data collected in terms of the number of security and non-security faults for Fedora (releases 1 to 8), SuseLinux (releases 10.1, 10.2) OpenSuse (releases 10.2, 10.3), Ubuntu (releases 4.10 to 8.10), and RedHat Enterprise Linux (releases 2.1 to 5). From the table, we find that security faults account for roughly 0.5% to 5% of the total number of faults. This is consistent with the rates reported by other researchers [3, 2]. The security faults have been identified using the approaches explained in this paper. We have successfully used the tool in this work in collecting data for various analyses. We plan to make the tool open source software and release it on Sourceforge10.
2.3
Empirical Results
A much discussed issue is the disclosure of vulnerabilities. Information about vulnerabilities is either kept secret until the problem is resolved and is then released when a fix is available, or the information about vulnerabilities is made available before the problem has been resolved and a fix has been released. An argument in favor of non-disclosure is that releasing information about a security problem may increase the risk for end-users since it makes a larger number of potential hackers aware of it, and until a fix is available, this increases the exposure of end-users to danger. A counter-argument may be that disclosure of security problems helps alert
end-10
Figure 2.4: Trend test for non-security problems
users in taking precautions against exploits. In this section, we study various characteristics of the collected vulnerabilities.
2.3.1 Security vs Non-security Problems
Figure 2.5: Trend test for security problems
times. From the Figure, we observe a decrease in the inter-arrival times initially, i.e., increase in the number of non-security problems, and then the inter-arrival times continue to increase showing that the product is getting stable. But for security problem reports, we see that inter-arrival times appear to be relatively constant (Figure 2.5). Similarly the correction of non-security problems show a decreasing trend and security problems show no trend. The decreasing trend with non-security problems may imply that developers tend to fix problems faster as the next release approaches in order to resolve as many problems possible in the older release.
2.3.2 Voluntary and Involuntary Security Problems
One facet of how a security problem is exploited in the field is whether a user is deceived into interacting with the attack mechanism to get exploited (we call these voluntary failures). An example is a recent security alert from Adobe11. Adobe alerted of the presence of a critical
security problem in Adobe Reader and Acrobat, on May 1, 2009, even before releasing the fix
11
Table 2.2: Security problems from the NVD
Project Total Voluntary Percentage
Fedora 908 192 21.1
Firefox 2.0 225 76 33.8
SeaMonkey 177 78 44.1
Ubuntu 1105 244 22.1
RedHat 822 79 9.61
Thunderbird 165 61 37.0
OpenOffice 28 23 82.1
Suse 56 4 7.14
Apache Server 127 13 10.2
WindowsXP 440 126 28.6
IE 5.0 119 69 58.0
IE 6.0 352 115 32.7
Overall 4524 1070 23.7
on May 12, 2009. The alert says that when a user opens a malicious PDF file from untrusted source, the application would crash and the malicious PDF file can execute arbitrary code and take control of the affected system12. Adobe cautioned users from opening files from untrusted
sources, and provided tentative solutions in preventing applications from automatically open-ing PDF files. One thopen-ing to note is that a failure of this security problem is possible when users voluntarily interact with the attack mechanism by opening a malicious file. As already mentioned, we call such problems as “voluntary” security problems. On the other hand, we call the problems that do not require any voluntary interaction from users as “involuntary” security problems.
Information on whether a security problem requires user to voluntarily interact with an attack mechanism or not, is available in the National Vulnerability Database, a U.S. government repository devised to manage vulnerability data. Table 2.2 shows the total number of security problems along with the number of “voluntary” type security problems. On the average 24% of the security problems are of “voluntary” type. In projects like Suse Linux (7.14%), voluntary exposure may not be significant. But for projects like Firefox, Internet Explorer, SeaMonkey, etc., it is significant.
12
2.3.3 Security Exploits
We define “exploit” as the proof-of-concept code or a piece of source code that shows how one can practically turn the vulnerability in to a failure. A security problem exploit is either known or not. Security problems in the OSVDB contain details on whether a security problem has a public exploit (we call them “exploit known” problems), or not. The category of “exploit unknown” problems tells us that an exploit is not known for a security problem. However, it is possible that the security problem may have an exploit that is not publicly known and may or may not have been turned in to failures. Also, for the security problems in the OSVDB, there is no process to distinguish between a proof of concept code and an actual field failure. Security problems tagged with a public exploit known may indicate either a proof of concept code or an actual field failure. Nevertheless, we still are interested in observing the process of correcting security problems knowing that the problems have a public exploit either in the form of an exploit code or an actual failure. Table 2.3 shows the proportion of vulnerabilities with exploits known and unknown. From the table, we find that security problems with exploits known constitute about 35% of the security problems found in the OSVDB. Existing studies capture the process of correcting the overall set of security problems [8]. Since the security problems with exploits known constitute a significant fraction, it is worthwhile to study the process of correcting these problems.
Knowing that a security problem has a public exploit is likely to prompt the developers to fix problems faster. For example, consider the RedHat vulnerability #1272713 from OSVDB.
This problem was disclosed on Jan 06, 2005 and an exploit was disclosed on Feb 12, 2005. A problem report corresponding to this vulnerability is maintained in the RedHat’s bug database with the bug id #14409914. Soon after an exploit for the security problem was disclosed on Feb 12, 2005, the security response team closed the bug with a fix and issued a security update or patch on Feb 15, 2005. Although the developers may have been working on the problems, it appears that disclosure of a public exploit prompted the security response team in completing the correction activity and releasing the patch. In this paper, we study quantitatively how often security problems are disclosed, how many receive public exploits, and how quickly they are corrected. We distinguish the process of correcting such problems from that of the security problems for which an exploit is unknown.
Table 2.4 shows the data for security problems with public exploits - a) those problems where the exploit was reported first and the problem was disclosed immediately, b) those problems where the exploit was reported first, but the problem was disclosed after a certain period of time, and c) those that received a public exploit after disclosure of the security problem. We can observe that the proportion of security problems that received public exploits is about 35%
13
http://osvdb.org/show/osvdb/12727
14
Table 2.3: Data on exploits known/unknown
Category Number of Percentage
security problems
Exploit known 15508 35.48%
Exploit unknown 28202 64.52%
Total 43710 100.00%
Table 2.4: Voluntary/Involuntary Total number of security problems : 43710 (OSVDB)
Category Involuntary Voluntary
Exploit reported first and 13306 (30.4%) 1489 (3.4%) problem disclosed immediately
Exploit disclosed first 168 (0.4%) 20 (0.1%) and problem disclosed after a
certain time period
Exploit received after 463 (1.1%) 62 (0.2%) public disclosure of the
problem
Exploit known (total) 13937 (31.9%) 1571 (3.6%) Exploit unknown (total) 24166 (55.3%) 4036 (9.2%)
Total 38103 (87.2%) 5607 (12.8%)
(inclusive of voluntary and involuntary type security problems). About 65% (55.3% and 9.2%) of the security problems remain with exploit unknown. Compared to the proportion of security problems observed for individual projects in Table 2.4, the overall percentage of voluntary type security problems in the OSVDB database is about 12.8%. The data from OSVDB is a pool of security problems for a large number of products. While studying such a collection of security problems may give an overall picture, it is still necessary to study individual products in detail to obtain a self-consistent set of probabilities. Tables 2.5 shows the classification for Bugzilla product. Table 2.5 shows Bugzilla data along with the exploit details. From Table 2.5, we find that the proportion of Bugzilla product security problems exploited is about 27%. This is consistent with the rates reported by other researchers [1].
2.3.4 Security Failures
Table 2.5: Bugzilla security problems Total no of security problems : 107
Category Voluntary Involuntary
Exploit reported first and 0 (0%) 28 (26.17%) problem disclosed immediately
Exploit received after 0 (0%) 1 (0.93%) disclosure of the
problem
Exploit known (total) 0 (0%) 29 (27.1%) Exploit unknown (total) 9 (8.41%) 69 (64.49%)
Total 9 (8.41%) 98 (91.59%)
Table 2.6: Security failures
No Product Total number of Number of Percentage
security problems security problems failed
1 Windows XP 558 12 2.15%
2 Internet Explorer 113 4 3.54%
3 Firefox 418 2 0.48%
4 Acrobat Reader 156 7 4.49%
5 Dokuwiki 26 1 3.85%
6 OpenOffice 32 1 3.13%
7 Redhat Linux 213 2 0.94%
Average number of security problems failed 1.91%
the NVD for a few products and the number of security problems that were exploited in the field for each product. The data shown in the table represent entries in the NVD from January, 2007 to December, 2010. From the table, we observe that, on the average 2% of the total security problems reported for a product result in field failures.
Table 2.7 shows the data collected from Symatec15repository on security threats.
Informa-tion on security threats includes virus, worms, trojans, etc. In Table 2.7 a low impact security threat implies that the number of systems infected is in the range 0 to 49, a medium spread security threat implies that the number of systems infected is in the range 50 to 999 and a broad spread security threat implies that the number of systems infected is more than 1000. The database does not have further information on the broad spread security threats. But a study on some of the popular security threats reported during the last 10 years (Table 2.8 )
15
Table 2.7: Symantec information on security threats (2000-2010) No Security Threat Number of threats Percentage Number of systems
infected per threat
1 Low impact 7882 95% 0-49
2 Medium spread 270 3% 50-999
3 Broad Spread 137 2% 1000+
4 Total 8289 100%
Table 2.8: Broad spread security threats
No Threat Name Systems Infected Voluntary
1 Morris 6000 No
2 Melissa 1000000 Yes
3 ILOVEYOU 50000000 Yes
4 CodeRed 359000 No
5 SirCAM 2300000 No
6 KLEZ.H 391000 Yes
7 SQLSlammer 74855 No
8 SoBIG 1000000 Yes
9 MSBlaster 8000000-16000000 No
10 MyDoom 1000000 Yes
11 Sasser 200000-1000000 No
12 Storm 1600000 Yes
12 Conficker 8976038 No
13 Chernobyl CIH 700000-1000000 Yes
14 July 09 Cyber Attack 50000 No
revealed that broad spread security threats impacted about 50,000 to 50 million systems.
2.4
Case Study - Security Problems in Linux Distributions
they are corrected, etc. We study security problem reports from eight releases of Fedora16, nine
releases of Ubuntu17, four releases of RedHat Enterprise Linux (RHEL)18 and two releases of Suse Linux19distributions. We compute quantitative measures by extending software reliability
metrics like mean time to problem report, mean time to repair, system usage, rates, etc., to the security space. Using the measures, we analyse which of those security problem reports and how promptly they are corrected, and discuss the security of each of the projects.
2.4.1 Metrics
Figure 2.6 shows a sample window of three periods encompassing four problem reports. The problem reports are marked with the time when the problems were reported (Ri) and fixed(Fi).
In Figure 2.6, Xi gives the time to problem report (TTPR), the amount of time system is
operational without a problem being reported, Zi gives the time to problem exploit (TTPE),
the amount of time system is operational without a problem being exploited, and Yi gives
the time to problem correction (TTPC), the amount of time taken to fix a problem report. Following the empirical study, I discuss
Mean Time to Problem Report
Mean Time To Problem Report(MTTPR) is the mean or average of all times to problem report during a particular interval. This is analogous to mean-time-to-failures which is the average amount of time a system is operational without failures during a particular time intervial. In the period i-1, the Mean Time to Problem Report would be estimated as the average of X1 and X2.
Mean Time to Problem Exploit
Mean Time To Problem Exploit(MTTPE) is the mean or average of all TTPEs during a partic-ular interval. We define MTTPE as the average amount of time a system is operational without exploits during a particular time interval. In the period i, the MTTPE would be estimated as the average of Z2 and Z3.
Mean Time to Problem Correction
Mean Time To Problem Correction(MTTPC) is defined as the average of all times to problem correction (TTPC) during a particular interval. Once the problem is reported, on the average,
Figure 2.6: Problem report, exploit and correction time intervals
it might take that long to apply a fix and terminate exposure to that particular problem. For period i in Figure 2.6, Y2 and Y3 indicate the time spent to fix problem reports 3 and 4. The total correction time spent in the period i is given by the sum of time periods Y2 and Y3. The Mean Time to Problem Correction is given by the total correction time divided by the number of problems reported in a period. For period i, the Mean Time to Problem Correction is the total correction time divided by two (since only problems 3 and 4 were reported in that period). There is one thing to note, however. Once a problem is reported, its TTPC may be longer than the next window of interest. In that case, exposure to announced or open problems needs to include not only the problems found in that particular period, but also the ones found earlier and not yet resolved.
System Usage
Ideally, we would have liked to have the usage information for every system running a FEDORA release. Usage information like the total number of systems in operation during a given time, the total operation time as well as the downtime for each FEDORA release, etc. Due to the unavailability of such information, we focused on the download statistics maintained by FEDORA project. What is available in the database is the number of downloads and the number of registrations of the FEDORA product on weekly basis. We use this information to estimate the number of installations that might run FEDORA and from that make an estimate of an upper bound on inservice time.
reasonable estimate of the actual FEDORA usage20. Based on the download statistics, we can
calculate the inservice time i.e., product of the total number of systems and the time they have been operational. The FEDORA download statistics is only available from FEDORA release 6. Therefore our analyses were done on FEDORA releases 6, 7 and 8.
Calendar time or the operating time is defined as the cumulative sum of time after release of the software [50]. Inservice time refers to cumulative sum of the execution time of software [50, 19]. In our case, an upper bound on the inservice time can be estimated as
Inservice time(t) =
t
X
i=1
∆ti×ni (2.1)
∆ti=ti−ti−1 (2.2)
where ∆ti is time interval at i, andni is the total number of installations (registrations) in time
interval i. In our analysis, the inservice time has been calculated from the point the software was released until the time for which the usage statistics were available.
Rates
In our analysis, we estimate problem exposure rates, problem correction rates, and problem exploit rates. We define problem exposure rate as the number of unresolved or open problems a system has in the time period of interest. These problems can be hidden, or they may have been publicly disclosed. They can refer to any type of problem, or to security problems only. In our case, we focus on security problems that have been publicly disclosed but not yet fixed during a particular time period. Since an end-user is exposed to not only new problems disclosed during a particular time period, but also unresolved problems from the previous time period which could also potentially be exploited by any malicious user, we need to consider problems reported during the current time period as well as unresolved problems from the previous time periods. This is different from the problem report rate that identifies only the unique number of problems reported during a particular time periods. We call this as “problem disclosure rate”. We define problem correction rate as the number of security problems resolved in the time period of interest. We define problem exploit rate as the number of security problems that receive exploits (including exploits and actual failures in the field) in the time period of interest.
20
Table 2.9: Fedora Statistics
Statistics F 1 F 2 F 3 F 4 F 5 F 6 F 7 F 8 Security(P Rs) 31 128 82 154 201 194 92 26
Non-security(P Rns) 3141 4124 7528 7644 7805 7877 5468 4490
Total(P Rt) 3172 4206 7656 7798 8006 8071 5560 4516
% of (P Rs) 0.98 3.01 1.07 1.97 2.51 2.4 1.65 0.58
High 13 54 46 63 74 51 23 8
High (%) 42% 42% 56% 41% 37% 26% 25% 31%
Medium 15 62 26 73 93 113 60 16
Medium(%) 48% 48% 32% 47% 46% 58% 65% 62%
Low 3 12 10 18 34 30 9 2
Low(%) 10% 9% 12% 12% 17% 16% 10% 8% Downloads - - - 2864875 1920667 2152583 From - - - 10/24/06 04/23/07 11/08/07 To - - - 05/31/07 11/07/07 02/22/08
Problem exposure rates
Let the problem exposure rate [8] for publicly disclosed security problems (λd) in the time
interval i be estimated as,
λd =
((no)i+ (nf)i)
(ni×∆ti)
(2.3)
where (no)i represents the number of open problem reports from the previous week, (nf)i
represents number of problems reported in time interval ∆ti(e.g., given in minutes). Typically,
the number of users (ni) in time interval ∆ti is very large compared to the total number of
problem reports considered ((no)i+ (nf)i) [8]. It is worth noting again thatλdis different from
the inverse of the M T T P Ri. The latter reflects arrival time of unique problem reports in the
calendar time frame, while the former reflects the number of open reports with respect to the inservice time during time period i. We may wish to use λwhen discussing the quality of the system as a whole, and MTTPR in the context of calendar-based problem correction rate. In the event one is interested in computing the problem disclosure rate, then only the number of problems reported in time interval ∆ti, i.e., (nf)i needs to be considered.
Problem correction rates
µd=
1
M T T P Ci
(2.4)
Problem exploit rates
In practice, data such as the exploits, actual field failures, operational profile of the system, etc., are required to estimate system exploit rate accurately. Information about the actual field failures was not available in the case of Fedora and the number of problem reports does not tell how many failures are experienced by an end-user. However empirical results from [1] show on the average the proportion of publicly disclosed as well as undisclosed problems received exploits. We use this to estimate the exploit rates. We estimate exploit rates for publicly disclosed security problems using [58]. If we assume that Pe is the probability that a publicly
disclosed problem report received an exploit,
λd =
1
ni
×(nf)i+ (no)i
∆ti
×Pe (2.5)
λde = λd×Pe (2.6)
Where λde is an estimate of Fedora exploit rate for publicly disclosed problems. In our
illustration, we use Pe = 0.22 for the proportion publicly disclosed problems that received
exploits from [1]. Next, we present an empirical study of security problem reports from the Fedora, the Ubuntu, the RedHat Enterprise Linux (RHEL) and the Suse Linux distributions, analyse and discuss which type of security problem reports and how frequently they are reported, and how promptly they are corrected.
2.4.2 Data
Table 2.9 shows the number of problem reports and installations running more recent releases of Fedora. Information like the severity (high, medium or low) for each security problem were collected from the National Vulnerability Database21. Rows High,Medium,Low show the number of security problems under each category and their percentage in the total number of problemsP Rs. Tables 2.10, 2.11 and 2.12 show similar statistics for Ubuntu, RHEL and Suse.
We consider system usage to analyse security from the perspective of the system as a whole, i.e., usage of the total number of systems in operation during a particular time period, the total operation time as well as downtime for each linux installation, etc. We use inservice time [58] to approximate the system usage as a whole. We calculate the inservice time as the product of the total number of downloads or installations (ni) during a particular time period and the
time they have been operational [58]. We use week as the time period of interest. The Fedora
21
Table 2.10: Ubuntu Statistics
Statistics 4.10 5.04 5.10 6.04 6.10 7.04 7.10 8.04 8.10 Security(P Rs) 107 51 54 34 58 186 336 192 87
Non-security(P Rns) 4177 5145 11248 6947 9029 9482 12085 9876 3388
Total(P Rt) 4284 5196 11302 6981 9087 9668 12421 10068 3475
% of (P Rs) 2.50 0.98 0.48 0.49 0.64 1.92 2.71 1.91 2.57
High 47 23 24 16 22 52 134 70 19 High(%) 44% 45% 44% 47% 38% 28% 40% 36% 22% Medium 38 23 23 16 32 108 178 107 56 Medium(%) 36% 45% 43% 47% 55% 58% 53% 56% 64%
Low 22 5 7 2 4 26 24 15 12
Low(%) 20% 10% 13% 6% 7% 14% 7% 8% 14%
download statistics is only available from Fedora release 6 onwards. Therefore our analyses on Fedora as a whole have been done on releases 6, 7 and 8.
2.4.3 Numerical Results and Discussion
We illustrate the rates computed for Fedora 6, Ubuntu 8.04, RHEL 5, and Suse Linux 10.2 and discuss the results.
Fedora Security
We consider problem exposure rates from two perspectives. That of Fedora as a whole with
ni systems running during a particular week, and that of a particular system that may be
under attack. In the first case, there are ni systems running Fedora during a particular week.
Over these systems, a random Fedora user is exposed to (no)i+ (nf)i unique problems. This
includes the unique problems reported weekly and unique problems unresolved from previous week. Sinceni is very large (Table 2.9), the exposure rate of a random Fedora user to unique
Table 2.11: RedHat Enterprise Linux Statistics
Statistics RHEL 2.1 RHEL 3 RHEL 4 RHEL 5 Security (P Rs) 127 125 458 112
Non-security(P Rns) 1528 6400 7682 7708
Total(P Rt) 1655 6525 8140 7820
% of (P Rs) 7.6 1.9 5.6 1.4
High 20 (16%) 23 (18%) 155 (34%) 27 (24%) Medium 43 (34%) 51 (41%) 215 (47%) 66 (59%) low 64 (50%) 51 (41%) 88 (19%) 19 (17%)
From the perspective of an individual system identified and targeted, the exposure rate is about 10E-04 (4 problems per week, Table 2.13). The correction rate (Table 2.13) is smaller than the exposure rate of a system that may be under attack. For example, let us consider the problem exposure (λd) and correction rates (µd) for disclosed security problems. On an
average during a particular week, out of 4 problems, only half of them are corrected. This leaves the system exposed to approximately 2 additional problems per week. This implies a backlog in the overall problem resolution. Also, from Table 2.13, we can observe that the correction rate for high and medium severity problems is enough to keep up with the disclosed, but that of low severity problem reports is not. Resolution of such high and medium severity problems with no backlogs is a very good news for Fedora project. If one assumes that only about 22% of the disclosed problems receive exploits [1], the correction rate for high and medium severity problems is good enough to keep up with the exploitable (Table 2.13). Certainly, as an individual user who may not be typically singled out for an attack, one might feel comfortable knowing that there are nearly about 2 million systems operating per week and that chances of a random attack are relatively low. On the other hand, those that may be running high visbility sites, have a higher probability of being targetted. Even in such cases of being singled out, one may feel safe considering that correction rates for high and medium severity problems keep up with exposure rates.
Ubuntu Security
Table 2.12: SuseLinux Statistics
Statistics Suse 10.1 Suse 10.2 Security(P Rs) 19 37
Non-security(P Rns) 3104 3871
Total(P Rt) 3123 3908
% of (P Rs) 0.61 0.95
High 10(53%) 13(35%) Medium 5(26%) 19(51%) Low 4(21%) 5(14%)
the exploitable. On the average 33% (resulting from λd and µd in Table 5) of the exploitable
high severity problems and 40% of the exploitable medium severity problems reported per week remain unresolved.
Suse Security
The overall resolution rate for the disclosed security problems does not show presence of any backlog. High and medium severity problems keep up well with the disclosed problems. We can observe a backlog with the low severity problems which may not be significant.
RedHat Enterprise Linux Security
The overall resolution rate for the disclosed security problems as well as that of high and medium severity problems show presence of backlogs. On the average 20% (resulting from λd and µd
Table 2.13: Rates and Average values
Rates Fedora Fedora Ubuntu Suse RedHat
(whole) (Individual) (Individual) (Individual) (Individual)
Problem exposure rates in security problem reports/minute (per week)
λd 1.6E-09 3.6E-04 (4) 7.1E-04 (7) 8.2E-05 (1) 2.6E-04 (3)
λh 2.7E-10 1.1E-04 (1) 2.6E-04 (3) 3.7E-05 (0.4) 5.5E-05 (0.5)
λm 9.7E-10 1.8E-04 (2) 3.9E-04 (4) 3.7E-05 (0.4) 1.6E-04 (1.6)
λl 3.4E-10 6.1E-05 (0.6) 5.5E-05 (0.6) 1.2E-05 (0.1) 4.2E-05 (0.4)
Exploit rates in security problem reports that received exploits/minute (per week)
λde 3.5E-10 7.9E-05 (0.8) 1.6E-04 (2) 1.8E-05 (0.2) 5.7E-05 (0.6)
λhe 6.0E-11 2.5E-05 (0.3) 5.7E-05 (0.6) 8.2E-06 (0.1) 1.2E-05 (0.1)
λme 2.1E-10 4.0E-05 (0.4) 8.7E-05 (1) 8.2E-06 (0.1) 3.5E-05 (0.4)
λle 7.5E-11 1.3E-05 (0.1) 1.2E-05 (0.1) 2.7E-06 (0.03) 9.3E-06 (0.1)
Correction rates in security problem reports/minute (per week)
µd 1.9E-04 (2) 4.3E-05 (0.4) 1.2E-03 (12) 3.8E-05 (0.5)
µh 3.2E-04 (3) 3.7E-05 (0.4) 8.5E-004 (9) 3.5E-05 (0.4)
µm 2.0E-03 (20) 5.7E-005 (0.6) 6.5E-04 (7) 5.2E-05 (0.5)
Chapter 3
Security Problem Response Model
3.1
Introduction
To analyse and understand collected information, we developed a model that describes the interactions of events associated with users, developers, attackers and system security. The model is quite comprehensive, and distinguishes itself from published models by emphasizing role perspectives [26, 15, 56].
3.2
Model
In this section, we present a model based on our analysis of data on security problems in Chapter 2 (Section 2.3). The model captures the states through which a system may go based on the discovery of security problems by users, developers or attackers, type of security problems (characterized based on user involvement in the attack mechanism - voluntary or involuntary security problems), exploit status (an exploit for a security problem is known or unknown), failure status (an attacker exploits a security problem in the field failure or not), and their correction status (a developer fixes a security problem or not). The model describes the states generic for both voluntary and involuntary security problems. Figure 3.1 shows the security model. Self transition for each state is not shown for the sake of clarity. The security states are described as follows.
• goodrepresents the start state where the system may contain undisclosed and unknown security problems. A transition to the same state indicates that such problems, if present, remain with the exploit, failure and fix status unknown.
the security problem. A transition to the same state indicates that such problems are neither fixed by the developers nor exploited by the attackers. This occurs when the exploit published is not of enough severity to attract the attention of developers and attackers.
• fixed(ek)represents the state where a security problem disclosed in the form of an exploit is fixed by the developers. We use “fixed” to indicate not only the fix of a security problem by the developers, but also the release of the security patch to the users.
• failed(ek)represents the state where a security problem disclosed in the form of an exploit is exploited by attackers before developers fix the problem. Attackers take advantage of the public exploit code and causes field failures.
• failed(ekfx) represents the state where a security problem disclosed in the form of an exploit and fixed by developers is exploited by attackers before users apply the security patch. Attackers take advantage of the public exploit code and cause field failures.
• fixed(ekf )represents the state where a security problem disclosed in the form of an exploit and exploited by attackers is fixed by the developers.
• problem report (p) represents the state where developers discover a security problem first and disclose it in the form of a problem report.
• fixed(p) represents the state where a security problem disclosed in the form of a problem report is fixed by developers before attackers exploit the security problem in the field.
• failed(pfx)represents the state where a security problem disclosed in the form of a problem report and fixed by developers is exploited by attackers in the field before users apply the security patch.
• exploit(p) represents the state where an exploit for a security problem disclosed in the form of a problem report is publicly disclosed.
• fixed(pek)represents the state where a security problem disclosed in the form of a problem report and a public exploit for the problem is known, is fixed by the developers.
• failed(pekfx) represents the state where a security problem disclosed in the form of a problem report and a public exploit is known for the problem, and fixed by the developers, is exploited in the field before users apply the security patch.
• fixed(pekf ) represents the state where a security problem disclosed in the form of a prob-lem report and a public exploit is known for the probprob-lem, and exploited by attackers in the field before the security problem is fixed by developers, is now fixed by the developers.
• failed(seu) represents the state where a secret or hidden security problem is exploited by attackers before developers discover the problem.
• fixed(seu) represents the state where a secret or hidden security problem exploited by attackers is fixed by developers.
• patched represents the state where users apply the security patch released.
Next, we present an application of the security problem response model in describing the security problems from from Open Source Vulnerability Data Base.
3.3
Case Study - Security Problems from Open Source
Vulner-ability Data Base
In this section, we discuss the security model based on estimated rates from the OSVDB data. To be consistent with the data from the OSVDB, we present a reduced state space of the security model where an exploit would include both exploit code as well as failure of security problems in the field. In addition, we generate states for both voluntary and involuntary type of security problems. The states are described as follows.
• good or hidden represents the start state where the system may contain undisclosed and unknown problems. A transition to the same state indicates that such problems, if present, remain with the exploit and fix status unknown.
• disclosed(v) represents the disclosure of “voluntary” security problems with exploits unknown. The disclosure is primarily through means other than public exploits. For ex-ample, a vendor could identify the problems during testing. A transition to the same state indicates that such problems remain with the exploit and fix status unknown. Similarly disclosed(nv) represents the disclosure of “involuntary” security problems with exploit unknown. disclosed(sv) and disclosed(snv) represent the disclosure of ‘voluntary”, and “involuntary” security problems due to a public exploit.
Figure 3.2: Security model
• fixed(s)represents the system state where the security problems are fixed. From the data, we observed that for those problem reports that were fixed, the patch release occurred before the problem reports were updated in the bug tracking system as fixed. Hence the state fixed implies that the security problem is fixed and the patch has been released. For the transition to occur, the user must apply the patch.
Figure 3.3 shows the reduced state space model with transition rates. The basic assumption is that in the very small period dt not more than one transition takes place. The transition rates from one state to the other are as follows:
• λv (good/hiddentodisclosed(v)) - rate of disclosure of “voluntary” security problems. Similarlyλnv represents the disclosure of “involuntary” problems.
• λve (disclosed(v) toexploit(v)) - rate of exploit of disclosed “voluntary” security prob-lems. Similarly λnve , λsve, and λsnve represent the exploits of disclosed “involuntary”
security problems, hidden “voluntary” and “involuntary” security problems.
• λsved (exploit(sv) todisclosed(sv)) - rate of disclosure of “voluntary” security problems along with exploits. Similarly λsnved represents the disclosure of “involuntary” security
not subsequent exploits. Hence no transition to exploits from the states disclosed(sv)) and disclosed(snv)). This is because we are interested in observing the influence of the information that an exploit for a problem exists, on the process of correcting the problem. Not the failures.
• µvu (disclosed(v) tofixed) - rate of fix of disclosed “voluntary” security problems with exploit unknown. Similarlyµnvurepresent fixing of disclosed “involuntary” security
prob-lems with exploit unknown.
• µve (exploit(v)tofixed) - rate of fix of disclosed “voluntary” security problems with ex-ploit known. Similarlyµnve represents fixing of disclosed “involuntary” security problems
with exploit known, andµsve, andµsnverepresent fixing of “voluntary” and “involuntary”
security problems disclosed immediately along with exploits.
• µsved(disclosed(sv)tofixed) - rate of fix of disclosed “voluntary” security problems with exploit known. Similarly µsnved represent fixing of disclosed ‘involuntary” problems with
exploit known.
• µsf (goodtofixed) - rate of fix of security problems before being disclosed or exploit is
publicly known. Similar toµsve, andµsnve, we includeµsf for completeness of the model.
• µf ix (fixed togood) - rate of release of fixes for the security problems.
The rates λdv, λev, λg, λesv, λdsv, λesnv, λdsnv, λdnv ,λenv for the states {disclosed(v),
exploit(v), Good,exploit(sv),disclosed(sv),exploit(snv),disclosed(snv),disclosed(nv), andexploit(nv)
} represent transitions to the same state itself. We base our analysis on information such as the discovery date, disclosure date, exploit date, and fix date of security problems, project download statistics, etc. Using the data, we compute rates of disclosure, exploit, and correction of security problems with respect to inservice time as well as calendar time, and discuss how promptly problems with exploits known are resolved compared to those for which an exploit is still unknown.
3.3.1 Numerical Results and Discussion