Copyright to IJIRSET www.ijirset.com 12486
The Leaching Kinetics of Nitrate in Soil
Using Glass Column Method
Anuj Kumar Garg1, A. K. Gupta2*, Ashu Rani3*
Research scholar, Deptt. of Chemistry, SSV (PG) College, Hapur, (C.C.S.University, Meerut) U. P. India1
Associate Professor, Deptt. of Chemistry, SSV (PG) College, Hapur,(C.C.S.University, Meerut) U.P. India2
Professor, Department of Pure and Applied Chemistry,University of Kota, Rajasthan, India3
Abstract: The leaching kinetics of nitrate (NO3-) in agricultural (pH = 7.2) and non-agricultural soils (pH = 6.8) was studied
using undisturbed glass columns method . The soils were taken from the agriculture field and barren land near Dheerkhera agricultural area, Hapur. The Sodium nitrate (NaNO3) is used as a source of NO3-. Power form equations (LRobs = k1 [NO3- ]i2.91 for agricultural and (LRobs = k2 [NO3- ]i 1.829 for non-agricultural soils have been derived for dependence of LRobs on leachable concentration of NO3- present initially. The effects of pore volume, temperature, Ca hardness have been observed on leaching rate. Change in water filled porosity θ (cm3cm-3) of the column has been found to affect LRobs. The LRobs is found to increase with temperature in the range 30-50°C. Experimental data fitting on various kinetic models showed first order kinetic models and parabolic diffusion to be most suited for predicting leaching rates.
Keywords: Nitrate, adsorption, leaching, glass column, first order, pore volume, BTC.
I. INTRODUCTION
Nitrogen is both an essential nutrient and a large source of pollution on the terrestrial ecosystems. Due to an important component of plant nutrients, nitrogen plays an important role in increasing crops yields and its quality [1]. Hence the nitrogen in form of Nitrate, Ammonium, or Urea (which rapidly hydrolyses to ammonium) are used to increase the crops yields. In contrast to ammonium ions, NO-3 are not adsorbed by the negatively charged colloids that dominates most soils. Therefore nitrates ions can move downward freely with the drainage water and are thus readily leached from the soil. Such leaching losses will cause serious environmental problems [1].
Copyright to IJIRSET www.ijirset.com 12487 Studies conducted in different parts of the world have shown that farmers often use amount of N fertilizers that exceed the N requirement of crops. Nitrate is soluble and negatively charged and thus has a high mobility and potential for loss from the unsaturated zone by leaching [15],[16]. Many studies showed high correlation and association between agriculture and nitrate concentration in groundwater [17],[18],[19]. The extensive use of fertilizers is considered to be a main non-point source of the nitrate [20],[21],[22] and point sources of nitrogen such as septic systems are shown to contribute to nitrate pollution of groundwater [23]. Elevated nitrate concentrations in drinking water can cause Methemoglobinemia in infants and stomach cancer in adults [2],[18]. The US Environmental Protection Agency (US EPA) has established a maximum contaminant level of 10 mg/L NO3- N .As a significant quantity of nitrogenous fertilizer can be transported through preferential flow pathway in the soil [23], [20]. The downward movement of NO3- in agricultural and non-agricultural soils is studied using glass column method, The Effect of Ca hardness of extractant, irrigation water quality, water filled porosity of the soil, temperature and salt concentrations have been investigated on rate of leaching of nitrate ion in soil.
(II) RELATED WORK
Literature survey revealed that studies on kinetics of leaching of various chemicals [31,34] through soils and soil mineral are rare. Most of the desorption and leaching [32, 33, 37,38] studies of nitrate give only preliminary idea about the leaching. None of them reported utilization of initial rate kinetic method for studying leaching of chemicals on columns of natural soils with continuous or restricted flow in saturated and unsaturated conditions. The present investigation has been carried out to investigate the leaching kinetics of NaNO3, a highly soluble NO3- salt present in the agricultural field. Most of the studies conducted on NO3-leaching are from the regions where rainfall is abundant and well distributed [26] but studies under semi arid condition are scares.
(III) MATERIALS AND METHODS
Soil samples were collected from the agricultural fields of Dheerkhera area of Hapur where crops are grown and chemical fertilizers are continuously applied during the last ten years. Non-agricultural soil samples were collected from barren lands where crops are not grown and chemical fertilizers are not applied. Soil samples were collected by digging a deep pit. Samples were collected and placed in plastic bags and labeled according to their field. Soil samples were collected 2-3 times in a month at every site during the entire study period. These samples were dried and sieved. Table 1 gives physicochemical characteristics of the soil analyzed using standard methods [27].
The leaching kinetics of NaNO3 was studied by determining the nitrate concentrations in the leachates with time. Initial leaching rates (LRobs) have been calculated using plane mirror method [29]. Nitrate was estimated using standard spectrophotometric method [27]. In this method aliquot was evaporated to dryness over a hot water bath, and 2 mL of Phenol disulphonic acid was added to it and then 5 mL Ammonium hydroxide was added to develop colour and diluted to 100 mL with deionized water. The calibration curve was obtained at 410 nm using NO3- solution of different concentrations. The concentration (mg L-1) in leachates were converted to mg kg-1 in soil during kinetic work.
TABLE 1.
Some physicochemical characteristics of the soil
Properties Non-Agricultural soil Agricultural soil
pH 6.8 7.2
E.Ce (dS m-1) 0.67 0.242 Bulk density (g cm-3) 1.50 1.51
Colour Brown to dark brown Grayish black Sp. Gravity 2.57 2.71 Texture Clay-clay loam Clay loam
Copyright to IJIRSET www.ijirset.com 12488 Procedure of Leaching Studies
For studying leaching kinetics, specially designed graduated glass columns of 60 cm length and 3 cm diameter were prepared. They were surrounded by glass jacket for continuously flow of thermostatic water. To maintain the temperature constant of circulating water in glass jackets surrounding the glass column, manually fabricated thermostat with electronic relay, Beckman thermometer, mechanical stirrer and heating rod were used. 60 g soil with pH 6.8 and of known particle size (500 µ ≥ r) was gently packed at water filled porosity 0.34 cm3cm-3 for agriculture and 0.33 cm3 cm-3 for non agriculture soil. The pore volume ( Pv ) [28] was determined using equation (1).
Pv = q t / θV (1) where
q = volume of the effluent collected per unit time i.e. flow rate
θ = water filled porosity cm3 cm-3 = Volume of water ed by dry soil Total volume of soil column
V = total volume of the soil column
A fixed volume of aqueous salt solution (fertilizer) was added from the top of the soil column was allowed to get adsorbed uniformly in the column for 24 h .The column was then continuously leached with deionised water till the soluble anions were completely removed. During all the kinetic runs the column length, flow rate, pH of percolating water and temperature were also kept constant in all the experiments except during temperature variation studies. Effect of temperature, pore volume, Ca hardness of extractant water were studies only in non-agricultural soil columns. The results were found to be reproducible within ± 10%.
The treatment of data is based on the calculation of the following parameters as defined below:
[NO3-]s = Leachable nitrate present naturally in column soil
[NO3-]add = Nitrate concentration introduced in the soil column as soluble NaNO3
[NO3-]i = Total leachable content present initially.
[NO3-]t = Leached concentration at time ‘t’.
[NO3-]1 = [NO3-]i-[NO3-]t = Leachable concentration remaining at time ‘t’.
[NO3-]ads = [NO3-]s + [NO3-]ad – [NO3-]i
(IV) RESULTS AND DISCUSSION
A. Total Leachable Nitrate [NO3-]i
The soil itself has naturally leachable [NO3-]s in it. On adding NO3- from outside in the form of NaNO3 , concentration of leachable nitrate increases, with the increase in amount of added salt. It is clear from the result of table 2 and fig.1 that [NO3-]s i.e. (leachable nitrate present naturally in soil column) are higher in agricultural soil in comparison to non- agricultural soil.
CEC 46.01 28.8 OC (g kg-1) 6.5 6.84
Available N (kg ha-1) 232 216 Available P (kg ha-1)
17 21
Copyright to IJIRSET www.ijirset.com 12489 TABLE 2.
Variation in [NO3-]i and LRobswith [NO3-]addfor NaNO3leaching in agriculture and non agriculture soil at 300C
LRobs in mgkg-1s-1
0 50 100 150 200
0 20 40[NO3-]i60 80 100 120
[N
O3
- ]a
d
d
agricultural soil nonagricultural soil
Fig.1 Variation of [NO3-]i with [NO3-]add for NaNO3 addition at 30o C for agricultural and nonagricultural soil
B. Leaching of NaNO3
Leaching of NO3- ion was studied at different added concentration of NaNO3 on soil columns. Amount of NaNO3 was varied from 0 to 106.6 mg kg-1. The flow rate of percolating water was 10 ± 2 mL per 10 minutes. The results of NaNO3 leaching for variable [NO3-]i are given in table 2 for agriculture and non-agriculture soil. From the Figs. 2 and 3 it is clear that initial leaching is relatively fast for almost all the [NO3-]i in both types of soils. The LRobs values are found higher in agriculture soil in comparison to non-agriculture soil for similarly added NaNO3 .
Agricultural soil Non- agricultural soil
[NO3-]add [NO3-]i [NO3-]ads LRobs [NO3-]i [NO3-]ads LRobs
Copyright to IJIRSET www.ijirset.com 12490 .
Fig.2 Leaching rate profile for NaNO3 at different [NO3-]i at 300C for agriculture soil
0 20 40 60 80 100 120
0 500 1000 time,s 1500 2000 2500 3000
[N
O3 - ]1
30mg/kg 41mg/kg 50mg/kg 64mg/kg 74mg/kg 84mg/kg 101mg/kg
Fig.3 Leaching rate profile for NaNO3 leaching at different [NO3-]i for non-agricultural soil at 30 0C
C. Leaching Rate Profile & Dependence of LRobs on [NO3-]i
Initial rates for leaching, LRobs, represents the rate of change in leachable concentrations, [NO3-]1 with time. LRobs values were
0 20 40 60 80 100 120 140 160 180 200
0 500 1000 time,s1500 2000 2500 3000
84mg/kg 100mg/kg 110mg/kg 125mg/kg 145mg/kg
Copyright to IJIRSET www.ijirset.com 12491 obtained from the slope of the initial rate plot using the plane mirror method by Max Latshaw[29].It can be concluded from table 2 that with the increase of [NO3-]i , the LRobs is also increased. The log–log plot between the initial total leachable content [NO3-]i and the LRobs for agricultural and non agricultural soil indicated a fractional order of more than one i.e. 2.91 and 1.82 respectively given in table 3. The rate laws are given for NaNO3 for agricultural and non agricultural soil are
LRobs = k1 [NO3-]in For agricultural soil LRobs = k2 [NO3-]in For non-agricultural soil
TABLE- 3
The values of rate constant (k), order (n) and correlation parameters (r2) and SEE for leaching of NaNO
3 in agricultural and non-agricultural soil at 30 0C
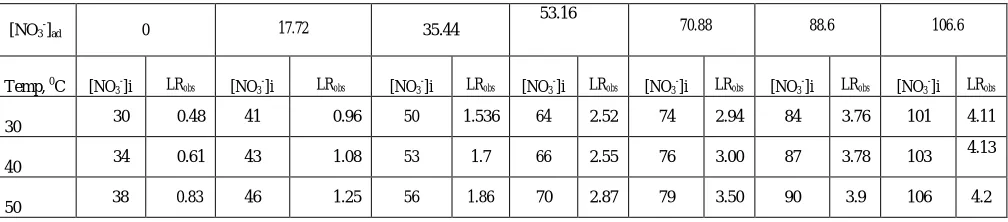
D. Effect of Temperature
The effect of temperature on [NO3-]i and LRobs was studied in the range 30-50 °C at different added [NO3-]ad. Results given in table 4 show that with increase in temperature, the solubility of adsorbed nitrate is increased, thus leaching is increased. Ref [36] has also given three effects of temperature on the reaction between inorganic phosphate and soil in which phosphate was present (a) in solution, (b) adsorbed in equilibrium with solution and (c) firmly held. In our experimental conditions, as the desorbed nitrate was continuously removed by the water from macro-pores through leaching, increase in temperature has increased solubility of firmly held or surfacial adsorbed nitrate remarkably, increasing equilibrium nitrate concentration in soil water giving higher LRobs and [NO3-]i values for added nitrate salts.
The effect of temperature on NaNO3 leaching was examined in detail only in non-agricultural soil by applying the Arrhenius equation i.e. k = Ae-Ea/RT on the rate constant data. A plot of log k vs. 1/T yielded a straight line . The slope of which gives activation energy Ea as 29.480 KJ mol-1.
TABLE 4.
Variation of LRobs with [NO3-]i at the different temp. for non-agricultural soil
E. Effects of Ca2+ Levels of Extractant H2O
Ca2+ Levelsof extractant was varied from 250-1000 mg L-1 by adding Ca 2+ in the form of CaCl2 . [NO3-]i and LRobs were found to decrease on increasing Ca2+level of extractant water. Results are given in table 5. Addition of Ca++ ions in the extractant water retarded the initial rate of nitrate leaching. If irrigation water is hard it may affect the NO3- leaching in two possible ways.
(1) It may change the ion-exchange capacity of the soil and (2) downwards movement of NO3- ion will be coupled with the hydrated Ca2+ . As the size of hydrated ions of Na+ is smaller in comparison to Ca+2 hydrated ions, the rate of
Parameters Agricultural Parameters Non-agricultural soil soil 103k1 0.406 102k2 0.108
n1 2.91 n2 1.829
r2
0.980 r2
0.975 SEE 0.120 SEE 0.0739
[NO3-]ad 0 17.72 35.44
53.16
70.88 88.6 106.6
Temp, 0C [NO3-]i LRobs [NO3-]i LRobs [NO3-]i LRobs [NO3-]i LRobs [NO3-]i LRobs [NO3-]i LRobs [NO3-]i LRobs
30 30 0.48 41 0.96 50 1.536 64 2.52 74 2.94 84 3.76 101 4.11 40 34 0.61 43 1.08 53 1.7 66 2.55 76 3.00 87 3.78 103
4.13
Copyright to IJIRSET www.ijirset.com 12492 leaching of NaNO3 will be retarded in presence of excessive Ca+2 ions.
TABLE 5.
Effect of change in Ca content of extractant H2O on NaNO3leaching at 30 °C
Ca++ (mg kg-1) [NO 3-]i
LRobs
added (mg kg-1) (mg kg-1 s-1)
0 50 1.536 250 45 1.35 500 38 1.20 1000 30 .980
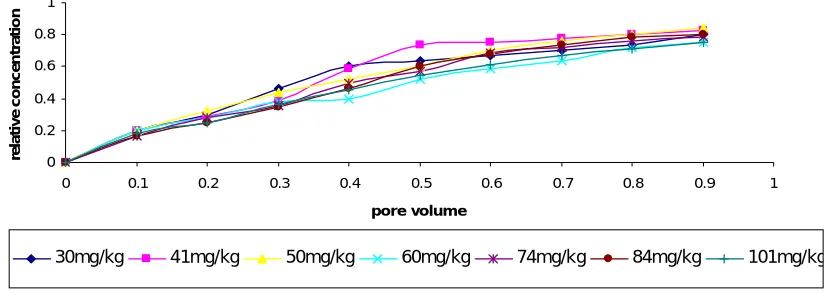
F. BTC of leaching
Breakthrough curves obtained in this study supports previous views [35] that in undisturbed naturally structured soil only partial displacement of resident water and solute by incoming water and solute occurs. Fig. 4 gives change in relative concentration
[NO3-]t / [NO3-]l with number of pore volume, which estimates change in the volume of soil water with time participating in solute transport .Ref [35] has reported that the pore volume of the effluent depends on the flow velocity and initial water
content θ of the soil column, but as in the present case, [13] has also studied the effect of θ on Mg leaching and showed that leaching of salt is accompanied by diffusion of adsorbed/desorbed salt in to the extractants volume present in the macroscopic
pores of the soil column. Higher is the adsorption, lesser will be the effect of θ on leaching rates as shown in fig. 4
0 0.2 0.4 0.6 0.8 1
0 0.1 0.2 0.3 0.4 0.5 0.6 0.7 0.8 0.9 1
pore volum e
re
la
ti
v
e
c
o
n
c
e
n
tr
a
ti
o
n
30mg/kg 41mg/kg 50mg/kg 60mg/kg 74mg/kg 84mg/kg 101mg/kg
Fig. 4 Variation in relative concentration and number of pore volume at different [NO3-]i at 30 0C
G. APPLICATION OF STUDY
Copyright to IJIRSET www.ijirset.com 12493 the manner that it includes initial leaching rates but not the initial amount of desorbable NO3-. This equation is more suited to present soil conditions. Besides, experimental results were also fitted to the previously explained conventional kinetic models. Average values of slope, r2 and SEE are given in table 6, for different concentration of [NO3-]i for the NO3- salts . It is clear from the table that first order equation (Fig. 5) and parabolic diffusion (Fig. 6) are most suitable to describe NO3- leaching.
Fig. 5 First Order equation profile for the NaNO3 leaching for non agricultural soil for different [NO3-]i at 300C
-20 -10 0 10 20 30 40 50 60 70 80 90
0 10 20 30 40 50 60
t 1/2
[N
O
3
- ]t
30mg/kg 41mg/kg 50mg/kg 60mg/kg 74mg/kg 84mg/kg 101mg/kg
Fig. 6 Parabolic equation profile for leaching of NaNO3 leaching at different [NO3-]i at 30 0C
0 0.5 1 1.5 2 2.5 3 3.5 4 4.5 5
0 500 1000 1500 2000 2500 3000
time,s
ln
[N
O3 -]1
Copyright to IJIRSET www.ijirset.com 12494 TABLE 6.
Coefficient of determination (r2), standard error of estimate (SEE) and slope for graphical equations of different kineticmodels applied
on NaNO3 leaching
Kinetic models—
> Zero order
First order
Parabolic diffusion
[NO3- ]i (mg kg-1) r2 SLOPE SEE r2 SLOPE SEE r2 SLOPE SEE
30
.88
-.0084
3.897 .928 -.0006
.154
.960 .515
1.30
41
.91
-.0127
3.866 .964 -.0007
.130
.943 .833
2.52
50
.945 -.0155
3.575 .972 -.0007
.110
.996 .741
.960
64
.966 -.0155
2.804 .966 -.015
2.804 .983 .985
1.56
74
.955 -.0217
4.530 .988 -.0006
.0625 .983 1.42
2.29
84
.963 -.0256
4.772 .987 -.0006
.0691 .979 1.71
3.097
101
.964 -.027
5.072 .998 -.0005
.0217 .992 1.79
1.97
(V) CONCLUSION
This study was conducted following a multidisciplinary approach to obtain data necessary for a better representation of NO3 -transport from the soil. It has been successfully represented the results of column study in the power form equation to represent nitrate leaching accurately. A fractional order of >1.5 and < 3.0 has been observed for leaching of NaNO3. Results of this study showed that leachable NO3- is higher in agriculture soil columns in comparison to non-agricultural soil columns while adsorbed NO3- concentration is higher in non-agricultural soil columns. Increasing the water filled porosity does not impart any significant change in [NO3-]i as well as on LRobs.
Several earlier studies [31], [33], [34] have given higher levels of nitrate in agricultural fields but relationship between rate of leaching with concentration of nitrate in soil were not reported in any study. This method can also be applied in the agricultural fields to know fertilizer requirement of plants as well as leaching rates below root zone.
REFERENCES
1. Brady N. C. “ Nitrogen and sulfur economy of soils.” In The Nature and Properties of Soils, 12th ed., eds N. C. Brady and R. R. Weil, pp. 492–522. Elsevier, New York.1998.
2. M. Jalali, “Nitrates leaching from agricultural land in Hamadan,” western Iran,Agric., Ecosyst. Environ. 110,210–218,2005 3. Goulding, K. “Nitrate leaching from arable and horticultural land.” Soil Use and Management 16:145-151,2000
4. Kross, B.C., Hallberg, G.R., Bruner, D.R., Cherry holmes, K. and Johnson, J.K. “The nitrate contamination of private well water in Iowa”. American
Journal of Public Health 83, 270-272,1993
5. Goss, M.J. and D. Goorahoo. “Nitrate contamination of groundwater: measurement and prediction”. Fertilizer Research42:331-338,1995
6. WANG Chao and WANG Pei-Fang“ Migration of Infiltrated NH4 and NO3 in a Soil and Groundwater System Simulated by a Soil Tank.” Pedosphere
18(5): 628–63,2008
7. Willfried, W., Manfred, T. and Uwe, P. “Prediction of the P leaching potential of arable soils in areas with high livestock densities.” Journal of Zhejiang
University Science B 7, 515-520,2006
8. Verma, S.K. and Gupta, R.K. “Leaching behaviour of saline clay soil under two modes of water application.” Journal of the Indian Society of Soil
Science 37, 803-808, 1989.
9. Ernani, P.R., Fingueiredo, O.R.A., Becegato V., Aloneido J.A. “Decrease of phosphorus retention in soil with increasing pH.” of Soil Science 20, 159-162, 1996.
10. Zhang, X.F., “Atmospheric nitrogen wet deposition and its effects on wetland water environment of Shanghai area.” Chinese Journal of Applied Ecology
Copyright to IJIRSET www.ijirset.com 12495
11. McLay, C.D.A., Dragten, R., Sparling, G., Selvarajah, N., “Predicting groundwater nitrate concentrations in a region of mixed agricultural land use: a comparison of three approaches” Environmental Pollution 115, 191–204,2001
12. Biggar JW, Nielsen DR “Miscible displacement and leaching phenomena.” Agronomy 11:254–274,1967
13. Selim, H.M., “Modelling the transport and retention of inorganic in soils.” Adv. Agron. 47, 331–384, 1992.
14. Rhoten, F.E., Shipitalo, M.J. and Lindbo, D.L. “Run-off and soil loss from Midwestern and South eastern US slit, loam soil as affected by tillage practice and soil organic matter content.” Soil and Tillage Research 66, 1-11, 2002.
15. Koopmans, G. F., W. J. Chardon, P. de Willigen, and W. H. van Riemsdijk. “Phosphorus desorption dynamics in soil and the link to dynamic concept of bioavailability.” J. Environ. Qual. 33:1393–1402, 2002b.
16. Mochoge B. and et Beese F. “Leaching of plant nutrients from an acid forest soil after nitrogen fertilizer application.” Plant Soil 91(1), 17–29, 1986. 17. Sharpley A N, McDowell R W, Peter J A K. “Amount,forms, and solubility of phosphorus in soils receiving manure.” Soil Science Society of America
Journal, 68,2048-2057,2004.
18. Wolfe, A.H., Patz, J.A., “Reactive nitrogen and human health:acute and long-term implications.” Ambio 31 (2), 120–125,2002
19. Refsgaard, J.C., Thorsen, M., Jensen, J.B., Kleeschulte, S., Hansen,S., “Large scale modeling of groundwater contamination from nitrate leaching.”
Journal of Hydrology 221, 117–140, 1999.
20. Goulding, K. “Nitrate leaching from arable and horticultural land.” Soil Use and Management 16:145-151, 2000. 21. Guo S L, Dang T H, Liu S Z, Hao M D. “Changes in characterization of phosphorus sorption in relation to its forms and soil organic carbon.” Plant Nutrition and Fertilizer Science, 11, 33-39, 2005.
22. Koopmans, G. F., W. J. Chardon, P. de Willigen, and W. H. van Riemsdijk. “Phosphorus desorption dynamics in soil and the link to dynamic concept of bioavailability.” J. Environ. Qual. 33:1393–1402, 2004b.
23. Kim, C.S., Sandretto, C., Hostetler, J., “Effects of farmer response to nitrogen fertilizer management practices on ground water quality.” Water Resources
Research 32 (5), 1411–1415, 1996.
24. Vinten, A.J.A., B.J. Vivian, F. Wright and R.S. Howard. “Comparative study of nitrate leaching from soils of differing textures under similar climatic and cropping conditions.” J. Hydrology 159: 197-213, 1994.
25. Haigh, Rosalyn A; White, R. E. “Nitrate leaching from a small, underdrained, grassland, clay catchment.” Soil use and management 2: 65-70, 1986. 26. Taddesse M., A.S. Claassens & P.C. de Jager . “Long-term kinetics of phosphate desorption from soil and its relationship with plant growth.” S. Afr. J.
Plant Soil, 25(3), 131-134,2008.
27. APHA.,. Standard methods for estimation of water and waste water (20th edn.) (American Public Health Association,Washington D.C.,2000).
28. Jury WA, Horton R . Soil physics, 6th edn. Wiley, New York, NY, 2004. 29. Latshaw M.A simple tangentimeter.J.Am.Chem.Soc.47;794-794,1925.
30. Marwan, M.M., Rowell, D.L., “Cation exchange, hydrolysis and clay movement during displacement of saline solutions from soils by water.” Irrigation
Science 16, 81–87, 1995.
31. Fang, Y.T., Gundersen, P., Mo, J.M., Zhu, W., “Nitrogen leaching in response to increased nitrogen inputs in subtropical monsoon forests in southern China.” Forest Ecology and Management 257, 332-342,2009a.
32. Wong, M.T.F., Hughes, R., Rowell, D.L., “Retarded leaching of nitrate in acid soils from the tropics: measurement of the effective anion exchange capacity”. Journal of Soil Science 41, 655–663, 1990.
33. Tesoriero, A., Liecscher, H., Cox, S., “Mechanism and rate of denitrification in an agricultural watershed: electron and mass balance along ground water flow paths.” Water Resources Research 36 (6), 1545–1559, 2000.
34. Mishra, B.K. and Mishra, C. “Kinetics of nitrification and nitrate reduction during leaching of ammonium nitrate through a limed ultisol profile.” Journal
of theIndian society of soil science39, 221-228,1991.
35. Delgado, A., and J. Torrent. “Comparison of soil extraction procedures for estimating phosphorus release potential of agricultural soils.” Commun. Soil
Sci. Plant Anal. 32:87–105,2001
36. Barrow, N.J. “The description of desorption of phosphate from soil.” Journal of Soil Science30, 259-270, 1979.
37. Miller J.J., B.J. Lamond, N.J. Sweetland and F.J. Larney. [2000]. Preferential leaching of water and chloride in a clay loam soil as affected by Tillage and Rainfall intensity. Water Qual. Res. J. Canada. 35(4); 711-734.
![Fig. 5 First Order equation profile for the NaNO3 leaching for non agricultural soil for different [NO3-]i at 300C](https://thumb-us.123doks.com/thumbv2/123dok_us/1692447.1214066/8.612.145.454.511.695/fig-order-equation-profile-nano-leaching-agricultural-different.webp)
