WINSLOW, BENJAMIN LEWIS. Relationships among Feed Utilization and Performance Traits in Developing Angus Heifers. (Under the direction of Gary R. Hansen and Joseph P. Cassady.)
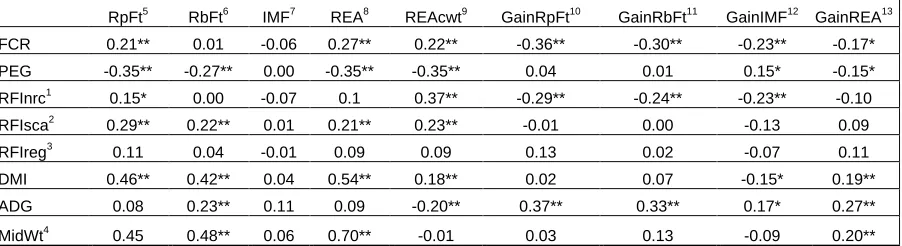
others). Efficiency traits were also phenotypically correlated with DMI (P < 0.01) (negative for PEG). A strong, negative phenotypic correlation (-0.67; P < 0.01) between FCR and ADG was observed, while RFIreg was, by design, phenotypically independent of ADG. Feed conversion ratio was also phenotypically correlated with MidWt (0.32; P < 0.01) and HipHt (0.15; P < 0.05). An efficiency trait’s phenotypic relationships with ultrasound traits
generally reflected its relationship with size. Measures of thyroid hormone T3 were
by
Benjamin Lewis Winslow
A thesis submitted to the Graduate Faculty of North Carolina State University
in partial fulfillment of the requirements for the degree of
Master of Science
Animal Science
Raleigh, North Carolina 2010
APPROVED BY:
______________________________ ______________________________ Dr. Alison A. Motsinger-Reif Dr. Matthew H. Poore
______________________________ Dr. C. Scott Whisnant
______________________________ ______________________________ Dr. Joseph P. Cassady Dr. Gary R. Hansen
ii
iii
iv
LIST OF TABLES ... …..vi
CHAPTER 1 – Literature Review………...1
Introduction………..2
Measures of Feed Utilization Efficiency………....2
Gross efficiency and Feed Conversion Ratio……….3
Maintenance efficiency………..4
Production efficiency (Cow/calf efficiency)………...………5
Partial efficiency of growth………...6
Residual feed intake………...6
Summary………8
Efficiency in the Mature Cow Herd………...9
Maintenance efficiency………..…....9
Production efficiency………...12
Summary………..……17
Residual Feed Intake of Growing Beef Cattle……...………..18
Test length………..………..18
Heritability of RFI………..……..18
Relationship of RFI with intake and other measures of feed utilization……….……….19
Relationship of RFI with growth rate and size………..…..22
Relationship of RFI with body composition and carcass traits……...25
Ultrasound fat measurements……….………..25
Ultrasound ribeye area……….………27
Carcass traits………28
Meat quality………...………..29
Relationship of RFI with behavioral traits………...….…..31
Feeding behavior………..31
Exit velocity and temperament score..…...………..33
Relationship of RFI in growing stage with RFI at maturity…………34
Relationship of RFI with dam productivity traits………...….35
Computing RFI from expected requirements……...………37
Physiological basis of RFI………...………39
Challenges and Opportunities of the Present and Future….. ... 40
Literature Cited……….………42
CHAPTER 2 – Relationships Among Feed Utilization and Performance Traits in Developing Angus Heifers……….51
Introduction………...……….52
Materials and Methods………..………55
v
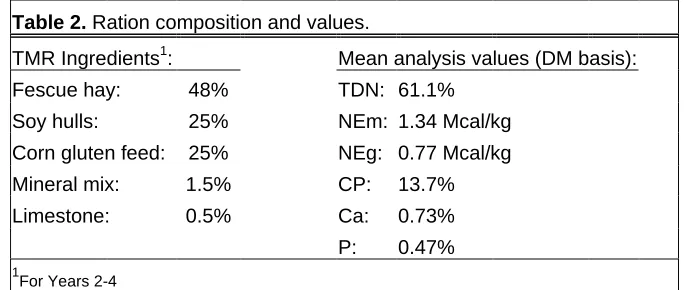
Diet ingredients and composition…….………...56
Data collection………...……..56
Description of Traits………..……….57
Efficiency and Performance……….57
Ultrasound body composition………..………59
Behavior………..……….59
Reproduction………..………..60
Endocrine……….………61
Statistical Analyses………..61
Phenotypic correlation……….………61
Heritability and genetic correlation………...……….62
RFI Groups………..62
Results and Discussion………..….63
Efficiency Traits………...63
Intake, Gain, and Size………..………64
Ultrasound Traits……….………66
Other Traits of Interest………66
vi
Table 1. Animal numbers and trait means with standard errors by year. ... 72
Table 2. Ration composition and values. ... 73
Table 3. Reproductive Tract Score criteria. ... 73
Table 4a. Partial phenotypic correlation coefficients, adjusted for year. ... 74
Table 4b. Partial phenotypic correlation coefficients, adjusted for year.……... ... 75
Table 5. Relationships among efficiency traits. ... 76
Table 6. Heritabilities of production and behavioral traits, and their genetic correlations with efficiency traits. ... 77
1
CHAPTER 1
2
Introduction
In the quest to enhance profitability, beef cattle breeders historically have tended to focus more on increasing output production (e.g., maximizing weight gain or carcass merit) than on reducing input costs (Arthur et al., 2001a; Herd et al., 2003). However, escalation of feed, fuel, and fertilizer prices has helped shift attention to cost reduction and efficiency improvement. Also, technological advances have enabled individual feed intake data to be collected much more conveniently and less expensively, making integration of intake data into breeding programs more feasible. With feed costs representing the largest single
expense in most beef production operations (Arthur et al., 2001a), improving feed utilization efficiency is clearly essential to lowering the overall cost of beef production. Breeders aiming to improve feed efficiency need to understand the various traits used to measure efficiency and relationships of these traits with other traits of economic significance.
Measures of Feed Utilization Efficiency
3
and numerous other traits. Nonetheless, each method of estimating feed efficiency is somewhat useful and can contribute toward efficiency improvement when implemented correctly.
Gross efficiency and Feed Conversion Ratio
Gross efficiency—or often its inverse, feed conversion ratio (FCR)—is the index of feed efficiency most widely reported in the literature and is defined as the ratio of production outputs to feed inputs (Archer et al., 1999). For beef production, the output is often
measured as weight change in growing cattle. Refining the production output to include only lean tissue gain is another option (Archer et al., 1999). Although gross efficiency is typically measured over a specific period of time, there are other bases for measurement that can help to eliminate the effects of scale or maturity pattern. Such alternatives include computing gross efficiency over a specified change in weight (i.e., from weight a to weight b) or on a maturity-constant basis (i.e., weight gain and feed measured as the animal matures from maturity stages a to b) (Archer et al., 1999). These procedures could reduce variation due to composition of gain and(or) to maintenance requirement differences (due to size variation), a major limitation of gross efficiency that had been recognized by Koch et al. (1963).
4
and many basic measures of production by livestock. For instance, with beef cattle, a review by Brelin and Brannang (1982) reported genetic correlations of -0.61 to -0.95 between growth rate and FCR. The general explanation for the relationship between this efficiency measure and production (growth rate, milk production, etc.) is that a higher proportion of the nutrients are being used for production—versus maintenance—at higher levels of production. The genetic correlations between gross efficiency and production traits are so strong, in fact, that Mrode et al. (1990), working with Hereford cattle, achieved a correlated response in FCR (-0.17 ± 0.07 kg feed/kg lean gain·year) in a line selected for lean growth rate which was greater than the direct response to selection (-0.14 ± 0.07 kg feed/kg lean gain·year) in the line selected on lean FCR. Results such as these provide strong support for the concept of improving gross efficiency without actually having to measure feed intake. However, as mentioned by Archer et al. (1999), cattle breeders aiming to improve overall efficiency through advancement (via either direct or indirect selection) in gross efficiency should be mindful of the likely correlated increase in mature size. The elevated costs associated with maintaining larger animals in the breeding herd at least partially offset the benefits of
improving gross efficiency. For this reason, Archer et al. (1999) suggest that—while greater gross efficiency is virtually always beneficial in growing-only settings such as feedlots—its contribution toward industry-wide efficiency is unclear.
Maintenance efficiency
5
requirement for maintenance is often reported as kilocalories (kcal) required per kg metabolic body weight (MBW; BW0.75). Archer et al. (1999) defined maintenance efficiency as the ratio of BW to feed intake at BW stasis. Accurate evaluation of maintenance requirements necessitates that the cattle be mature so that BW can be held constant (Archer et al., 1999). This stipulation translates into a large investment of time and other resources prior to determining an animal’s requirement. Fasting heat production (FHP) has been proposed as an alternative method of gauging maintenance requirement; however, there is not complete agreement as to the utility of FHP in that role (Koong et al., 1982; Shuey et al., 1993). Both maintenance efficiency and production efficiency will be discussed in more detail as
components of efficiency in the mature cow herd.
Production efficiency (Cow/calf efficiency)
Production efficiency (PE), sometimes termed cow/calf efficiency, typically involves measuring the feed intake of a cow and her progeny during one production cycle. This period is often defined as the 12 months from the weaning of the previous calf until weaning of the present calf, although some studies have also considered post-weaning feed
6 Partial efficiency of growth
The partial efficiency of growth (PEG) is the ratio of weight gain to feed intake— following the deduction of expected requirements for maintenance (Archer et al., 1999; Nkrumah et al., 2004). Maintenance requirement is often estimated either from table values (e.g., from NRC, 2000) and average body weight during the trial, or from a metabolic study considering energy balance of the animal (Archer et al., 1999). However, Archer et al. (1999) identified problems associated with each route. Standard values from feeding tables inherently imply no variation in the efficiency of feed use for maintenance (at a given BW). But, metabolic studies are generally not practical for large numbers of animals.
Residual feed intake
7
(Hennessy and Arthur, 2004; Nkrumah et al., 2004; Lancaster et al., 2009a).
When feed intake is predicted by phenotypic regression of intake on BW and
production—as is often the case—RFI is not phenotypically correlated with those traits used to predict intake. This could lead to the belief that selection on RFI would have no effect on BW or the other production traits [e.g., average daily gain (ADG)] used in the regression. However, as demonstrated by Kennedy et al. (1993), RFI—determined through phenotypic regression—is not necessarily genetically independent of production. Working with
heritabilities of 0.1, 0.3, or 0.5 for feed intake and production, and genetic and environmental correlations between these traits of 0.1, 0.5, or 0.9, they found the genetic correlation
between RFI and production to range from -0.90 to 0.87. The genetic correlation between RFI and production was most favorable when feed intake and production had a weak genetic correlation (generally unlikely), but a high environmental correlation. Calculating RFI as actual intake minus expected intake predicted by genotypic regression of intake on production would allow selection on RFI to be genetically independent of production (Kennedy et al., 1993). Selecting on the basis of genotypic RFI would effectively be selection on an index for feed intake, BW, and production, that has been restricted to hold BW and production genetically constant (Kennedy et al., 1993). Determining RFI by genotypic regression requires more complete knowledge of genetic and phenotypic parameters of the component traits, but may be necessary to control correlated responses.
8
constituent traits (intake, production) should be at least as accurate and effective as those including RFI. However, RFI may still have a role as an indicator of biological efficiency, especially when composition of body and growth is considered and all measurements are accurate (van der Werf, 2004).
Summary
There are several traits that may be used to gauge feed utilization efficiency. Each is accompanied by its own unique difficulties and benefits. They vary in their ease of
9
Efficiency in the Mature Cow Herd
Maintenance efficiency
Ferrell and Jenkins (1984) estimated that around 50% of the total (feed) energy consumed in beef production is used for maintenance of the cow herd. This conclusion was derived from the observations that between 65% and 75% of the energy for beef production is used by the cows (Gregory, 1972; Klosterman and Parker, 1976), and that roughly 70% of that energy is used for maintenance requirements of the cows. Dickerson (1978) reported that about 60% of the total life cycle energy intake per unit of edible beef protein is allocated to the breeding female. Understanding variation in maintenance requirements of the cow is a key step toward improving the overall efficiency of feed utilization in beef production. Mature size, breed, sex, environment, and physiological state are some of the factors that influence maintenance requirements (NRC, 2000). Cattle that differ in size or milk
production potential, as a result of successful selection for those traits, likely have different nutrient requirements and, also, different priorities in deposition and retrieval of body tissues (Solis et al., 1988).
Solis et al. (1988) examined maintenance requirements and energetic efficiency, using dry, non-pregnant, mature cows of three beef breeds (Angus, Hereford, Brahman) and two dairy breeds (Holstein, Jersey), and their crosses. Energy required for no change in BW was determined by the regression of daily weight change (g/kg0.75) against metabolizable energy (ME) intake (kcal/kg0.75). There were differences among breeds for ME (kcal/kg0.75) required for body weight maintenance. Angus and Brahman had lower (P < 0.05)
10
(P < 0.05) than Jersey. Additionally, Solis et al. (1988) estimated ME requirements for energy equilibrium and also energetic efficiency (retained energy (RE) / ME intake), by regression of daily RE on ME intake. Similar to requirements for BW maintenance, they found beef breeds to have significantly lower requirements for energy equilibrium and significantly greater energetic efficiency values.
The idea that breed types capable of higher milk production require more energy for maintenance than do types with less milk production potential has been supported by many additional studies (e.g., Garrett, 1971; Thompson et al., 1983; Tyrell et al., 1974). The work of McDonald and Nielsen (2006) showed that the concept also applies to mice. Montaño-Bermudez et al. (1990) investigated the BW maintenance requirements of cows of breeds similar in size but differing in milk production (Low (L) = Hereford X Angus; Medium (M) = Red Poll X Angus; High (H) = Milking Shorthorn X Angus). Adjusting for milk
production (measured by the weigh-suckle-weigh technique (Clutter and Nielsen, 1987), body condition, and BW change, they found the L group to have significantly lower ME requirements for maintenance (Montaño-Bermudez et al., 1990). Variation in milk
production explained 23% of the variation in maintenance requirements (Montaño-Bermudez et al., 1990). Additionally, after accounting for weight gain and its composition, Montaño-Bermudez et al. (1990) found lower maintenance requirements for L-group calves (versus M- and H-group calves) in a post-weaning, feedlot setting. Blaxter and Wainman (1966)
11
higher energy requirements for maintenance of BW or energy than types of lower milk production potential (Angus X Hereford crosses, and Charolais crossed with Angus or
Hereford). Additionally, Ferrell and Jenkins (1984) observed that maintenance requirements, when scaled for metabolic body size (i.e., kcal/MBW), did not differ between types which differed in size but were similar in milking potential.
Solis et al. (1988) identified differing body tissue priorities—including, for example, varying fat deposition patterns—as a potential partial explanation for the differences in requirements for dairy versus beef types. Regarding fat depot preferences, Kempster’s review (1981) presented the conclusion that dairy breeds deposit a greater proportion of total fat internally and a smaller proportion subcutaneously than do British beef breeds. In
agreement with this were the differences in fat deposition of L- versus M- and H-group steers reported by Montaño-Bermudez et al. (1990). Thompson et al. (1983) found that winter maintenance energy requirements (per MBW) tended to be lower for fatter Angus X
12 Production efficiency
Shuey et al. (1993) investigated the relationship between maintenance energy requirement (MEm) and production efficiency (PE) of Hereford X Angus first-calf heifers. A secondary objective of that study was to determine whether variation in maintenance requirements was due mainly to inherent metabolic rate (fasting heat production/MBW; FHP) or the partial efficiency of ME use for maintenance (Km; = FHP/MEm). Here, PE was defined as the weight of calf weaned, divided by the total ME consumed by the dam and as creep feed consumed by the calf, during a 12-month period in drylot. Additionally, intake of ME was adjusted for maternal BW gain. This was done to reduce bias due to the inability to meet requirements exactly, and NRC (1984) enabled the authors to estimate energy
requirements for observed maternal BW gain. These first-calf dams entered the calorimeter following the weaning of their calves.
Variation in MEm has to be attributable to FHP and Km, owing to the fact that it is a function of those two variables alone. FHP and Km explained 72.5 and 27.5% of the
variation in MEm, respectively (Shuey et al., 1993). This finding appeared contrary to the results obtained by Taylor et al. (1986). The conclusions of Shuey et al. (1993) did generally agree with Rompala et al. (1991), who found FHP mostly responsible for observed MEm trends in Targhee rams.
13
proposed that the nutrition level provided (which supported an average maternal BW gain of 0.24kg/d) could possibly have contributed to the weakness of the relationship between PE and the energy traits. Citing the suggestion by Ferrell and Jenkins (1985) that energy restriction would place higher-producing breed types at a disadvantage, Shuey et al. (1993) pointed out that their findings would support the tacit corollary that no advantage is gained by breed types (or, in their case, individuals within a breed type) with lower MEm when in an environment that is not nutritionally limiting. Shuey et al. (1993) also referenced the conclusion of Jenkins et al. (1991) that metabolic rate responds differently to intake in breeds with differing maintenance requirements, and suggested that the extrapolation of those findings in application to within-breed variation would agree with their own results. Ultimately, Shuey et al. (1993) concluded that selecting for lower MEm would be an ineffective strategy for improving PE, provided that nutrition is not limiting relative to requirements. If, as may be the case in a nutritionally harsh environment, selection on MEm were desired, FHP would be an appropriate indicator trait (Shuey et al., 1993).
14
15
higher intake levels (Jenkins and Ferrell, 1994). From their 1984 study, Ferrell and Jenkins suggested differences in PE among biological types. However, the estimated ME intake in their PE calculation was based upon an extrapolation (to 365 days) of the maintenance requirements determined in their study. They acknowledged the many other factors that can affect PE, such as ME required for pregnancy and lactation, non-milk ME intake by the calf, and any interactions among these variables (Ferrell and Jenkins, 1984).
One additional note regarding a possible relationship between dam milk production and PE concerns creep feeding. Calves had ad libitum access to creep feed in most of the PE studies reviewed here, and it would be reasonable to believe they consumed more energy than they likely would have from only pasture and milk. Although this intake was included in the PE calculations, it may have obfuscated the true relationship between milk production and PE in pasture-based, no-creep settings (Bowden, 1980; Brown and Dinkel, 1982;
Marshall et al., 1976).
Any breeder deciding to pursue increased milking ability should bear in mind the potential detrimental effects on reproduction resulting from a level of milk production that cannot be supported by the nutritional environment (e.g., Holloway et al., 1975a).
Reproductive efficiency is an extremely important component of overall beef production efficiency, and its impairment should be very carefully weighed against potential
improvement in weaned calf weight per unit energy consumed. Interestingly though, Marshall et al. (1976) found Charolais dams—which had the numerically lowest milk
16
(Marshall et al., 1976). Additionally, Freking and Marshall (1992) reported no influence of milk production on the rebreeding performance as 2-year-old first-calvers. Furthermore, Montaño-Bermudez and Nielsen (1990) concluded from their investigations with Low-, Medium-, and High-milk groups that “with adequate availability of feed sources for beef production in the midwest U.S. cows of medium size can vary widely in milk they provide to their calves and still have comparable reproductive performance.” However, care should be taken not to extrapolate any of these results beyond the range of milk production levels observed in these experiments. There should exist an optimal milk level for a given
environment, at which dam reproduction and calf growth would be most profitably balanced. A more accurate depiction of PE should extend beyond weaning and encompass the calves’ post-weaning performance and ultimate carcass merit. Holloway et al. (1975b) found Hereford dams generally (in some measures, significantly) to be more efficient converters of DE consumed by cow and calf into carcass GE or into retail cuts, compared with Holstein and Hereford X Holstein dams. Brown and Dinkel (1982) examined potential differences among Angus, Charolais, and reciprocal cross dams in energy requirements (estimated TDN intake) per unit weaning weight, slaughter weight, or retail product yield. Although there were significant differences between breed groups for cow weight, annual cow TDN, milk production, calf pre-weaning and post-weaning TDN, and retail cut yield, none were detected for feed energy requirements per unit weaning weight or per unit retail product yield.
17 Summary
With such a large portion of the total feed consumed in beef production being used by the breeding cow herd, improving efficiency in this segment of the production cycle certainly demands attention. Studies involving maintenance efficiency have demonstrated that
animals with greater milk production ability generally have increased maintenance
requirements as well. Along with variation in fat deposition, this may be because relatively larger viscera and other internal “machinery” required to support heavy lactation need nutrients for maintenance even during non-lactation. Production efficiency investigations point toward heavier-milking cows as being most efficient, in terms of weight of calf weaned with calf and dam intake considered. Maintenance requirement appears to have little bearing on PE, at least in environments where nutrition is not limiting. Seedstock selected on PE in very favorable environments may not perform as well under more adverse conditions. Milk production must be kept at appropriate levels that allow satisfactory reproductive
18
Residual Feed Intake of Growing Beef Cattle
Interest in RFI appears to be on the rise. It may be the trait’s alleged independence of growth rate and size that makes it an attractive measure of efficiency. A brief introduction to RFI has already been provided. The following is a closer look at RFI and its relationship with other traits.
Test length
Having analyzed records of growing heifers and bulls of British beef breeds, Archer et al. (1997) determined that a 35-day test was adequate for feed intake measurement. However, a 70-day test was deemed necessary for accurate assessment of growth rate (and consequently also for efficiency traits that depend upon growth rate—e.g., FCR and RFI), assuming that animals are weighed bi-weekly (Archer et al., 1997). Wang et al. (2006) suggested that a 63-day test would be sufficient for determining RFI, provided that animals were weighed weekly.
Heritability of RFI
19
reported h2 = 0.39 ± 0.04. Schenkel et al. (2004) found the heritability of RFI to be h2 = 0.38 in growing beef bulls. Data were obtained from bull test stations, with feed intake records available for 2,284 bulls of 6 breeds (888 sires) (Schenkel et al., 2004). From records of 1,481 steers and heifers (some Bos indicus-influenced), Robinson and Oddy (2004) reported RFI heritability of h2 = 0.21 ± 0.12. Nkrumah et al. (2007b), working with steers (n = 464) from Alberta Hybrid cows and sired by Angus, Charolais, or Alberta Hybrid bulls (28 sires), found h2 = 0.21 ± 0.12. Elzo et al. (2009), whose study included calves (n = 581) of Bos indicus breeding, reported an RFI heritability of h2 = 0.19 ± 0.11 in their population. Bouquet et al. (2010) found heritability of RFI to be h2 = 0.26 and h2 = 0.45 from their Blonde d’Aquitaine (n = 678) and Limousin (n = 708) bull records, respectively. Working with Brangus heifers (n = 468; 36 sires), Lancaster et al. (2009b) reported h2 = 0.47 ± 0.13. From records of Irish performance-tested beef bulls (n = 2,605), Crowley et al. (2010) estimated direct heritability of RFI to be h2 = 0.45 ± 0.06. After significantly improving model fit by considering maternal genetic variance, Crowley et al. (2010) reported h²D = 0.37
± 0.07 and h²M = 0.09 ± 0.04, with a correlation between direct and maternal components of r
= 0.82 ± 0.82. From records of 514 Japanese Black bulls, Hoque et al. (2009) found direct h2 = 0.51 ± 0.04. After including maternal effects, they reported h²D = 0.35 ± 0.05 and h²M =
0.24 ± 0.03, with direct-maternal correlation of r = 0.06 ± 0.03 (Hoque et al., 2009).
Relationship of RFI with intake and other measures of feed utilization
20
(2000) likewise observed correlations between RFI and intake (rp = 0.70 ± 0.02; rg = 0.64 ±
0.16). In 15-month-old Charolais bulls, Arthur et al. (2001b) also found RFI and intake to be significantly correlated (rp = 0.60 and rg = 0.79 ± 0.04). Elzo et al. (2009) also reported a
significant correlation of RFI with intake (rp = 0.89 ± 0.01 and rg = 0.73 ± 0.13). Nkrumah et
al. (2007b), too, found strong correlations between daily dry matter intake and RFI (rp = 0.64;
rg = 0.73 ± 0.18). Lancaster et al. (2009b) also reported very strong correlations between
intake and RFI in Brangus heifers (rp = 0.70; rg = 0.85 ± 0.08). Working with Japanese
Black (Wagyu) bulls, Hoque et al. (2006) found correlations between RFI and intake of rp =
0.72 and rg = 0.78 ± 0.06.
In Angus steers, Baker et al. (2006) found RFI to be positively phenotypically
correlated with FCR (r = 0.42). Herd and Bishop (2000), working with Hereford bull calves, reported FCR and RFI to be phenotypically and genetically correlated (rp = 0.61 ± 0.03; rg =
0.70 ± 0.22). Correlations with RFI were similar (rp = 0.63 ± 0.03; rg = 0.72 ± 0.18) when
Herd and Bishop (2000) analyzed lean feed conversion ratio (LFCR; feed intake / (weight gain X predicted carcass lean proportion)). Arthur et al. (2001a) found RFI and FCR to be correlated (rp = 0.53; rg = 0.66 ± 0.05). Having analyzed performance records of bulls of 6
beef breeds developed on central tests, Schenkel et al. (2004) reported phenotypic and genetic correlations between FCR and RFI of rp = 0.76 and rg = 0.69. When backfat was also
included in the multiple regression to predict feed intake (versus MetMW and ADG alone), this RFIb was similarly correlated with FCR (rp = 0.74; rg = 0.68) (Schenkel et al., 2004). In
growing Angus bulls, Lancaster et al. (2009a) found RFI and RFIc (for which gain in 12th-rib
21
correlated with FCR (r = 0.49 and r = 0.45, respectively). With Brangus heifers, Lancaster et al. (2009b) reported RFI and RFIc (here including gain in backfat and final LM area) to be
correlated with FCR (rp = 0.59 and rp = 0.56, respectively). They also reported very strong
genetic correlations of RFI and RFIc with FCR of rg = 0.93 ± 0.09 and rg = 0.94 ± 0.09,
respectively (Lancaster et al., 2009b). In crossbred cattle (predominantly steers but also a small proportion of bulls), Nkrumah et al. (2004) also observed a phenotypic correlation between FCR and RFI (r = 0.62). From a similar dataset, Nkrumah et al. (2007b) reported phenotypic and genetic relationships between RFI and FCR of rp = 0.52 and rg = 0.62 ± 0.09.
Arthur et al. (2001b) reported correlations of RFI with FCR (rp = 0.57; rg = 0.85 ± 0.05) in
Charolais bulls. Hoque et al. (2006) found strong correlations between RFI and FCR of rp =
0.76 and rg = 0.64 ± 0.10. Elzo et al. (2009) detected a phenotypic correlation between RFI
and FCR (rp = 0.55 ± 0.03), but surprisingly no significant genetic relationship between RFI
and FCR (rg = 0.09 ± 0.38). Bouquet et al. (2010) found genetic correlations of RFI and FCR
to be rg = 0.72 ± 0.22 and rg = 0.37 ± 0.25 in Blonde d’Aquitaine and Limousin bulls,
respectively. Crowley et al. (2010) reported correlations between RFI and FCR of rp = 0.41;
rg = 0.48 ± 0.10.
Lancaster et al. (2009a) calculated partial efficiency of growth (PEG) as the ratio of ADG to DMI used for growth. To compute DMI used for maintenance (which was
subsequently subtracted from total DMI to find that portion for growth), they multiplied MBW by 0.077 and then divided by the NEm concentration of the ration, as outlined by the
NRC (2000). They found PEG to be negatively phenotypically correlated with RFI (rp =
22
PEG this way, and also reported strong correlations of RFI with PEG (rp = -0.83; rg = -0.87 ±
0.06). Likewise, Hennessy and Arthur (2004) observed a phenotypic correlation of rp = -0.79
between PEG and RFI in Hereford steers and heifers. In Charolais bulls, Arthur et al. (2001b) also reported correlations between RFI and PEG (rp = -0.65; rg = -0.94 ± 0.02). The
strength of these relationships is not unexpected, considering that PEG and RFI each include ADG and maintenance requirement estimates in their measure of feed utilization efficiency (Nkrumah et al., 2004).
Herd and Bishop (2000) used allometric equations involving protein and fat accretion and assumed standard efficiencies for their deposition to calculate ME required for growth (DEP). Correlations between RFI and DEP were statistically non-significant (rp = 0.06 ±
0.04; rg = 0.27 ± 0.30). Herd and Bishop (2000) also defined maintenance energy
expenditure (MAINT) as the difference between ME intake and calculated DEP. MAINT and RFI were correlated (rp = 0.78 ± 0.02; rg = 0.77 ± 0.13). Correlations with RFI were
even stronger when maintenance energy expenditure was expressed on MBW basis (MMBW; MAINT/MBW) (rp = 0.91 ± 0.01; rg = 0.93 ± 0.06).
Relationship of RFI with growth rate and size
As indicated previously, RFI would not be correlated with traits used in the regression to predict intake. In many studies, intake has been predicted by phenotypic multiple
regression on MetMW and ADG; therefore, the absence of phenotypic association between RFI and these traits is commonly reported and will not be noted here.
23
performance (BW, ADG) between groups, with low-RFI animals eating less (Richardson et al., 2001; Nkrumah et al., 2004; Castro Bulle et al., 2007; Bingham et al., 2009; Lancaster et al., 2009a; Lancaster et al., 2009b; Crowley et al., 2010). However, Elzo et al. (2009), working with steers, heifers, and bulls that were Angus, Brahman, and crosses (varying proportions) of these breeds, found their high-RFI group (calf RFI > mean RFI + 0.5 SD) actually to show a significantly greater post-weaning gain than the low-RFI group (calf RFI < mean RFI - 0.5 SD). As would be expected, the high-RFI group also consumed significantly more DM to achieve their gains (Elzo et al., 2009). This finding may be related to that fact that the low-RFI group contained significantly more influence from Brahman, which in that study exhibited significantly lower RFI but also significantly lower post-weaning gain.
Nkrumah et al. (2004) found RFI to be phenotypically independent of both relative growth rate (RGR; growth relative to instantaneous body size) and Kleiber ratio (ADG / MetMW). Hennessy and Arthur (2004) also observed RFI to be phenotypically independent of RGR and Kleiber ratio, as did Arthur et al. (2001b) in Charolais bulls. These findings are not surprising, given the inclusion of gain rate (ADG) and size (MetMW) in the DMI
prediction equation for RFI. However, Arthur et al. (2001b) also reported significant negative genetic correlations of RFI with RGR (rg = -0.56 ± 0.12) and Kleiber ratio (rg =
-0.40 ± 0.13). Crowley et al. (2010) found RFI to be phenotypically independent of RGR and Kleiber ratio. The genetic correlations of RFI with RGR and Kleiber ratio were positive, but not significantly different from zero (rg = 0.21 ± 0.12 and rg = 0.15 ± 0.13, respectively)
(Crowley et al., 2010).
24
relationship between RFI and ADG in their Angus population (rg = -0.04 ± 0.08). They did
observe genetic correlations of RFI with direct effects for 200-d weight (rg = -0.45 ± 0.17)
and 400-d weight (rg = -0.26 ± 0.13) (Arthur et al., 2001a). Herd and Bishop (2000) also
reported RFI to be genetically independent of ADG (rg = 0.09 ± 0.29). While still not
statistically different from zero, genetic correlations of RFI with 200-d weight (rg = 0.34 ±
0.34), 400-d weight (rg = 0.15 ± 0.28), and MetMW (rg = 0.22 ± 0.29) were relatively greater
(Herd and Bishop, 2000). Similarly, Lancaster et al. (2009b) observed no genetic correlation between RFI and ADG (rg = 0.04 ± 0.32), but reported a larger—yet still not significant—
correlation of RFI with MetMW (rg = 0.33 ± 0.29). In Charolais bulls, Arthur et al. (2001b)
observed a positive genetic correlation of RFI with liveweight (rg = 0.32 ± 0.10), while RFI’s
genetic relationship with ADG failed to reach significance. (rg = -0.10 ± 0.13). With Irish
beef bulls, Crowley et al. (2010) also reported genetic independence between RFI and ADG. The genetic correlation between RFI and MetMW was negative (rg = -0.17 ± 0.09) (Crowley
et al., 2010). In growing dairy bulls, Jensen et al. (1992) also found the genetic correlation between RFI and ADG to be statistically non-significant. Schenkel et al. (2004) found no significant genetic correlations between ADG and RFI or RFIb in young beef bulls. Robinson
and Oddy (2004) also reported no significant genetic correlations of RFI with ADG or weight. Genetic correlations of RFI with ADG (0.25 ± 0.16) and MetMW (0.16 ± 0.13) reported by Hoque et al. (2006) were not significantly different from zero. Herd and Bishop (2000) found lean growth rate (LGR; growth rate to 400 d X predicted carcass lean content) to be phenotypically and genetically correlated with RFI (rp = -0.33 ± 0.04; rg = -0.47 ± 0.17).
25
correlated (rg = -0.40 ± 0.21) in Blonde d’Aquitaine bulls. However, that association was not
significant in their Limousin population (rg = -0.07 ± 0.14) (Bouquet et al., 2010). Elzo et al.
(2009), with Angus, Brahman, and crosses as described previously, reported a genetic
correlation between RFI and post-weaning gain (i.e., ADG) of rg = 0.58 ± 0.28. That finding
would not be favorable for an industry that desires both rapid weight gain and efficiency (as measured by RFI).
Schenkel et al. (2004) reported no significant correlations of RFI or RFIb with hip
height of bulls, measured at completion of centralized performance tests. Nkrumah et al. (2004) similarly found RFI to be independent of hip height in hybrid steers and bulls. Basarab et al. (2003) also observed no significant phenotypic correlation of RFI with hip height or with gain in hip height in crossbred beef steers.
Herd and Bishop (2000) also analyzed the relationships of performance and efficiency traits of progeny with the mature size of their dams. Weight (COWWT) was recorded for each dam at an age of approximately 4.5 years. RFI of the progeny was determined to be genetically independent of COWWT (rg = -0.09 ± 0.26).
Relationship of RFI with body composition and carcass traits Ultrasound fat measurements
26
the α = 0.05 level. When they included RpFt in the intake model, the phenotypic and genetic
correlations of RFIb with RpFt, each fell, understandably, to -0.01 (Schenkel et al., 2004).
Lancaster et al. (2009a) observed phenotypic correlations of RFI with gain in RpFt (rp =
0.30) and with final RpFt (rp = 0.20). Nkrumah et al. (2004) also found RFI to be
phenotypically correlated with RpFt (rp = 0.19) and with gain in RpFt during the test period
(rp = 0.30). Basarab et al. (2003) reported a phenotypic relationship of RFI with RpFt
approaching significance (rp = 0.15; P = 0.07), as well as a significant correlation of RFI with
gain in RpFt (rp = 0.22). In Brangus heifers, Lancaster et al. (2009b) found RFI to be
significantly phenotypically correlated with final RpFt (rp = 0.12), as well as gain in RpFt (rp
= 0.22). They also reported a genetic correlation between RFI and final RpFt of rg = 0.36 ±
0.26 (Lancaster et al., 2009b). In Angus cattle, Arthur et al. (2001a) found RFI to be
correlated with ultrasound rib fat (RbFt) (rp= 0.14; rg = 0.17 ± 0.05). The association of RFI
with RpFt at the P8 site did not reach significance in that study (rp = 0.11; rg = 0.06 ± 0.06)
(Arthur et al., 2001a). Robinson and Oddy (2004) reported strong correlations of RFI with RbFt (rg = 0.48 ± 0.12) and P8 RpFt (rg = 0.72 ± 0.17). When these ultrasound fat
measurements were adjusted to a constant carcass weight—rather than age—the correlations rose to rg = 0.58 ± 0.14 and rg = 0.79 ± 0.16, respectively (Robinson and Oddy, 2004). Herd
and Bishop (2000) predicted lean carcass content (LEAN) from RpFt measurements. They reported phenotypic and genetic correlations of RFI with LEAN of rp = -0.22 ± 0.04 and rg =
-0.43 ± 0.23. In Angus steer progeny from lines divergently selected for RFI (single
27
rump site. Nor was there a significant difference between groups (Richardson et al., 2001). Schenkel et al. (2004) found no significant correlations between ultrasound estimate of intramuscular fat percentage (uIMF) and either RFI or RFIb in bulls. Lancaster et al.
(2009a) likewise reported no significant phenotypic correlations of either RFI or RFIc with
either uIMF or gain in uIMF during the trial. Nkrumah et al. (2004) also observed RFI to be independent of ultrasound-based marbling score in crossbred steers and bulls. While Basarab et al. (2003) found no significant phenotypic relationship of RFI with either initial or final ultrasound marbling score, RFI was significantly correlated with gain in ultrasound marbling score (rp = 0.22). Lancaster et al. (2009b) found no significant correlations—phenotypic or
genetic—of RFI or RFIc with final uIMF, or with gain in uIMF. Richardson et al. (2001) did not find a significant correlation between uIMF and sire’s EBV for RFI.
Ultrasound ribeye area
Baker et al. (2006) found no significant phenotypic correlations between RFI and ultrasound measurements of ribeye (longissimus dorsi) area (REA), collected at both the beginning and completion of the 70-day test. Schenkel et al. (2004) reported no significant correlations of REA with RFI or RFIb in growing beef bulls. Nkrumah et al. (2004) reported
no significant relationship between RFI and REA. Basarab et al. (2003) also found RFI to be phenotypically independent of both REA and gain in REA. Lancaster et al. (2009a) observed a significant phenotypic correlation of RFI with gain in REA (rp = 0.17), but not with final
REA (rp = 0.09). Working with Angus bulls and heifers, Arthur et al. (2001a) found the
28
heifers, Lancaster et al. (2009b) reported phenotypic correlations of RFI with final REA or gain in REA to be non-significant. The genetic correlation of RFI with final REA was also near zero, while RFI and gain in REA showed a much stronger genetic relationship (rg = 0.55
± 0.24) (Lancaster et al., 2009b). Robinson and Oddy (2004) reported a significant, positive phenotypic correlation between RFI and REA (rp = 0.17), while the genetic correlation (rg =
-0.24 ± 0.26) was negative but not significantly different from zero.
Carcass traits
With carcasses from Angus steers classified as high (> 0.5 SD above mean), medium (± 0.5 SD from mean), or low (< 0.5 SD below mean) RFI, Baker et al. (2006) detected no differences among RFI groups for hot carcass weight. Nkrumah et al. (2004) also observed RFI to be phenotypically independent of cold carcass weight in crossbred steers. Basarab et al. (2003) also did not observe a significant phenotypic correlation between RFI and carcass weight.
Baker et al. (2006) found no significant differences among RFI groups for backfat thickness; kidney, pelvic, and heart fat (KPH); or USDA Yield Grade. In crossbred beef steers, Mader et al. (2009) reported phenotypic correlations of RFI (rp = 0.34) and RFIb (rp =
0.29) with trim and kidney fat weight proportion, but not with any other fat-related traits in their study. Nkrumah et al. (2004) observed phenotypic correlations of RFI with carcass grade fat (rp = 0.25), Canadian yield grade (rp = 0.28), and lean meat yield (rp = -0.22). From
29
terms (g/d) (rp = 0.26) or relative to MBW (g/kg MBW/d) (rp = 0.30). They also reported a
phenotypic correlation between RFI and dissectible carcass lean (rp = -0.21). Additionally,
Basarab et al. (2003) observed that RFI tended to be positively associated with dissectible carcass fat (rp = 0.14; P < 0.09).
Baker et al. (2006) did not find differences among RFI groups for marbling score or for USDA Quality Grade. Nkrumah et al. (2004) similarly found no significant phenotypic correlation between RFI and carcass marbling score in crossbred steers. Basarab et al. (2003) reported that RFI trended toward association with carcass marbling (rp = 0.15; P = 0.07).
Robinson and Oddy (2004) observed a relatively weak but significant phenotypic correlation (rp = 0.11) between RFI and carcass percentage intramuscular fat, while the genetic
correlation (rg = 0.22 ± 0.17) was not different from zero.
Nkrumah et al. (2004) reported no significant phenotypic correlation between RFI and carcass ribeye area. Basarab et al. (2003) also found RFI to be phenotypically
independent of carcass ribeye area. Baker et al. (2006) observed no significant differences among RFI groups for carcass ribeye area.
Meat quality
30
steaks with significantly greater b* values, compared with those from medium- and low-RFI steers. Calpastatin activity did not differ between high- and low-RFI groups (medium-RFI group was not evaluated). Steaks had significantly lower cooking loss from medium- versus low-RFI steers. Warner-Bratzler shear force measurements were similar among the groups, and there was no RFI group by postmortem aging period interaction. A 9-member trained sensory panel also evaluated steaks from steers of the RFI groups. The findings of this panel showed no differences among RFI groups for ratings of tenderness or intensity of flavor. However, steaks from high-RFI steers tended (P < 0.10) to be less juicy versus medium- or low-RFI steaks, and also had significantly less off-flavor than those from the low-RFI group. It should be noted that the maximum off-flavor score detected was 1.2 (on a 10-point scale), and was not considered to be detrimental to eating quality (Baker et al., 2006). Overall, Baker et al. (2006) concluded that meat quality and palatability were not different between high- and low-RFI Angus steers, but they encouraged continued monitoring for any
correlated responses, due to the present lack of understanding regarding the biological basis of RFI and incomplete awareness of its potential genetic associations with meat quality traits.
31 Relationship of RFI with behavioral traits Feeding behavior
Several studies have investigated relationships between RFI and feeding behavior traits, and the potential use of such traits as indicators of intake or efficiency. The advent of radio frequency identification technology and its utilization in the GrowSafe® automated data acquisition system (GrowSafe Systems Ltd., Airdrie, Alberta, Canada) has enabled such eating behavior traits—along with intake—to be measured much more conveniently.
However, when a GrowSafe® system is not available, one alternative is the use of video surveillance in conjunction with Calan® gates (American Calan, Northwood, NH) (Bingham et al., 2009).
In feeding behavior studies, a meal event is typically defined as beginning when an animal’s transponder is first detected and ending when the period between the last 2
transponder readings is greater than 300 seconds (e.g., Nkrumah et al., 2007a). A meal could also terminate before that period has elapsed if another animal’s transponder is detected at that bunk or that animal’s transponder is detected at a different bunk. One feeding behavior trait commonly measured is meal frequency (MFREQ; events/d), which is simply the number of independent feeding events recorded for an animal in a day. Significant phenotypic
correlations of MFREQ with RFI have been reported (Robinson and Oddy, 2004; Nkrumah et al., 2007a; Lancaster et al., 2009) and range from rp = 0.18 to rp = 0.26. Two estimates of
the genetic correlations between RFI and MFREQ were found and are quite distinct (Nkrumah et al., 2007a—rg = -0.34± 0.30;; Robinson and Oddy, 2004—rg = 0.43 ± 0.11).
32
min/d), which is the sum of the lengths of all daily individual meal events. Correlations of MDUR with RFI have ranged from rp = 0.16 and rg = -0.35 ± 0.17 (Robinson and Oddy,
2004) to rp = 0.49 and rg = 0.57 ± 0.28 (Nkrumah et al., 2007a). Lancaster et al. (2009a) also
reported rp = 0.41 for the correlation of MDUR with RFI in their Angus bulls. However,
Bingham et al. (2009) did not detect a difference in MDUR between low-RFI and high-RFI groups of Brangus heifers.
A related trait often evaluated is head-down duration (HDUR; min/d), which is the number of times an animal’s transponder is detected each day multiplied by the scanning frequency of the specific GrowSafe system used in the study (scanning frequencies may range from 1.0 to 6.3 s (Nkrumah et al., 2007a)). HDUR is thus a more accurate estimate of the time during which an animal actually has its head in the bunk and is presumably
consuming or masticating feed; MDUR may include time spent away from the bunk, so long as the animal returns within 5 minutes. Estimates of the relationship between HDUR and RFI have been reported by Lancaster et al. (2009a; rp = 0.38) and Nkrumah et al. (2007a; rp
= 0.50 and rg = 0.33 ± 0.30). Bingham et al. (2009) observed a significant difference in
HDUR between high-RFI and low-RFI heifers (greater HDUR for low-RFI group) . Meal-eating rate (MRATE; g/min), another feeding behavior trait, is calculated by dividing DMI by MDUR. The correlation between MRATE and RFI reported by Lancaster et al. (2009a) of rp= 0.08 was not different from zero (at α = 0.05). Bingham et al. (2009),
33 Exit velocity and temperament score
Exit velocity (EV), also known as flight speed (FS), is a measure of the speed with which an animal traverses a specified distance (1.7, 1.83, or 2.44 m in the studies reviewed here) upon release from a chute, such as after processing (Curley et al., 2006). Burrow (2001) reported that EV was heritable (h2 = 0.40 – 0.44) in a tropically adapted cattle population. Temperament scoring is another method of evaluating an animal’s disposition and excitability. These subjective scores are based on a 1-5 (Curley et al., 2006) or a 1-6 scale (BIF, 2002; Elzo et al., 2009), with 1-scored animals being very calm and higher-scoring animals being progressively more agitated or aggressive. Such higher-scoring often takes place while the animal is confined—but not fully restrained—in a chute (chute score; CS), but pen scores (PS) may also be issued to animals evaluated in a small group within a pen (Curley et al., 2006).
Exit velocity has been shown to be associated with growth rate, such that calmer, more slowly moving cattle gain better (Burrow and Dillon, 1997; Voisinet et al., 1997b). Additionally, high chute score has been linked with a detrimental effect on tenderness and incidence of “dark cutters” (Voisinet et al., 1997a; Kadel et al., 2006). A potential
relationship of temperament traits with feed utilization efficiency has also been investigated. Elzo et al. (2009) found no significant correlation of either mean EV or mean CS (average of 6 velocities or scores, respectively) with FCR or RFI. Exit velocity was
significantly correlated with daily feed intake, such that calves that ate more exited the chute more slowly. The authors pointed out that while this may indicate the influence of
34
sluggishly due to their fullness. Elzo et al. (2009) failed to detect a significant relationship of EV or CS with ADG during the 70-d trial. Regarding the absence of correlation with
temperament traits (other than EV with intake), the authors noted that the calves were worked through the chute relatively frequently, likely became accustomed to that type of handling, and thus variation in behavioral traits among the calves may have decreased (Elzo et al., 2009).
Nkrumah et al. (2007a) also reported a significant phenotypic relationship of EV with DMI (rp = -0.35; rg = -0.11 ± 0.26). Exit velocity was phenotypically independent of FCR
and RFI, and genetic correlations of EV with FCR and RFI were rg = 0.40 ± 0.26, and rg =
-0.59 ± 0.45, respectively. Exit velocity was correlated with ADG (rp = -0.26; rg = -0.25 ±
0.25). A relationship between EV and PEG was also observed (rp = -0.13; rg = 0.72 ± 0.19).
Additionally, Nkrumah et al. (2007a) also found EV to be phenotypically independent of RpFt, significantly correlated (phenotypically and genetically) with REA, and independent of uIMF. Exit velocity was negatively correlated with carcass weight and with carcass grade fat, and positively with carcass ribeye area and lean meat yield. Exit velocity was negatively phenotypically correlated with carcass marbling score (Nkrumah et al., 2007a).
Relationship of RFI in growing stage with RFI at maturity
35
Archer et al. (2002) measured feed intake, BW gain, and other traits of 751 beef cows (of British breeds) that had previously undergone similar testing as heifers in the
post-weaning stage. Following post-weaning of their second calf, the cows had ad libitum access to a pelleted feed (approximately 10 MJ ME/kg dm and 17% protein) for a 70-d test, following a 14-d to 21-d acclimation period. Heritability of RFI (intake predicted by regression on MetMW and ADG) in these cows was estimated to be h2 = 0.23. Residual feed intake in the cows was reported to be correlated with their RFI as post-weaning heifers (rp = 0.40; rg =
0.98). Measurements of FCR at the two ages were not as strongly correlated (rp = 0.10; rg =
0.20). It is important to note that these cows were neither gestating nor lactating, and also such a ration is not commonly encountered on commercial beef operations. These points may seriously impact the extrapolation of these results to typical forage-based production systems (Archer et al., 2002). However, these limited results do indicate that selection based on post-weaning RFI should yield a strong correlated response in RFI at maturity.
Additionally, Nieuwhof et al. (1992) reported RFI in post-weaning dairy heifers to be genetically correlated (rg = 0.58) with RFI during first lactation. Working with mice, Archer
et al. (1998) observed correlations (rp = 0.29; rg = 0.60) between post-weaning RFI and RFI
at maturity.
Relationship of RFI with dam productivity traits
Basarab et al. (2007) examined the relationship between progeny RFI and measures of productivity of the dams. With calves grouped by RFIb (includes adjustment for backfat;
36
significant differences in pregnancy, calving, or weaning rates among dams of Low,
Medium, or High progeny. However, dams of High calves did exhibit a higher twinning rate (P < 0.001) and tended to have increased calf death loss (P = 0.10). Calf birth weight, pre-weaning ADG, 200-d weight, cow production efficiency (here, (calf pre-weaning weight / dam weight at weaning) X 100), and cow weight were not significantly different among groups. Interestingly, dams of Low progeny were reported to consistently have greater backfat thickness and to lose less weight than dams of High RFIb progeny. A significant interaction
with age was also present, with backfat differences among RFIb groups widening with
increasing age of the dams. Calving interval did not differ among groups; however, dams of Low progeny did calve 5-6 days later in the season (P < 0.001). Subsets of mature dams from each group entered a feeding trial after weaning, during the second trimester of gestation. Dams of Low and Medium calves had significantly lower DMI and RFI during this period than did dams of High progeny (Basarab et al., 2007).
37
Additionally, McDonald and Nielsen (2007), working with mice divergently selected on heat loss, observed that the Low maintenance requirement (or, Low heat loss) line, which ate the least, had significantly smaller litters than control or High lines. The High line, however, interestingly showed a nearly significant (P = 0.08) reduction in conception rate, compared with that of the Low line (control and Low conception rates were nearly identical) (McDonald and Nielsen, 2007).
Computing RFI from expected requirements
Residual feed intake described thus far in this review has referred to that for which intake is predicted by linear regression using the experimental data. However, an alternative method of calculating expected intake involves applying formulae from sources such as the National Research Council’s Nutrient Requirements of Beef Cattle (NRC, 1984; 2000), for example. These formulae provide standard values of energy requirements for maintenance and for weight gain. Having used such a method to predict intake of Angus and Hereford growing bulls, Fan et al. (1995) reported a heritability estimate of h2 = 0.14 ± 0.12. They found negative phenotypic and genetic correlations of this RFI with ADG and yearling weight. This RFI was also very strongly, negatively correlated with gross efficiency (defined there as ADG/MEI) (Fan et al., 1995). While RFI by regression using the dataset should have a mean very near zero, the RFI values (by NRC requirements) reported by Fan et al. (1995) for the 3 trial years had means of -1.30 ± 0.10, -0.76 ± 0.10, and 0.11 ± 0.10 (Mcal of ME/d).
38
involving Hereford steers and heifers. Residual feed intake calculated after predicting intake with an equation (SCA, 1990) using BW and expected mature BW was phenotypically correlated (rp = 0.62) with RFI (intake predicted by regression on ADG and MetMW). The
alternative RFI was not significantly phenotypically correlated with FCR, but was found to be correlated with intake (0.88), PEG (-0.64), RGR (0.27), Kleiber ratio (0.37), and ADG (0.67). Means for the alternative RFI in this study were also negative and different from zero (indicating that predicted intake was, on average, overestimated) (Hennessy and Arthur, 2004).
Arthur et al. (2001b) also calculated RFI by both methods (feeding standards formulae for that approach were obtained from Geay and Micol, 1988). In Charolais bulls, they found the two RFI traits to be correlated (rp = 0.70; rg = 0.89 ± 0.02). Additionally, the
alternative RFI was correlated with intake (rp = 0.49; rg = 0.50 ± 0.07), FCR (rp = 0.84; rg =
0.93 ± 0.02), PEG (rp = -0.66; rg = -0.81 ± 0.04), RGR (rp = -0.23; rg = -0.77 ± 0.08), Kleiber
ratio (rp = -0.27; rg = 0.40 ± 0.14), and ADG (rp = 0.38; rg = -0.54 ± 0.09). Their standards
also resulted in a negative mean for the alternative RFI (Arthur et al., 2001b).
Robinson and Oddy (2004), also included both types of RFI for their animals (some of which were Bos indicus-influenced), with the alternative method employing the equation from SCA (1990). They reported the two RFI traits to be highly correlated (rp = 0.94; rg =
0.98 ± 0.03). The alternative version of RFI was heritable (h2 = 0.13 ± 0.05) and correlated with intake (rp = 0.42; rg = 0.32 ± 0.20) and FCR (rp = 0.63; rg = 0.69 ± 0.27) (Robinson and
39 Physiological basis of RFI
Archer et al. (1999) outlined three major motivations for understanding the biological basis of variation in feed efficiency. One reason is that knowledge of this basis should provide insight for predicting possible correlated responses to selection for improved feed efficiency. This should be helpful in directing research into correlated responses. Secondly, an understanding of the physiological basis could assist in identification of indicator traits that can be measured more easily and less expensively than feed intake and efficiency. Such traits could be incorporated into selection programs for improved feed efficiency. Finally, understanding the physiological basis of variation in feed efficiency could result in
development of alternative methods of manipulating metabolism. Feed efficiency in beef cattle could thus be improved by non-genetic means (Archer et al., 1999).
40
While familiarity with the underlying biology is of unquestionable value to all students of feed utilization, a more in-depth examination is beyond the scope of this review. All are encouraged to visit the excellent publication by Herd and Arthur (2009).
Challenges and Opportunities of the Present and Future
The greatest impediment to widespread improvement in feed utilization efficiency is the difficulty and expense of measuring individual feed intake. Modern systems such as Calan® Broadbent and GrowSafe® are vastly superior to earlier methods, such as individual housing or tying out animals for individual feeding sessions. However, while the most progressive seedstock producers are beginning to record individual intake data, it may still be many more years before the practice is as widely adopted as that of measuring growth traits (e.g., weaning weight). And, it is likely that intake data collection will always remain prohibitively expensive for commercial cow-calf operators. But until intake is more commonly measured—or, at least, among more of the animals making significant genetic contributions—substantial progress in efficiency will likely remain elusive. It is possible that markers will enhance our ability to estimate efficiency, and could be incorporated into
breeding strategies (Sherman et al., 2010).
Genuine improvement in efficiency requires that more marketable product is
41
42
Literature Cited
Archer, J.A., Arthur, P.F., Herd, R.M., Parnell, P.F., Pitchford, W.S., 1997. Optimum postweaning test for measurement of growth rate, feed intake, and feed efficiency in British breed cattle. J. Anim. Sci. 75, 2024-2032.
Archer, J.A., Pitchford, W.S., Hughes, T.E., Parnell, P.F., 1998. Genetic and phenotypic relationships between food intake, growth, efficiency, and body composition of mice at weaning and at maturity. Anim. Sci. 67, 171-182.
Archer, J.A., Reverter, A., Herd, R.M., Johnston, D.J., Arthur, P.F., 2002. Genetic variation in feed intake and efficiency of mature beef cows and relationships with postweaning measurements. 7th World Congress on Genetics Applied to
Livestock Production, August 19-23, 2002, Montpellier, France.
Archer, J.A., Richardson, E.C., Herd, R.M., Arthur, P.F., 1999. Potential for selection to improve efficiency of feed use in beef cattle: a review. Aust. J. Agric. Res. 50, 147-161.
Arthur, P.F., Archer, J.A., Johnston, D.J., Herd, R.M., Richardson, E.C., Parnell, P.F., 2001a. Genetic and phenotypic variance and covariance components for feed
intake, feed efficiency, and other postweaning traits in Angus cattle. J. Anim. Sci. 79, 2805-2811.
Arthur, P.F., Archer, J.A., Herd, R.M., 2004. Feed intake and efficiency in beef cattle: overview of recent Australian research and challenges for the future. Aust. J. Exp. Agr. 44, 361-369.
Arthur, P.F., Herd, R.M., Wilkins, J.F., Archer, J.A., 2005. Maternal productivity of Angus cows divergently selected for post-weaning residual feed intake. Aust. J. Exp. Agr. 45, 985-993.
Arthur, P.F., Renand, G., Krauss, D., 2001b. Genetic and phenotypic relationships among different measures of growth and feed efficiency in young Charolais bulls.
Livest. Prod. Sci. 68, 131-139.
43
Basarab, J.A., Price, M.A., Aalhus, J.L., Okine, E.K., Snelling, W.M., Lyle, K.L., 2003. Residual feed intake and body composition in young growing cattle. Can. J. Anim. Sci. 83, 189-204.
Basarab, J.A., McCartney, D., Okine, E.K., Baron, V.S., 2007. Relationships between progeny residual feed intake and dam productivity traits. Can. J. Anim. Sci. 87, 489-502.
BIF, 2002. Guidelines for Uniform Beef Improvement Programs, 8th edition. Beef Improvement Federation.
Bingham, G.M., Friend, T.H., Lancaster, P.A., Carstens, G.E., 2009. Relationship between feeding behavior and residual feed intake in growing Brangus heifers. J. Anim. Sci. 87, 2685-2689.
Blaxter, K.L., Wainman, F.W., 1966. The fasting metabolism of cattle. Brit. J. Nutr. 30, 103-111.
Bottje, W.G., Carstens, G.E., 2009. Association of mitochondrial function and feed efficiency in poultry and livestock species. J. Anim. Sci. 87, E48-E63.
Bouquet, A., Fouilloux, M.-N., Renand, G., Phocas, F., 2010. Genetic parameters for growth, muscularity, feed efficiency, and carcass traits of young beef bulls. Livest. Sci. 129, 38-48.
Bowden, D.M., 1980. Feed Utilization for Calf Production in the First Lactation by 2- Year-old F1 Crossbred Beef Cows. J. Anim. Sci. 51, 304-315.
Brelin, B., Brannang, E., 1982. Phenotypic and genetic variation in feed efficiency of growing cattle and their relationship with growth rate, carcass traits, and metabolic efficiency. Swed. J. Agr. Res. 12, 29-34.
Brown, M.A., Dinkel, C.A., 1982. Efficiency to Slaughter of Calves from Angus, Charolais, and Reciprocal Cross Cows. J. Anim. Sci. 55, 254-262.
Burrow, H.M., Dillon, R.D., 1997. Relationships between temperament and growth in a feedlot and commercial carcass traits of Bos indicus crossbreds. Aust. J. Exp. Agr. 37, 407-411.
44
Butts Jr., W.T., Onks, D.O., Neel, J.B., Corrick, J.A., Holloway, J.W., 1984. Relationships Between Traits of Cow-Calf Pairs and a Measure of Partial Efficiency. J. Anim. Sci. 59, 1176-1184.
Castro Bulle, F.C.P., Paulino, P.V., Sanches, A.C., Sainz, R.D., 2007. Growth, carcass quality, and protein and energy metabolism in beef cattle with different growth potentials and residual feed intakes. J. Anim. Sci. 85, 928-936.
Clutter, A.C., Nielsen, M.K., 1987. Effect of Level of Beef Cow Milk Production on Pre- and postweaning calf growth. J. Anim. Sci. 64, 1313-1322.
Crowley, J.J., McGee, M., Kenny, D.A., Crews Jr., D.H., Evans, R.D., Berry, D.P., 2010. Phenotypic and genetic parameters for different measures of feed efficiency in different breeds of Irish performance-tested beef bulls. J. Anim. Sci. 88, 885-894. Curley Jr., K.O., Paschal, J.C., Welsh Jr., T.H., Randel, R.D., 2006. Technical note: Exit
velocity as a measure of cattle temperament is repeatable and associated with serum concentration of cortisol in Brahman bulls. J. Anim. Sci. 84, 3100-3103. Dickerson, G.E., 1978 Animal size and efficiency: Basic concepts. Anim. Prod. 27, 367- 379.
Elzo, M.A., Riley, D.G., Hansen, G.R., Johnson, D.D., Myer, R.O., Coleman, S.W., Chase, C.C., Wasdin, J.G., Driver, J.D., 2009. Effect of breed composition on phenotypic residual feed intake and growth in Angus, Brahman, and Angus x Brahman crossbred cattle. J. Anim. Sci. 87, 3877-3886.
Fan, L.Q., Bailey, D.R., Shannon, N.H., 1995. Genetic parameter estimation of
postweaning gain, feed intake, and feed efficiency for Hereford and Angus bulls fed two different diets. J. Anim. Sci. 73, 365-372.
Ferrell, C.L., Garrett, W.N., Hinman, N., Gritching, G., 1976. Energy utilization by pregnant and nonpregnant heifers. J. Anim. Sci. 42, 937-950.
Ferrell. C.L., Jenkins, T.G., 1984. Energy Utilization by Mature, Nonpregnant, Nonlactating Cows of Different Types. J. Anim. Sci. 58, 234-243. Ferrell, C.L., Jenkins, T.G., 1985. Cow Type and the Nutritional Environment:
Nutritional Aspects. J. Anim. Sci. 61, 725-741.
45
Garrett, W.N., 1971. Energetic efficiency of beef and dairy steers. J. Anim. Sci. 32, 451 -456.
Geay, Y., Micol, D., 1988. Alimentation des bovins en croissance à l’engrais. In: Jarrige, R. (Ed.) 1988. Alimentation des Bovins, Ovins and Caprins. INRA, Paris, pp. 213– 247.
Green, R.D., Cundiff, L.V., Dickerson, G.E., Jenkins, T.G., 1991. Output/input
differences among nonpregnant, lactating Bos indicus-Bos taurus and Bos taurus- Bos taurus F1 cross cows. J. Anim. Sci. 69, 3156-3166.
Gregory, K.E., 1972. Beef Cattle Type for Maximum Efficiency “Putting it All Together.” J. Anim. Sci. 34, 881-884.
Gunsett, F.C., 1984. Linear Index Selection to Improve Traits Defined as Ratios. J. Anim. Sci. 59, 1185-1193.
Hegarty, R.S., Goopy, J.P., Herd, R.M., McCorkell, B., 2007. Cattle selected for
lower residual feed intake have reduced daily methane production. J. Anim. Sci. 85, 1479-1486.
Hennessy, D.W., Arthur, P.F., 2004. The effect of preweaning growth restriction on the feed intake and efficiency of cattle on a grain-based diet before slaughter. Aust. J. of Exp. Agri. 44, 483-488.
Herd, R.M., Archer, J.A., Arthur, P.F., 2003. Reducing the cost of beef production through genetic improvement in residual feed intake: Opportunity and challenges to application. J. Anim. Sci. 81, E9-E17.
Herd, R.M., Arthur, P.F., 2009. Physiological basis for residual feed intake. J. Anim. Sci. 87, E64-E71.
Herd, R.M., Bishop, S.C., 2000. Genetic variation in residual feed intake and its association with other production traits in British Hereford cattle. Livest. Prod. Sci. 63:111-119.
Holloway, J.W., Stephens, D.F., Whiteman, J.V., Totusek, R., 1975a. Performance of 3- Year-Old Hereford, Hereford x Holstein, and Holstein Cows on Range and in Drylot. J. Anim. Sci. 40, 114-125.
46
Hoque, M.A., Arthur, P.F., Hiramoto, K., Oikawa, T., 2006. Genetic relationship between different measures of feed efficiency and its component traits in Japanese Black (Wagyu) bulls. Livest. Sci. 99, 111-118.
Hoque, M.A., Hosono, M., Suzuki, K., 2009. Direct and maternal genetic parameters for measures of feed consumption and feed efficiency in young male Japanese Black cattle. Livest. Sci. 122, 333-338.
Jenkins, T.G., Cundiff, L.V., Ferrell, C.L., 1991. Differences among breed crosses of cattle in the conversion of food energy to calf weight during the preweaning interval. J. Anim. Sci. 69, 2762-2769.
Jenkins, T.G., Ferrell, C.L., 1994. Productivity through weaning of nine breeds of cattle under varying feed availabilities: I. Initial evaluation. J. Anim. Sci. 72, 2787- 2797.
Jenkins, T.G., Long, C.R., Cartwright, T.C., Smith, G.C., 1981. Characterization of Cattle of a Five-Breed Diallel. IV. Slaughter and Carcass Characters of Serially
Slaughtered Bulls. J. Anim. Sci. 53, 62-79.
Jensen, J., Mao, I.L., Anderson, B.B., Madsen, P., 1992. Phenotypic and genetic relationships between residual feed intake and growth, feed intake, and carcass traits of young bulls. J. Anim. Sci. 70, 386-395.
Kadel, M.J., Johnston, D.J., Burrow, H.M., Graser, H.U., Ferguson, D.M., 2006. Genetics of flight time and other measures of temperament and their value as selection criteria for improving meat quality traits in tropically adapted breeds of beef cattle. Aust. J. of Agr. Res. 57, 1029-1035.
Kempster, A.J., 1981. Fat partition and distribution in the carcasses of cattle, sheep, and pigs: A review. Meat Sci. 5, 83-98.
Kennedy, B.W., van der Werf, J.H.J., Meuwissen, T.H.E., 1993. Genetic and statistical properties of residual feed intake. J. Anim. Sci. 71, 3239-3250.
Klosterman, E.W., Parker, C.F., 1976. Effect of size, breed, and sex upon feed efficiency of beef cattle. Ohio Agr. Res. Dev. Center Res. Bull. 1088, July.
Koch, R.M., Swiger, L.A., Chambers, D., Gregory, K.E., 1963. Efficiency of feed use in beef cattle. J. Anim. Sci. 22, 486-494.