Optimization-based Content Selection for Opinion Summarization
Jackie Chi Kit Cheung
Department of Computer Science University of Toronto Toronto, ON, M5S 3G4, Canada
Giuseppe Carenini and Raymond T. Ng
Department of Computer Science University of British Columbia Vancouver, BC, V6T 1Z4, Canada
{carenini,rng}@cs.ubc.ca
Abstract
We introduce a content selection method for opinion summarization based on a well-studied, formal mathematical model, the p-median clustering problem from fa-cility location theory. Our method re-places a series of local, myopic steps to content selection with a global solution, and is designed to allow content and re-alization decisions to be naturally inte-grated. We evaluate and compare our method against an existing heuristic-based method on content selection, using human selections as a gold standard. We find that the algorithms perform similarly, suggest-ing that our content selection method is robust enough to support integration with other aspects of summarization.
1 Introduction
It is now possible to find a large amount of in-formation on people’s opinions on almost every subject online. The ability to analyze such infor-mation is critical in complex, high-stakes decision making processes. At the individual level, some-one wishing to buy a laptop may read customer reviews from others who have purchased and used the product. At the corporate level, customer feed-back on a newly launched product may help to identify weaknesses and features that are in need of improvement (Dellarocas et al., 2004).
Effective summarization systems are thus needed to convey people’s opinions to users. A challenging problem in implementing this ap-proach in a particular domain is to devise a con-tent selection strategy that identifies what key in-formation should be presented. In general, content selection is a critical task at the core of both sum-marization and NLG and it represents a promising area for cross-fertilization.
Existing NLG systems tend to approach con-tent selection by defining a heuristic based on sev-eral relevant factors, and maximizing this heuristic function. ILEX (Intelligent Labelling Explorer) is a system for generating labels for sets of objects defined in a database, such as for museum arti-facts (O’Donnell et al., 2001). Its content selection strategy involves computing a heuristic relevance score for knowledge elements, and returning the items with the highest scores.
In GEA (Generator of Evaluative Arguments), evaluative arguments are generated to describe an entity as positive or negative (Carenini and Moore, 2006). An entity is decomposed into a hierarchy of features, and a relevance score is independently calculated for each feature, based on the prefer-ences of the user and the value of that feature for the product. Content selection involves selecting the most relevant features for the current user.
There is also work in sentiment analysis relying on optimization or clustering-based approaches. Pang and Lee (2004) frame the problem of detect-ing subjective sentences as finddetect-ing the minimum cut in a graph representation of the sentences. They produce compressed versions of movie re-views using just the subjective sentences, which retain the polarity information of the review. Ga-mon et al. (2005) use a heuristic approach to cluster sentences drawn from car reviews, group-ing sentences that share common terms, especially those salient in the domain such as ‘drive’ or ‘han-dling’. The resulting clusters are displayed by a Treemap visualization.
Our work is most similar to the content se-lection method of the multimedia conversation system RIA (Responsive Information Architect) (Zhou and Aggarwal, 2004). In RIA, content selection involves selecting dimensions (such as price in the real estate domain) in response to a query such that the desirability of the dimensions selected for the query is maximized while
ing time and space constraints. The maximization of desirability is implemented as an optimization problem similar to a knapsack problem. RIA’s content selection method performs similarly to ex-pert human designers, but the evaluation is limited in scale (two designers, each annotating two se-ries of quese-ries to the system), and no heuristic al-ternative is compared against it. Our work also frames content selection as a formal optimization problem, but we apply this model to the domain of opinion summarization.
A key advantage of formulating a content selec-tion strategy as a p-median optimizaselec-tion problem is that the resulting framework can be extended to select other characteristics of the summary at the same time as the information content, such as the realization strategy with which the content is ex-pressed. The p-median clustering works as a mod-ule separate from its interpretation as the solution to a content selection problem, so we can freely modify the conversion process from the selection problem to the clustering problem. Work in NLG and summarization has shown that content and realization decisions (including media allocation) are often dependent on each other, which should be reflected in the summarization process. For example, in multi-modal summarization, complex information can be more effectively conveyed by combining graphics and text (Tufte et al., 1998). While graphics can present large amounts of data compactly and support the discovery of trends and relationships, text is much more effective at ex-plaining key points about the data. In another case specific to opinion summarization, the controver-sialityof the opinions in a corpus was found to cor-relate with the type of text summary, with abstrac-tive summarization being preferred when the con-troversiality is high (Carenini and Cheung, 2008). We first test whether our optimization-based approach can achieve reasonable performance on content selection alone. As a contribution of this paper, we compare our optimization-based ap-proach to a previously proposed heuristic method. Because our approach replaces a set of myopic de-cisions with an extensively studied procedure (the p-median problem) that is able to find a global so-lution, we hypothesized our approach would pro-duce better selections. The results of our study indicate that our optimization-based content selec-tion strategy performs about as well as the heuris-tic method. These results suggest that our
frame-work is robust enough for integrating other aspects of summarization with content selection.
2 Previous Heuristic Approach 2.1 Assumed Input Information
We now define the expected input into the summa-rization process, then describe a previous greedy heuristic method. The first phase of the summa-rization process is to extract opinions about an en-tity from free text or some other source, such as surveys. and express the extracted information in a structured format for further processing. We adopt the approach to opinion extraction described by Carenini et al. (2006), which we summarize here.
Given a corpus of documents expressing opin-ions about an entity, the system extracts a set of evaluations on aspects or features of the product. An evaluation consists of a polarity, a score for the strength of the opinion, and the feature be-ing evaluated. The polarity expresses whether the opinion is positive or negative, and the strength expresses the degree of the sentiment, which is represented as an integer from 1 to 3. Possi-ble polarity/strength (P/S) scores are thus [-3,-2,-1,+1,+2,+3], with +3 being the most positive evaluation, and -3 the most negative. For exam-ple, using a DVD player as the entity, the com-ment “Excellent picture quality—on par with my Pioneer, Panasonic, and JVC players.” contains an opinion on thepicture quality, and is a very posi-tive evaluation (+3).
The features and their associated opinions are organized into a hierarchy ofuser-defined features (UDFs), so named because they can be defined by a user according to the user’s needs or interests.1
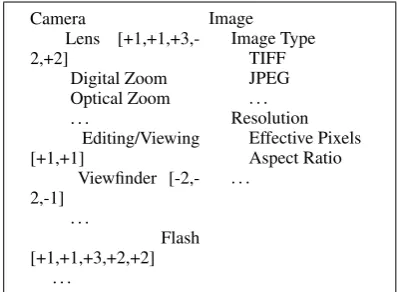
The outcome of the process of opinion extraction and structuring is a UDF hierarchy in which each node is annotated with all the evaluations it re-ceived in the corpus (See Figure 1 for an example).
2.2 Heuristic Content Selection Strategy Using the input information described above, con-tent selection is framed as the process of selecting a subset of those features that are deemed more
1Actually, the system first extracts a set of surface-level
Camera
Lens [+1,+1,+3,-2,+2]
Digital Zoom Optical Zoom . . .
[image:3.595.81.283.62.208.2]Editing/Viewing [+1,+1]
Viewfinder [-2,-2,-1]
. . .
Flash [+1,+1,+3,+2,+2]
. . .
Image Image Type
TIFF JPEG . . . Resolution
Effective Pixels Aspect Ratio . . .
Figure 1: Partial view of assumed input informa-tion (UDF hierarchy annotated with user evalua-tions) for a digital camera.
important and relevant to the user. This is done using an importance measure defined on the avail-able features (UDFs). This measure is calculated from the P/S scores of the evaluations associated to each UDF. LetP S(u)be the set of P/S scores that UDF u receives. Then, a measure of im-portance is defined as some function of the P/S scores. Previous work considered only summing the squares of the scores. In this work, we also consider summing the absolute value of the scores. So, the importance measure is defined as
dir moi(u) = X psP S(u)
ps2 or X psP S(u)
|ps|
where the term ‘direct’ means the importance is derived only from that feature and not from its descendant features. The basic premises of these metrics are that a feature’s importance should be proportional to the number of evaluations of that feature in the corpus, and that stronger evaluations should be given more weight. The two versions implement the latter differently, using the sum of squares or the absolute values respectively. No-tice that each non-leaf node in the feature hierar-chy effectively serves a dual purpose. It is both a feature upon which a user might comment, as well as a category for grouping its sub-features. Thus, a non-leaf node should be important if either its descendants are important or the node itself is im-portant. To this end, a total measure of importance moi(u)is defined as
moi(u) =
dir moi(u) ifCH(u) = ∅ [α dir moi(u) +
(1P−α)×
v∈CH(u)moi(v)] otherwise
where CH(u) refers to the children of u in the hierarchy andαis some real parameter in the range [0.5,1] that adjusts the relative weights of the parent and children. We found in our experi-mentation that the parameter setting does not sub-stantially change the performance of the system, so we select the value 0.9 forα, following previ-ous work. As a result, the total importance of a node is a combination of its direct importance and of the importance of its children.
The selection procedure proceeds as follows. First, the most obvious simple greedy selection strategy was considered–sort the nodes in the UDF by the measure of importance and select the most important node until a desired number of features is included. However, since a node derives part of its ‘importance’ from its children, it is possible for a node’s importance to be dominated by one or more of its children. Including both the child and parent node would be redundant because most of the information is contained in the child. Thus, a dynamic greedy selection algorithm was devised in which the importance of each node was recal-culated after each round of selection, with all pre-viously selected nodes removed from the tree. In this way, if a node that dominates its parent’s im-portance is selected, its parent’s imim-portance will be reduced during later rounds of selection. No-tice, however, that this greedy selection consists of a series of myopic steps to decide which features to include in the summary next, based on what has been selected already and what remains to be se-lected at this step. Although this series of local decisions may be locally optimal, it may result in a suboptimal choice of contents overall.
3 Clustering-Based Optimization Strategy
of importance defined above. Our framework is UDF-based in the following senses. First, a UDF is the basic unit of content that is selected for in-clusion in the summary. Also, the information content that needs to be “covered” by the summary is the sum of the information content in all of the UDFs in the UDF hierarchy.
To reduce content selection to a clustering prob-lem, we need the following components. First, we need a cost function to quantify how well a UDF (if selected) can express the information content in another UDF. We call this measure the infor-mation coverage cost. To define this cost func-tion, we need to define the semantic relatedness between the selected content and the covered con-tent, which is domain-dependent. For example, we can rely on similarity metrics such as ones based on WordNet similarity scores (Fellbaum and oth-ers, 1998). In the consumer product domain in which we test our method, we use the UDF hi-erarchy of the entity being summarized.
Second, we need a clustering paradigm that de-fines the quality of a proposed clustering; that is, a way to globally quantify how well all the infor-mation content is represented by the set of UDFs that we select. The clustering paradigm that we found to most naturally fit our task is the p-median problem (also known as the k-median problem), from facility location theory. In its original in-terpretation, p-median is used to find optimal lo-cations for opening facilities which provide ser-vices to customers, such that the cost of serving all of the customers with these facilities is mini-mized. This matches our intuition that the quality of a summary of opinions depends on how well it represents all of the opinions to be summarized. Formally, given a setF ofm potential locations for facilities, a setU ofncustomers, a cost func-tion d : F ×U −→ < representing the cost of serving a customeru ∈ U with a facility f ∈ F, and a constantp ≤ m, an optimal solution to the p-median problem is a subsetSofF, such that the expression X
u∈U min f∈Sd(f, u)
is minimized, and|S|=p. The subsetSis exactly the set of UDFs that we would include in the sum-mary, and the parameterpcan be set to determine the summary length.
Although solving the p-median problem is NP-hard in general (Kariv and Hakimi, 1979), viable
approximation methods do exist. We use POP-STAR, an implementation of an approximate so-lution (Resende and Werneck, 2004) which has an average error rate of less than 0.4% on all the problem classes it was tested on in terms of the p-median problem value. As an independent test of the program’s efficacy, we compare the program’s output to solutions which we obtained by brute-force search on 12 of the 36 datasets we worked with which are small enough such that an exact so-lution can be feasibly found. POPSTAR returned the exact solution in all 12 instances.
We now reinterpret the p-median problem for summarization content selection by specifying the setsU,F, and the information coverage costdin terms of properties of the summarization process. We define the basic unit of the summarization pro-cess to be UDFs, so the setsU andF correspond to the set of UDFs describing the product. The constant p is a parameter to the p-median prob-lem, determining the summary size in terms of the number of features.
The cost function isd(u, v), whereuis a UDF that is being considered for inclusion in the sum-mary, andvis the UDF to be “covered” byu. To specify this cost, we need to consider both the to-tal amount of information in v as well as the se-mantic relationship between the two features. We use the importance measure defined earlier, based on the number and strength of evaluations of the covered feature to quantify the former. The raw importance score is modified by multipliers which depend on the relationship betweenuandv. One is the semantic relatedness between the two fea-tures, which is modelled by the UDF tree hierar-chy. We hypothesize that it is easier for a more general feature to cover information about a more specific feature than the reverse, and that features that are not in a ancestor-descendant relationship cannot cover information about each other because of the tenuous semantic connection between them. For example, knowing that a camera is well-liked in general provides stronger evidence that its dura-bility is also well-liked than the reverse. Based on these assumptions, we define a multiplier for the above measure of importance based on the UDF tree structure,T(u, v), as follows.
T(u, v) =
Tup×k, ifuis a descendant ofv
k, ifuis an ancestor ofv
∞, otherwise
hierarchy. Tupis a parameter specifying the
rela-tive difficulty of covering information in a feature that is an ancestor in the UDF hierarchy. Mirror-ing our experience with the heuristic method, the value of the parameter does not affect performance very much. In our experiments and the example to follow, we pick the valuesTup = 3, meaning that
covering information in an ancestor node is three times more difficult than covering information in a descendant node.
Another multiplier to the opinion domain is the distribution of evaluations of the features. Cover-age is expected to be less if the features are evalu-ated differently; for example, if users revalu-ated a cam-erawell overall but the featurezoompoorly, a sen-tence about how well the camera is rated in gen-eral does not provide much evidence that the zoom is not well liked, and vice versa. Since evalua-tions are labelled with P/S ratings in our data, it is natural to define this multiplier based on the dis-tributions of ratings for the features. Given these P/S ratings between -3 and +3, we first aggregate the positive and negative evaluations. As before, we test both summing absolute values and squared values. Define:
imp pos(u) = X ps∈P S(u)∧ps>0
ps2or |ps|
imp neg(u) = X ps∈P S(u)∧ps<0
ps2or |ps|
Then, we calculate the parameter to the Bernoulli distribution corresponding to the ratio of the im-portance of the two polarities. That is, Bernoulli with parameter
θ(u) =imp pos(u)/(imp pos(u)+imp neg(u))
The distribution-based multiplier E(u, v) is the Jensen-Shannon divergence from Ber(θ(u)) to Ber(θ(v)), plus one for multiplicative identity when the divergence is zero.
E(u, v) =JS(θ(u), θ(v)) + 1
The final formula for the information coverage cost is thus
d(u, v) =dir moi(v)×T(u, v)×E(u, v)
Consider the following example consisting of four-node UDF tree and importance scores.
i. Covered ii.Solutions
A B C D p Selected Val.
Co
vering
A 0 50 30 240 1 A 320
B 165 0 ∞ 120 2 A,D 80
C 165 ∞ 0 ∞ 3 A,B,D 30
[image:5.595.310.531.61.125.2]D 330 150 ∞ 0 4 A,B,C,D 0
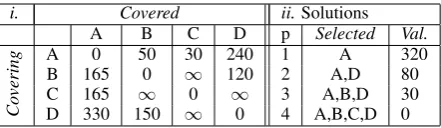
Table 1: i. Information coverage cost scores for the worked example. Rows represent the covering feature, while columns represent the covered fea-ture. ii. Optimal solution to p-median problem in the worked example at different numbers of fea-tures selected.
A dir moi(A) = 55 .&
B C dir moi(B) = 50, dir moi(C) = 30 ↓
D dir moi(D) = 120
With parameter Tup = 3 and setting the
distribution-based multiplier E to 1 to simplify calculations (or for example, if the features re-ceived the same distributions of evaluations), this tree yields the information coverage cost scores found in Table 1i. Running p-median on these val-ues produces the optimal results found in Table 1ii. This method trades off selecting centrally located nodes near the root of the UDF tree and the im-portance of the individual nodes. In this example, Dis selected after the root nodeAeven thoughD has a greater importance value.
4 Comparative Evaluation 4.1 Stochastic Data Generation
In our experiments we wanted to compare the two content selection strategies (heuristic vs. p-median optimization) on datasets that were both realistic and diverse. Despite the widespread adoption of user reviews in online websites, there is to our knowledge no publicly available corpus of cus-tomer reviews of sufficient size which is annotated with features arranged in a hierarchy. While small-scale corpora do exist for a small number of prod-ucts, the size of the corpora is too small to be rep-resentative of all possible distributions of evalu-ations and feature hierarchies of products, which limits our ability to draw any meaningful conclu-sion from the dataset.2 Thus, we stochastically
2Using a constructed dataset based on real data where no
anal-mean std. # Features 55.3889 8.5547 # Evaluated Features 21.6667 5.9722 # Children (depth 0) 11.3056 0.7753 # Children (depth 1 fertile) 5.5495 1.7724 Table 2: Statistics on the 36 generated data sets. At depth 1, 134 of the 407 features in total across the trees were barren. The generated tree hierar-chies were quite flat, with a maximum depth of 2.
generated the data for the products to mimic real product feature hierarchies and evaluations. We did this by gathering statistics from existing cor-pora of customer reviews about electronics prod-ucts (Hu and Liu, 2004), which contain UDF hier-archies and evaluations that have been defined and annotated. Using these statistics, we created dis-tributions over the characteristics of the data, such as the number of nodes in a UDF hierarchy, and sampled from these distributions to generate new UDF hierarchies and evaluations. In total, we gen-erated 36 sets of data, which covered a realistic set of possible scenarios in term of feature hierarchy structures as well as in term of distribution of eval-uations for each feature. Table 2 presents some statistics on the generated data sets.
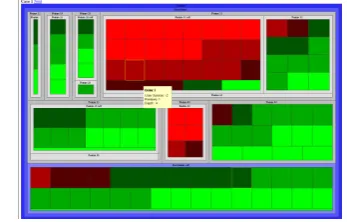
4.2 Building a Human Performance Model We adopt the evaluation approach that a good con-tent selection strategy should perform similarly to humans, which is the view taken by existing sum-marization evaluation schemes such as ROUGE (Lin, 2004) and the Pyramid method (Nenkova et al., 2007). For evaluating our content selection strategy, we conducted a user study asking human participants to perform a selection task to create “gold standard” selections. Participants viewed and selected UDF features using a Treemap infor-mation visualization. See Figure 2 for an example. We recruited 25 university students or gradu-ates, who were each presented with 19 to 20 of the cases we generated as described above. Each case represented a different hypothetical product, which was represented by a UDF hierarchy, as well as P/S evaluations from -3 to +3. These were displayed to the participants by a Treemap visual-ization (Shneiderman, 1992), which is able to give an overview of the feature hierarchy and the eval-uations that each feature received. Treemaps have been shown to be a generally successful tool for ysis such as a user review corpus by Constant et al. (2008) have been released, as an anonymous reviewer pointed out.
visualizing data in the customer review domain, even for novice users (Carenini et al., 2006). In a Treemap, the feature hierarchy is represented by nested rectangles, with parent features being larger rectangles, and children features being smaller rectangles contained within its parent rectangle. The size of the rectangles depends on the number of evaluations that this feature received directly, as well as indirectly through its children features. Each evaluation is also shown as a small rectangle, coloured according to its P/S rating, with -3 being bright red, and +3 being bright green.
Participants received 30 minutes of interactive training in using Treemaps, and were presented with a scenario in which they were told to take the role of a friend giving advice on the purchase of an electronics product based on existing customer reviews. They were then shown 22 to 23 scenar-ios corresponding to different products and eval-uations, and asked to select features which they think would be important to include in a summary to send to a friend. We discarded the first three selections that participants made to allow them to become further accustomed to the visualization.
The number of features that participants were asked to select from each tree was 18% of the number of selectable features. A feature is con-sidered selectable if it appears in the Treemap vi-sualization; that is, the feature receives at least one evaluation, or one of its descendant features does. This proportion was the average propor-tion at which the selecpropor-tions made by the heuristic greedy strategy and p-median diverged the most when we were initially testing the algorithms. Be-cause each tree contained a different number of features, the actual number of features selected ranged from two to seven. Features were given generic labels likeFeature 34, so that participants cannot rely on preexisting knowledge about that
[image:6.595.326.500.614.725.2]Selection method Cohen’s Kappa heuristic, squared moi 0.4839
[image:7.595.82.282.62.134.2]heuristic, abs moi 0.4841 p-median, squared moi 0.4679 p-median, abs moi 0.4821
Table 3: Cohen’s kappa for heuristic greedy and p-median methods against human selections. Two versions of the measure of importance were tested, one using squared P/S scores, the other using ab-solute values.
kind of product in their selections.
4.3 Evaluation Metrics
Using this human gold standard, we can now com-pare the greedy heuristic and the p-median strate-gies. We report the agreement between the hu-man and machine selections in terms of kappa and a version of the Pyramid method. The Pyra-mid method is a summarization evaluation scheme built upon the observation that human summaries can be equally informative despite being divergent in content (Nenkova et al., 2007). In the Pyramid method, Summary Content Units (SCUs) in a set of human-written model summaries are manually identified and annotated. These SCUs are placed into a pyramid with different tiers, corresponding to the number of model (i.e. human) summaries in which each SCU appears. A summary to be evaluated is similarly annotated by SCUs and is scored by the scores of its SCUs, which are the tier of the pyramid in which the SCU appears. The Pyramid score is defined as the sum of the weights of the SCUs in the evaluated summary divided by the maximum score achievable with this number of SCUs, if we were to take SCUs starting from the highest tier of the pyramid. Thus, a summary scores highly if its SCUs are found in many of the model summaries. We use UDFs rather than text passages as SCUs, since UDFs are the ba-sic units of content in our selections. Moderate inter-annotator agreement between human feature selections shows that our data fits the assumption of the Pyramid method (i.e. diversity of human an-notations); the Fleiss’ kappa (1971) scores for the human selections ranged from 0.2984 to 0.6151, with a mean of 0.4456 among all 33 sets which were evaluated. A kappa value above 0.6 is gener-ally taken to indicate substantial agreement (Lan-dis and Koch, 1977).
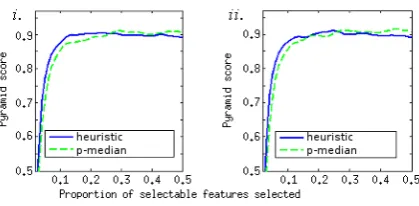
Figure 3: Pyramid scores for the two selection ap-proaches at different numbers of featuresi. using the squared importance measure,ii. using the ab-solute value importance measure.
4.4 Results
The greedy heuristic method and p-median per-form similarly at the number of features that the human participants were asked to select. The dif-ference is not statistically significant by a two-tailed t-test. Table 3 shows that using absolute values of P/S scores in the importance measure is better than using squares. Squaring seems to give too much weight to extreme evaluations over more neutral evaluations. P-median is particu-larly affected, which is not surprising as it uses the measure of importance both in the raw importance score and in the distribution-based multiplier.
The Pyramid method allows us to compare the algorithms at different numbers of features. Fig-ure 3 shows the average pyramid score for the two methods over the proportion of features that are selected. Overall, both algorithms perform well, and reach a score of about 0.9 at 10% of features selected. The heuristic method performs slightly better when the proportion is below 25%, but slightly worse above that proportion.
We consider several possible explanations for the surprising result that the heuristic greedy method and p-median methods perform similarly. One possibility is that the approximate p-median solution we adopted (POPSTAR) is error-prone on this task, but this is unlikely as the approximate method has been rigorously tested both externally on much larger problems and internally on a sub-set of our data. Another possibility is that the au-tomatic methods have reached a ceiling in perfor-mance by these evaluation metrics.
[image:7.595.312.522.66.169.2]summarization decisions into content selection is an option worth exploring.
5 Conclusions and Future Work
We have proposed a formal optimization-based method for summarization content selection based on the p-median clustering paradigm, in which content selection is viewed as selecting clusters of related information. We applied the frame-work to opinion summarization of customer re-views. An experiment evaluating our p-median algorithm found that it performed about as well as a comparable existing heuristic approach de-signed for the opinion domain in terms of similar-ity to human selections. These results suggest that the optimization-based approach is a good starting point for integration with other parts of the sum-marization/NLG process, which is a promising av-enue of research.
6 Acknowledgements
We would like to thank Lucas Rizoli, Gabriel Mur-ray and the anonymous reviewers for their com-ments and suggestions.
References
R. Barzilay and M. Lapata. 2005. Modeling Local
Co-herence: An Entity-based Approach. InProc. 43rd
ACL, pages 141–148.
G. Carenini and J.C.K. Cheung. 2008. Extractive vs. NLG-based abstractive summarization of evaluative text: The effect of corpus controversiality. InProc. 5th INLG.
G. Carenini and J.D. Moore. 2006. Generating and evaluating evaluative arguments. Artificial Intelli-gence, 170(11):925–952.
G. Carenini, R.T. Ng, and A. Pauls. 2006. Interac-tive multimedia summaries of evaluaInterac-tive text. In Proc. 11th Conference on Intelligent User Inter-faces, pages 124–131.
N. Constant, C. Davis, C. Potts, and F. Schwarz. 2008. The pragmatics of expressive content:
Evi-dence from large corpora. Sprache und
Datenverar-beitung.
C. Dellarocas, N. Awad, and X. Zhang. 2004. Explor-ing the Value of Online Reviews to Organizations: Implications for Revenue Forecasting and Planning. InProc. 24th International Conference on Informa-tion Systems.
C. Fellbaum et al. 1998. WordNet: an electronic lexi-cal database. Cambridge, Mass: MIT Press.
J.L. Fleiss et al. 1971. Measuring nominal scale
agree-ment among many raters. Psychological Bulletin,
76(5):378–382.
M. Gamon, A. Aue, S. Corston-Oliver, and E. Ringger. 2005. Pulse: Mining customer opinions from free
text. Lecture Notes in Computer Science, 3646:121–
132.
M. Hu and B. Liu. 2004. Mining and summarizing
customer reviews. In Proc. 2004 ACM SIGKDD
International Conference on Knowledge Discovery and Data Mining, pages 168–177. ACM Press New York, NY, USA.
O. Kariv and S.L. Hakimi. 1979. An algorithmic approach to network location problems. II: the
p-medians. SIAM Journal on Applied Mathematics,
37(3):539–560.
J.R. Landis and G.G. Koch. 1977. The measurement of observer agreement for categorical data. Biometrics, 33(1):159–174.
C.Y. Lin. 2004. ROUGE: A Package for Automatic
Evaluation of Summaries. In Proc. Workshop on
Text Summarization Branches Out, pages 74–81. A. Nenkova, R. Passonneau, and K. McKeown. 2007.
The Pyramid Method: Incorporating human con-tent selection variation in summarization evaluation. ACM Transactions on Speech and Language Pro-cessing (TSLP), 4(2).
M. O’Donnell, C. Mellish, J. Oberlander, and A. Knott. 2001. ILEX: an architecture for a dynamic hypertext
generation system. Natural Language Engineering,
7(03):225–250.
B. Pang and L. Lee. 2004. A sentimental education: Sentiment analysis using subjectivity summarization
based on minimum cuts. InProc. 42nd ACL, pages
271–278.
M.G.C. Resende and R.F. Werneck. 2004. A
Hy-brid Heuristic for the p-Median Problem. Journal
of Heuristics, 10(1):59–88.
J.C. Reynar. 1994. An automatic method of finding
topic boundaries. InProc. 32nd ACL, pages 331–
333.
B. Shneiderman. 1992. Tree visualization with
tree-maps: 2-d space-filling approach. ACM
Transac-tions on Graphics (TOG), 11(1):92–99.
E.R. Tufte, S.R. McKay, W. Christian, and J.R Matey. 1998. Visual Explanations: Images and Quanti-ties, Evidence and Narrative. Computers in Physics, 12(2):146–148.