DOI: http://dx.doi.org/10.26483/ijarcs.v11i3.6523
Volume 11, No. 3, May-June 2020
International Journal of Advanced Research in Computer Science
RESEARCH PAPER
Available Online at www.ijarcs.info
ISSN No. 0976-5697
COMPARATIVE ANALYSIS OF MULTIPLE CLASSIFIERS FOR HEART
DISEASE CLASSIFICATION
Arindam Baidya
Dept. of Computer Science and Engineering Reva University
Bangalore, India
B R Pavani
Dept. of Computer Science and Engineering Reva University
Bangalore, India
Akram Pasha
Dept. of Computer Science and Engineering Reva University
Bangalore, India
Ashish Paul
Dept. of Computer Science and Engineering Reva University
Bangalore, India
Akshay Wali
Dept. of Computer Science and Engineering Reva University
Bangalore, India
Abstract: Over the last decade heart disease remains the main reason for death in the world wide. Several data mining techniques and analysis have been used by the researchers to help health care professionals in the diagnosis of heart disease but using the old traditional techniques can reduce the number of test that is required. With the vast growing death rate in heart disease worldwide it is sure that there must be a quick and efficient detection technique. Supervised machine learning algorithm is one of the effective data analysis methods used. This research compares different algorithms of Logistic regression (LR), artificial neural network (ANN), K- Nearest Neighbor (KNN), Naïve Bayes (NB), and Random Forest (RF) classification seeking better performance in heart disease diagnosis. The algorithms are tested in Anaconda platform (J-Python). The existing datasets of heart disease patients from Google scholar database is used to test and justify the performance of all the algorithms. This datasets (Framingham) consists of 23138 instances and 16 attributes. Subsequently, the classification algorithm that has optimal potential will be suggested for use in sizeable data. The aim of this work is to design a model to enter the patient record and predict whether the patient is having Heart disease by using machine learning techniques with accurate prediction.
Keywords: Heart Diseases, Machine learning techniques, K- Nearest Neighbor; Naïve Bayes; Random Forest; Artificial neural network; Logistic regression; Stochastic Gradient Descent.
I. INTRODUCTION
Day by day incidences of chronic diseases are increasing with the advance in living standards. In a report by McKinsey [1], he had mentioned that 50% of Americans suffer from one or more chronic diseases, and 80% of American medical care fee is spent on the treatment of these chronic diseases. Statistically it is shown that on an average annually US spend 2.7 trillion USD to treat chronic diseases. The healthcare problems related to chronic diseases are very important in many other countries and make it necessary to conduct risk assessments for chronic diseases and heart diseases. Human anatomy is comprised of so many vital organs and among all; heart also plays an important role. Heart pumps out blood to all part of human body and if it does not function properly it will cause death of the person. Diseases related to coronary artery; problems in heart rhythm (cardiac arrhythmias); congenital heart defects; all of these conditions affect the heart and causes heart diseases. With the escalation in medical data [2], collecting electronic health records (EHR) will diminish the cost spend in chronic diseases. A resourceful flow estimating algorithm, which
was made for the telehealth cloud system was mentioned in some paper [3] and a data coherence protocol for the PHR (Personal Health Record)-based distributed system was designed for the same. In the field of healthcare Bates et al. [4] proposed six applications of big data and one of the applications is to identify high-risk patients which can be helped to minimize medical cost as patients with high risk to develop a chronic diseases often require expensive healthcare. Predictions made by traditional disease risk models like data analysis has the drawbacks like adjustment of less supervised data, though they have high accuracy but in case of big data analysis more numbers of structured, non-structured, supervised data can be analyzed. Data mining technique, which examines a large datasets to extract hidden and previously unidentified patterns, is another tool which had been developed by the researchers to assist the doctors, nurses or pharmacists in the diagnosis of heart diseases [5].
are too enormous for human minds to comprehend, can be easily understandable using the machine learning techniques. Algorithms, which have been used in this paper, are useful to anticipate the occurrence of heart related diseases with accuracy. This paper presents a comparison among the 6 classifiers algorithm models for big data analysis that improves the data accuracy to distinguish between heart disease patients from non heart disease patients and can be able to determine more probabilistically that the patients will be diagnosed with heart disease.
II. LITERATURE SURVEY
• Akram Pasha and P H. Latha [7] had worked on machine learning system and investigated the range of machine learning classification models trained with the optimal subset of features of Parkinson’s disease data set for efficient Parkinson’s disease classification. For their work they have used algorithms like Genetic Algorithm and Binary Particle Swarm Optimization in different machine learning classifiers and found that Genetic Algorithm produced the maximum dimensionality reduction with maximum classification accuracy than others.
• D. W. Bates, S. Saria, L. Ohno-Machado, A. Shah, and G. Escobar: This paper basically focuses on health care in big data that identifies and manages the high quality risk and cost in patients by adopting EHR which increases quantity outbreak of diseases.
• Monika Gandhi et.al, [8] used Naive Bayes, Decision tree and neural network algorithms and analyzed the medical dataset. There are a huge number of features involved. So, there is a need to reduce the number of features. This can be done by texture selection. On doing this, they say that time is reduced. They made a use of decision tree and neural networks.
• Helma, C., E. Gottmann, and S. Kramer, “Knowledge discovery and data mining in toxicology”: Techniques in this paper majority focused on machine learning in symbolic form developed by toxicological applications mainly in detecting the structure relationships.
• Dhomse Kanchan B and Mahale Kishor M. et al. “Study of Machine Learning Algorithms for Disease Prediction using PCA Analysis”:
Healthcare industry collects large amounts of data which unfortunately are not “Extracted” for discovering sight information for effective decision making. In this paper, study of PCA has been done which finds the minimum number of attributes required to enhance the precision of various supervised machine learning algorithms.
• M. Nikhil Kumar et al. [9] used various algorithms like Decision tree, random forest, Naive Bayes, KNN, Support vector machine; logistic model tree and Naive Bayes algorithm tend to gave better performance when compared to other algorithms. They have used UCI repository of heart disease dataset. The result of their work showed
that time taken to build UCI J48 algorithm was less compared to other and better in work.
• Min Chen, Yixue Hao, Kai Hwang, Fellow, IEEE, Lu Wang, and Lin Wang; “Predicting heart diseases in machine learning over big data Communities: In this paper, they had design machine learning algorithms for efficient prediction of disease outbreak in various communities and experiment the customized minor changes in prediction of models over real-life hospital data models collected from central China.
• Shan Xu, Tiangang Zhu, Zhen Zang, Daoxian Wang, Junfeng Hu and Xiaohui Duan et al. “Cardiovascular Risk Prediction Method and Random Forest Classification Framework”:
Here in this paper they had used Machine Learning algorithms to various medical datasets to automate the analysis of large and complex data. This paper presents various ssupervised models such as SVM, KNN, Naïve Bayes, Decision Trees (DT), Random Forest (RF) and ensemble models to check the risk of cardiovascular diseases.
III. APPROACHANDMETHODOLOGY
A. Steps followed for the recent work:
1. First we choose the platform to implement all the algorithms.
2. A set of data was chosen first.
3. The selected data set was distributed into two parts. 60% of data was selected for training and the rest of 40% for testing.
4.
Feature Selection: It is the process where we
automatically or randomly select the attributes
in a table which contributes to most predicted
output in which we are interested. In our
analysis of table we have chosen some
attributes which are mostly predicted with
heart disease with selected categories.
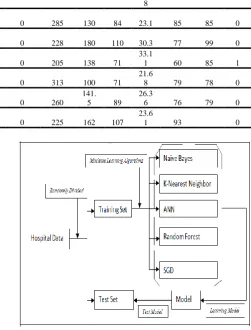
The datasets given in the table II. (First 10 datasets) are taken from (Framingham) Kaggle repository tool. This dataset has 23128 instances and 16 attributes. These data are analyzed in Anaconda (Jupiter). 5. Feature Extraction: It is an essential process in6. Then we used SMOT libraries, which was to organize the imbalance data set to balance data set. 7. Then by using confusion matrix, a well train data
set was obtained.
8. Lastly the evaluated kappa value and the accuracy of the data set were calculated by using different algorithms.
Table I. List of attributes
SL. No. List of attributes
1 Gender Male
Female 2 Age
3 Education level High school
GED Vocational
school College
4 Smoking status 0
Nonsmoker
1
Smoker 5 Number of cigarette per day
6 Patients on blood pressure medication 0 Not on medication 1 On medication 7 Prevalent stroke
8 Prevalent hypertension 9 Cholesterol level in mg/dL 10 Systolic Blood Pressure (mmHg)
11 Diastolic blood pressure
(mmHg)
12 BMI Body mass
13 Ventricular Heart rate
Beats/min
14 Glucose level
mg/dL
15 Congenital heart disease patient in last 10 years
16 Patients with diabetes 0
No
1
Yes
B. For all algorithms we have been used below
libraries.
• Scikit-learn library: It is a library in Python. It provides information about many unsupervised and supervised learning algorithms.
• Pandas library: It is a software library written for the Python programming language for data manipulation and analysis. Generally it offers data
structures and operations for manipulating numerical tables and time series.
• NumPy library: It adds support for large, multi-dimensional arrays and matrices, along with a large collection of high-level mathematical functions to operate on these arrays.
All algorithms we are using correlation matrix as a preprocessing. We have used same preprocessing techniques in every algorithm. After that we are balancing our dataset using SMOT (Synthetic Minority over Sampling) Technique.
Different machine learning algorithms are explained below:
• K- Nearest Neighbour (KNN): KNN is a non-parametric machine learning algorithm. The KNN algorithm is a supervised learning method. This means that all the data is labeled and the algorithm learns to predict the output from the input data. The data is divided into training and test sets. The train set is used for model building and training. A k- value is decided which is often the square root of the number of observations. Now the test data is predicted on the model built [10].
The formula for Euclidean distance is as follows: d = v?^k (xi - yi)2
i =1
• Naïve Bayes (NB): This is a classification algorithm which is used when the dimensionality of the input is very high. A Naive Bayes classifier assumes that the presence of a particular feature in a class is unrelated to the presence of any other feature. It is based on Bayes theorem [11].
The Bayes theorem is as follows: P(Y/X) = P(X/Y) P(X)
This calculates the probability of Y given X where X is the prior event and Y is the dependence event.
It needs less training data. It can be used for binary classification problems and is very simple.
• Random Forest (RF): It is a supervised machine learning algorithm. This technique is used for both regression and classification tasks. It performs better in classification tasks. It is nothing but ensemble of multiple decision trees. It is used for both classification as well as regression but in our work we have used it for classification purpose only [12]. It uses a voting system and then decides the class; for classification. It works well with large datasets with high dimensionality and that is proved in our study also.
Table II. First 10 dataset
Sr no
Male Age
Edu-cation Current smoker Cigs per day BP Med s Pre-valent stroke Pre-valent hyp Dia-betes Total chole-sterol Sys BP Dia BP
BMI Heart Rate Glu-cose Ten year CHD
1 1 39 4 0 0 0 0 0 0 195 106 70
26.9
7 80 77 0
2 0 46 2 0 0 0 0 0 0 250 121 81
28.7
3 95 76 0
3 1 48 1 1 20 0 0 0 0 245
127. 5 80
25.3
4 0 8
5 0 46 3 1 23 0 0 0 0 285 130 84 23.1 85 85 0
6 0 43 2 0 0 0 0 1 0 228 180 110 30.3 77 99 0
7 0 63 1 0 0 0 0 0 0 205 138 71
33.1
1 60 85 1
8 0 45 2 1 20 0 0 0 0 313 100 71
21.6
8 79 78 0
9 1 52 1 0 0 0 0 1 0 260
141. 5 89
26.3
6 76 79 0
10 1 43 1 1 30 0 0 1 0 225 162 107
23.6
1 93 0
• Artificial neural network (ANN): Artificial neural network; as the name indicates these are nothing but the computational models designed like animal’s central nervous systems (in particular the brain) that are capable of machine learning and pattern recognition. They are usually presented as systems of interconnected “neurons” that can compute values from inputs by feeding information through the network [13]. ANN can be used for pattern recognition or data classification, through a learning process. Along with the advantages like the capacity to find complex relations among variables, with a high tolerance to data uncertainty, and providing predicted variable patterns in-real time ANN also can perform tasks that a linear output cannot, as one of the neurons fail the others will work in a parallel way [14]. Their main advantages the capacity to find complex relations among variables, with a high tolerance to data uncertainty, and providing predicted variable patterns in-real time.
• Logistic Regression (LR): It is a supervised learning classification algorithm used to estimate the probability of a target variable. In this the nonlinear regression gets transformed to the linear regression. It is the S-shaped distribution function contains the estimated probabilities to lie between 0 and 1[15]. Logistic regression works by exploring the problems where one or more independent variables can determine a dependent variable, which in nothing but the outcome. Many of its functions can be found in the medical field.
[image:4.595.315.567.57.388.2]• Stochastic Gradient Descent (SGD): Stochastic gradient descent is a type of gradient descent, which is used to find out the values of parameters (coefficients) of a function that minimizes a cost function for large number of data. Gradient descent is best used when the parameters cannot be calculated analytically.
Figure 1. Flow chart of the experimental work
IV. RESULTANDDISCUSSION
Figure 2. AUC-ROC graphical representation of ANN and LR respectively.
Figure 3. AUC-ROC graphical representation of RF and KNN respectively.
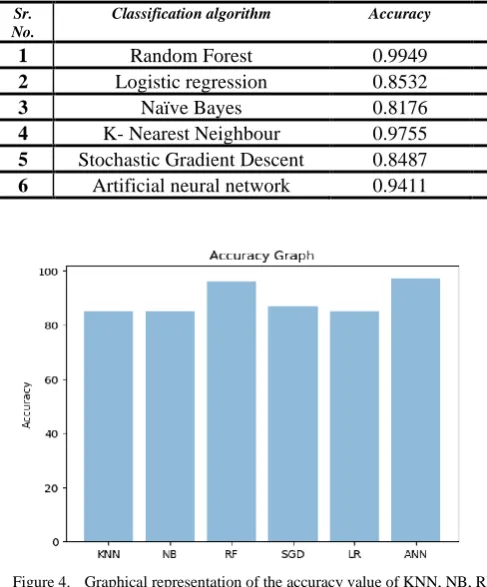
If the AUC value is high, the model performance is high and vice versa. Here we compared the AUC-ROC graphs it was observed that the AUC value of RF is more compared to ANN, LR, KNN which again indicates the higher accuracy of RF machine learning algorithm. The highest accuracy of a class using mentioned classifiers will help to determine more accurately that which are the patients may have heart disease.
Table III. Accuracy and Kappa value chart of all the models.
Sr. No.
Classification algorithm Accuracy Recall Precession F1 Kappa
1 Random Forest 0.9949 1 0.99 1 0.9804
2 Logistic regression 0.8532 0.99 0.86 0.92 0.1063
3 Naïve Bayes 0.8176 0.94 0.86 0.90 0.1244
4 K- Nearest Neighbour 0.9755 0.99 0.98 0.99 0.9048
5 Stochastic Gradient Descent 0.8487 0.98 0.86 0.92 0.1405
[image:5.595.34.278.302.596.2]6 Artificial neural network 0.9411 1 0.94 0.97 0.7240
Figure 4. Graphical representation of the accuracy value of KNN, NB, RF, SGD, LR, ANN
V. CONCLUSION
According to the work done in this paper it can be concluded that there is huge opportunity for machine learning algorithms. Random forest gives us a accurate value compared to other algorithms and the least one is Linear Regression .Random Forest creates decision tree of data sets which gives us a correct performance of prediction from each of them and the models of linear regression creates the prone to outliers and noise, when analyzed in graph it as to be removed and also it leads to over fit when observations are lesser then features. The model of ANN is slightly better than KNN because ANN has the capacity to accumulate the information in entire network and it can also able to work with incomplete
information which is not possible with KNN and ANN provides Distributed memory into chunks of data. When using a large set it does not work with large data in case of KNN and does not do anything with training data as it randomly divides the training data so it is also called as Lazy learning algorithm. Models based on machine learning algorithms and techniques have been very precise to predict the heart related diseases but still there is a lot of scope for the researchers to work and learn how to handle high dimensional data, outliers and over fitting. A bunch of research can also be done on the accurate ensemble of algorithms to make use of some meticulous type of data.
VI. REFERENCES
[1] P. Groves, B. Kayyali, D. Knott, and S. V. Kuiken, “The’big
data’revolution in healthcare: Accelerating value and innovation,” 2016
[2] M. Chen, S. Mao, and Y. Liu, “Big data: A survey,” Mobile
Networks and Applications, vol. 19, pp. 171–209, 2014
[3] J. Wang, M. Qiu, and B. Guo, “Enabling real-time information
service on telehealth system over cloud-based big data platform,” Journal of Systems Architecture, vol. 72, pp. 69–79, 2017.
[4] D. W. Bates, S. Saria, L. Ohno-Machado, A. Shah, and G. Escobar, “Big data in health care: using analytics to identify and manage high-risk and high-cost patients,” Health Affairs, vol. 33, no. 7, pp. 1123–1131, 2014
[5] Helma, C., E. Gottmann, and S. Kramer, “Knowledge discovery
and data mining in toxicology,” Statistical Methods in Medical Research, 2000.
[6] Dhomse Kanchan B and Mahale Kishor M. et al. “Study of
[7] Akram Pasha and P H. Latha; “Bioinspired dimensionality
reduction for Parkinson’s disease (PD) classification” Health Information Science and System, 2020.
[8] Monika Gandhi, Shailendra Narayanan Singh; ‘Predictions in heart disease using techniques of data mining’ International Conference Futuristic trends on Computational analysis and Knowledge Management, 2015.
[9] M. Nikhil Kumar, K. V. S. Koushik, K. Deepak; “Heart diseases
using data mining and machine learning algorithms and tools” International Journal of Scientific Research in Computer Science, Engineering and Information Technology, vol. 3, 2456-3307, 2020.
[10] Mai Shouman, Tim Turner, Rob Stocker, “Applying k-Nearest Neighbour in Diagnosing Heart Disease Patients,” International Journal of Information and Education Technology, 2 (3), 220-223, 2012.
[11] Min Chen, Yixue Hao, Kai Hwang, Fellow, IEEE, Lu Wang, and Lin Wang; “Disease Prediction by Machine Learning over Big Data from Healthcare Communities,” IEEE access, 2017.
[12] Shan Xu, Tiangang Zhu, Zhen Zang, Daoxian Wang, Junfeng Hu and Xiaohui Duan et al. “Cardiovascular Risk Prediction Method Based on CFS Subset Evaluation and Random Forest Classification Framework”, IEEE 2nd International Conference on Big Data Analysis, 2017.
[13] Mitali S Mhatre, Dr.Fauzia Siddiqui, Mugdha Dongre, Paramjit Thakur; “A Review paper on Artificial Neural Network: A Prediction Technique,” International Journal of Scientific & Engineering Research, Volume 6, Issue 12, December-2015.
[14] Zhang, G.; Patuwo, B.E.; Hu, M.Y. “Forecasting with artificial neural networks: The state of the art” International Journal Forecast, 14, 35–62, 1998.