1528
Implementation Of An Efficient Hybrid
Classification Model For Heart Disease
Prediction
Manjari Agarwal, Dr. Gaurav Kumar Ameta
Abstract: The prediction analysis is applied for predicting future possibilities based on the current information. Prediction for future possibilities has been made feasible following three major steps named as pre-processing, feature extraction and classification, in today’s perspective. My research exhibits the work in two stages to increase the accuracy of prediction regarding cardiac issues. Whereas in the first stage, a novel method was proposed in which factors like pulse rate, cholesterol etc. are included along with the age of patient as compared to the previous research study in which only age was taken as a primary attribute for prediction. The primitive attributes are changed in the proposed study for better predictions to receive facts as compared to the older technique. In stage second, a new and efficient hybrid classification model was designed, which is the combination of two different classification methods i.e. support vector machine and k-Nearest Neighbour. The support vector machine (SVM) will extract the features of the dataset and k-Nearest Neighbour classifier will generate the final classified result. The performance of the proposed model in terms of accuracy and execution time is higher as compared to existing method.
Index Terms: Classification Techniques, Data Mining, Heart Disease Prediction, k-Nearest Neighbor (k-NN), Prediction Analysis, Support Vector Machine (SVM), Supervised Machine Learning.
—————————— ——————————
1 INTRODUCTION
A computer program in machine learning, acquire knowledge from by practicing data mining related tasks such that prediction and classification. It takes input from an environment to improve the performance by learning. The machine learning is the skill in which machine can learn from the earlier experience and forecast new values based on learning. The prediction analysis is the approach in which impending events and possibilities can be predicted by using the existing information. The heart disease prediction is the approach in which numerical tools are used to predict heart problem possibilities based on the existing info of patient. In order to get higher accurate results, pre-processing, feature extraction and classification are used to analyze heart disease data. The extraction of stimulating knowledge and patterns to examine data is known as data mining. Various data mining tools are available for analyzing different types of data. A proper analysis of huge data is required to get the fruitful results. Classification, Association rule mining, Sequence Analysis and Predictions are the major outcomes produced as a result of the data mining process.
In the data mining process, Classification is widely used method. It is used to classify the data on the basis of constraints and group the data into the dataset to predict the label of future data. Classification technique can manipulate efficiently the large set of data into a class labels or groups in such a manner that objects with maximum similarity remains in the same set. Classification techniques of data mining can estimate categorical or discrete data for dealing newly obtainable test data on the basis of model, built by using
existing defined class labels as training data set. As training data set of records is available with assigned group labels, classification technique is fall under the supervised learning. The basic components of classification learning are:
1. Task (T): A set of input instances to get a set of prediction as an output.
2. Performance (P): Defines the probability of wrong predictions i.e. accuracy.
3. Experience (E): That is a set of categorized samples for (x, y) where y is true for sample x.
Y =f(x) (1)
Classification models that can be used in the data mining for the prediction of heart disease are given below:
1) Support Vector Machine
2) Neural Networks
3) k-NN Classifier
1.1 Support Vector Machine
SVM is supervised learning process of classifying data into labels. The dataset is first used to train SVM about classes and after that SVM is capable of classifying new data. SVM is centered on numerical learning theory and organizational risk minimization standard. SVM learns to determine the hyperplane to separate two classes i.e. evaluating the location of decision margins to get the best parting of labels. The distance between the hyperplane and the two nearby attributes from the all corresponding classes is termed as margin. A hyperplane function can be defined as simple as equation of line in two dimensional spaces and can be complex when shifting towards higher dimensions. For defining hyperplanes in higher dimensions SVM uses kernel tricks which can be quadratic equations for separating non separable labels into separable labels. When there are outliers in dataset, SVM ignores these outliers and select decision margin to get best hyperplane to classify labels
————————————————
Manjari Agarwal, pursuing master’s degree program in computer engineering, Pacific Institute of Technology & Science Udaipur, India. E-mail: [email protected]
1529 1.2 Neural Networks
In the Neural network large numbers of elements are organized in different number of layers that are interconnected to each other. Through this approach, the adaptive non-linear data processing algorithms are applied that help in integrating all the multi-processing units. On the basis of the properties like logically adjusting and self-organizing, categorization of these networks is done. The input and feedbacks are also generated from the ecosystem that provides potential results. With the help of input layer dissimilar patterns are engendered and these patterns produce the final output layer by interacting with one or more hidden layer. Due to the learning rule present in the Artificial Neural Network, the modification in the weight of connections is done. Input layer, hidden layer and output layer are the three layers present in the network. Input layer is also stated as the principal layer and output layer termed as the last layer. A hidden layer is also present between the input and output layer. More than one layer can persist if the problem is with complicated features. Various functions are performed by the neural network by adjusting the value of weight among elements.
1.3 k-NN Classifier
The simple probabilistic classifier relies on Baye’s theorem and better known as k-NN classifier. It is strongly independent from nearest neighbour assumption. The k-nearest neighbor classifier will compute the likeness between the different points of the samples based on the Euclidian distance. The class which has least Euclidian distance, the data is belonged to that particular class. K-NN classifiers are trained to work in supervised learning.
In the section 2 a brief review of work done by various researchers in disease prediction has been compiled. In the Section 3 research methodology is elaborated in which functionality of the proposed method is discussed along with the detailed flowchart and algorithm. In the Section 4, the result and discussion is discussed.
2
L
ITERATURER
EVIEWDecision making, market basket analysis, production control, customer retention, scientific discovers and education systems are some of the applications that use data mining in order to analyze the collected information [1]. The multimedia, object relational, relational and data warehouses are some of the databases for which data mining has been studied. Supervised and unsupervised learning [2] are the two methodologies utilized by the data mining. In order to learn the parameters of the model, a training set is utilized in supervised learning while in case of unsupervised learning no training set is required [3], for example k-means clustering. Classification and prediction are the main objective of the data mining [4]. In the classification of data mining, the SVM approach is considered as the most powerful technique. In this method all the models build in the form of tree structure. Datasets are broken down into small sets and associated decision tree is constructed. In case of different attributes order is determined by the decision trees and on the basis of attributes a decision is taken [5]. In the Neural network large numbers of elements are organized in different number of layers that are interconnected to each other. Through this approach, the adaptive non-linear data processing algorithms are applied that assist in integrating all the multi-processing units. Characterization of these networks
1530 defines final results quality.
3 METHODOLOGY
The prediction analysis is the technique in which upcoming likelihoods can be predicted based on the existing dataset. Similar and dissimilar data is grouped together on the basis of their likeness in the k-mean clustering technique. The arithmetic mean is calculated from the existing dataset to find the center point or centroid. The similar and dissimilar points are clustered into altered clusters by using the Euclidean distance which is the difference between the centroid and the two neighbouring points. The Euclidian distance is evaluated vigorously using back propagation algorithm which clusters the uncluttered points and increase accuracy of clustering.
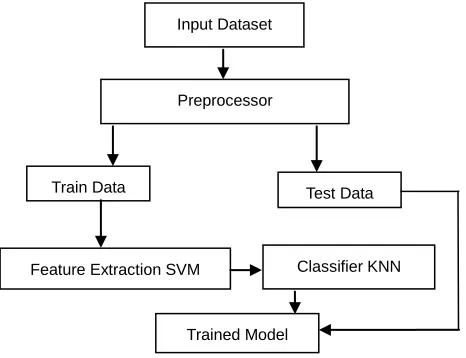
Figure 1 represents the framework used for hybrid classification method. In the first preprocessing phase the dataset is given as input to preprocessor to remove the missing values and redundant values.
Fig. 1 Framework for hybrid classification method
The dataset is taken as an input from the UCI repository. Table 1 is used to describe the parameters and values of dataset.
Table 1 Dataset Description
Parameters Values
Data Set Characteristics Multivariate
Attribute Characteristics Categorical, Integer, Real
Associated Tasks Classification
Number of Instances 303
Number of Attributes 75
Missing Values Yes
The dataset has the 303 number of instances with 75 attributes. The 13 attributes are considered as input attributes i.e. age, sex, chest pain, blood pressure, serum cholesterol, fasting blood sugar, electrocardio graphic, max heart rate, induced angina, ST depression, slope, no of vessels, thal and diagnosis is considered as predictable attribute. The missing values, duplicate values and inconsistent values are resolved. Then preprocessed data is splitted randomly into Training data set (212 instances) and Test data set (91 instances).The
approach of SVM classifier is applied for the feature extraction. In the feature extraction relationship is established between the attribute and the target set. The SVM classifier will draw the hyper plane; the hyper plane will classify the data into certain classes according to the classes in the targetset. The method in which N various classifiers are generated, one for each class is known as one-against-rest method. In this method a sample is assigned as positive if it belongs to the same class and for the rest classes it assigned as negative. In equation 3 a two-class classifier is generated across a feature
vector . The input features and the class of data are
paired to derive this feature vector. The class is selected by the classifier at the test time.
(2)
There is a gap between the value of correct class and the value of nearest other class. It is defined by margin achieved during training. In the last phase, the classification approach will be applied for the heart disease prediction. The approach of k-NN classification is applied for the heart disease prediction. The k-NN classifier will define the number of centroid points and from the centroid points Euclidian distance is calculated. The points which have similar distance will be classified as members of one class and rest into another class. The classification result will define the heart disease predicted values. Depending upon the Euclidean distance that exists between a test sample and the particular training samples, the value of k-nearest neighbor classifier is calculated. Below equation defines the Euclidean distance that exists between sample xi and xj (j=1,2,.…,n) as:
(3)
All the neighboring points that are closest to every sample are encapsulated by the Voronoi cell. The equation 4 defines this Voronoi cell, which is represented as Ri for sample xi. All the points that possibly exist in the Voronoi cell Ri are represented by xi.
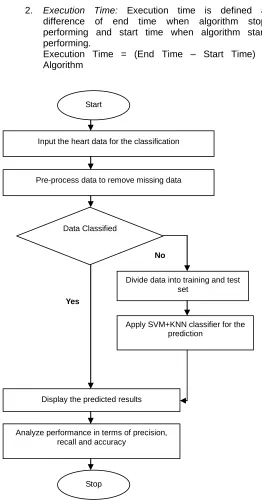
Figure 2 represents the flow chart for hybrid method. SVM classifier is applied to classify the data in the linear hyper plane to map the attributes on each other. Classified data is then applied on k-NN data mining techniques to trained data for prediction. Results are analyzed in terms of precision, recall and accuracy. The Dataset is the multi variant in type which is preprocessed for the prediction analysis in the step one. In step two the input dataset is divided into training and testing data. The hybrid classification model which is the combination of SVM and k-NN is applied for the prediction analysis in step three. In the last step, two parameters which are accuracy and execution time are used for the performance analysis. The formula of the accuracy and execution time is explained below:
1. Accuracy: Accuracy is defined as the ratio of properly classified number of points to the total number of points multiplied by 100.
Accuracy = (Number of points classified correctly /Total number of points) * 100
Input Dataset
Train Data Test Data
Feature Extraction SVM Classifier KNN
1531 2. Execution Time: Execution time is defined as
difference of end time when algorithm stops performing and start time when algorithm starts performing.
Execution Time = (End Time – Start Time) of
Algorithm
No
Yes
Fig. 2 Proposed Flowchart for hybrid algorithm of heart disease prediction
A Novel Hybrid Algorithm for Heart Disease Prediction Using k-NN and SVM Classifier
Input: Training Dataset T
Output: A class of Testing Dataset
Steps:
1. Read the Training Dataset T;
2. Extract features of the Training dataset T;
3. Apply cross validation for the data division;
4. Divide Dataset set into training and testing data;
5. Apply SVM classifier
5.1. Read the training dataset T
5.2. Calculate the mean and standard deviation of
predictor variable in each class
5.3. Repeat
5.3.1 Calculate the probability of f(i) using gauss
density equation in each class
5.3.2. Until the probability of all predictors variable
(f1, f2 upto fn) has been calculated
6. Calculate the likelihood for each class
7. Get the greatest likelihood
8. Apply k-NN Classifier
8.1. Read the training dataset T
8.2. for each slave agent do
8.2.1. for i, j=1 to m do
If D(SVj<SVi)<Hyperplane(SVj<SVi)
Update SVj
End if
End for
End for
4 R
ESULT AND DISCUSSIONThis research work is related to heart disease prediction. The two classifiers are applied for the heart disease prediction which is k-NN and hybrid classification. The hybrid classification is the combination of SVM and k-NN. The performance of k-NN and hybrid classifier is compared in terms of accuracy and execution time. As we first apply SVM classifier to draw a hyper plane between train data and target data.
Figure 3 shows the performance analysis in the terms of accuracy. The accuracy of the hybrid classifier is 91.80% which is higher as compared to the accuracy of k-NN classifier which is 83.61%.
Fig. 3: Accuracy Analysis of Hybrid Method Start
Input the heart data for the classification
Pre-process data to remove missing data
Data Classified
Divide data into training and test set
Apply SVM+KNN classifier for the prediction
Display the predicted results
Analyze performance in terms of precision, recall and accuracy
1532 As shown in Table 2, for train data (212 records) by using
hybrid classifier we get Train accuracy of 92.26% which is higher from the Train accuracy 86.19% of k-NN classifier. By extracting the features of trained dataset by SVM classifier the model is fit to k-NN classifier for prediction analysis. As for selection of parameter k the model is best for k=4. Now the mapped data is passed through the k-NN classifier and get the Test accuracy of 91.80% which is higher than the Test accuracy of 83.61% of existing model.
Table 2
Comparison of k-NN and Hybrid classifier on the basis of accuracy
K=4 Train Accuracy Test Accuracy
k-NN Model 86.19% 83.61%
Hybrid Model (SVM+k-NN)
92.26% 91.80%
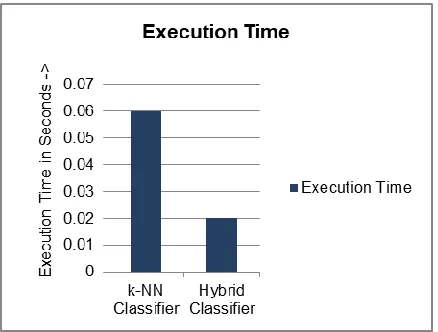
Figure 4 illustrates the comparison of execution time for k-NN classifier and hybrid classification methods. The execution time of hybrid classifier is 0.02 second which is low as compared to k-NN classifier 0.06 second.
Fig. 4: Execution Time Analysis of Hybrid Method
5 C
ONCLUSIONIn this paper, it is found that heart disease prediction is the major issue of the prediction analysis due to large number of attributes. The efficient prediction analysis is the combination of feature extraction and classification. The SVM classifier is applied in this work for the feature extraction. The extracted features are given as input to k-NN classifier for the generation
of predicted results. The proposed methodology is
implemented in python and results are analyzed in terms of accuracy and execution time. It is concluded that with using hybrid classifier accuracy is improved up to 8 percent and execution time is reduced to 4 percent.
R
EFERENCES[1] Abdelghani B. and Erhan G., “Predicting Breast
Cancer Survivability Using Data Mining Techniques”, Washington DC 20052, vol. 6, pp. 234-239, (2010). [2] Oyelade O. J., Oladipupo O. O. and Obagbuwa I. C.,
“Application of k-Means Clustering algorithm for prediction of Students”, Academic Performance, International Journal of Computer Science and Information Security, vol. 7, 2010, pp. 123-128, (2010).
[3] Azhar R., Mahfooz, Shah K. and Huma J., “Enhanced
K-Mean Clustering Algorithm to Reduce Number of Iterations and Time Complexity”, Middle-East Journal of Scientific Research, vol. 12, pp. 959-963, (2012). [4] Osamor V. C., Adebiyi E. F., Oyelade J. O., and
Doumbia S., “Reducing the Time Requirement of
K-Means Algorithm”, PLoS ONE, vol. 7, 2012, pp-56-62, (2012).
[5] Azhar R., Sheeba, Saeed M., Shah K. and Huma J., “Enhanced K-Mean Clustering Algorithm to Reduce Number of Iterations and Time Complexity”, Middle-East Journal of Scientific Research, vol. 5, pp. 959-963, (2012).
[6] Agrawal K. C. and Nagori M., “Clusters of Ayurvedic Medicines Using Improved K-means Algorithm”, International Conf. on Advances in Computer Science and Electronics Engineering, vol. 23, pp. 546-552, (2013).
[7] Chen M., Hao Y., Hwang K., Wang L., and Wang L., Disease Prediction by Machine Learning over Big Data from Healthcare Communities, IEEE, vol. 15, pp- 215-227, (2017)
[8] Yadav A. K,, Tomar D. and Agarwal S., “Clustering of
Lung Cancer Data Using Foggy K-Means”,
International Conference on Recent Trends in Information Technology (ICRTIT), vol. 21, pp.121-126, (2014).
[9] Chakrabotry S., Prof. Nigwani N. K. and Dey L.,
“Weather Forecasting using Incremental K-means Clustering”, vol. 8, pp. 142-147, (2014).
[10]Chew L. S., Ibrahim B., D. H., Hossain D. E. and
Hossin B. M., “Student performance analysis system
(SPAS)”, Information and Communication Technology for The Muslim World (ICT4M), The 5th International Conference on, vol.15, pp.1-6, (2014).
[11]Qasem A., Al-Radaideh, Assaf A. A. and Alnagi E., “Predicting Stock Prices Using Data Mining Techniques”, The International Arab Conference on Information Technology (ACIT’2013), vol. 23, pp. 32-38, (2013).
[12]Rajalakshmi K., Dr. Dhenakaran S. S. and Roobin N.,
“Comparative Analysis of K-Means Algorithm in Disease Prediction”, International Journal of Science, Engineering and Technology Research (IJSETR), Vol. 4, pp. 1023-1028, (2015).
[13]Bala S. V., Devi T. and Saravan N., “Development of a
Data Clustering Algorithm for Predicting Heart”, International Journal of Computer Applications, vol. 48, pp. 423-428, (2012).
[14]Kaur D. and Jyot K., “Enhancement in the
Performance of K-means Algorithm”, International Journal of Computer Science and Communication