!
"
#
$#$
!% & &$
'
(
))) *
ISSN No. 0976-5697
An Efficient Network Intrusion Detection using Information Gain and Hierarchical
Clustering
S.Sethuramalingam*
Associate Professor and Head, Department of Computer Science
Aditanar College, Tiruchendur, India [email protected]
Dr.E.R. Naganathan
Professor and Head
Department of Computer Applications Velammal Engeering College,
Chennai. India
Abstract:With high dimensionality data the classification may lead to wrong results and also needs more resources especially in terms of time by considering all the features of the data set. The redundancy and inconsistency present in the data set result in the misclassification and also increase time and other resource utilization. In order to improve the efficiency of intrusion detection eliminates those features which are redundant and inconsistent. In this paper, we have proposed a new algorithm to identify the significance of features based on the Information Gain. Clustering and Hierarchical Clustering are carried out on features which are more relevant. Hierarchical clustering has yielded better performance. The experiment is conducted with NLS-KDD network intrusion data set. It classifies the data set with good accuracy.
Keywords: Intrusion, Anomaly, Misuse, Hierarchical Clustering, Information Gain
I. INTRODUCTION
Intrusion detection is a critical component of secure information systems. There are two main intrusion detection systems - Anomaly intrusion detection system and misuse intrusion detection system. The first one is based on the profiles of normal behaviour of users or applications and checks whether the system is being used in a different manner. The second one collects attack signatures, compares behaviour with these attack signatures and signals intrusion when there is a match.
Classification depends on the features that adequately characterize the objects of interest. The task of identifying the features that perform well in a classification algorithm is a difficult one, and the optimal choice can be non-intuitive; features that perform are poor separately. They can often prevail when paired with other features. Many different approaches and techniques were discussed [1]. The filter approach [2] to feature selection tries to infer which features will work for the classification algorithm by drawing conclusions from the observed distributions (histograms) of the individual features. However the histograms give a very little insight into the separation between polyps and non-polyps. The correlation structure of the data is responsible for the success of the joint classifier, and a good classification scheme will attempt to utilize this structure.
Another technique, known as wrapper feature selection [3], uses the method of classification itself to measure the importance of a feature or a feature set. The goal in this approach is maximizing the predicted classification accuracy. This approach is computationally more expensive and tends to provide better results than the simple filter methods.
Most of the existing works are focused on the wrapper mode using different classifier methods such as neural networks, SVM, K-NN etc., In this paper features are selected with information gain and the clustering and hierarchical clustering
are carried out to classify the data sets into normal and anomaly classes.
The remainder of this paper is organized as follows: Section 2 gives a review of related works in the feature selection using Information gain Section 3 describes the proposed methodology, the arrived results are discussed in Section 4 and Section 5 has conclusion and future work.
II. RELATED WORK
There are a number of applications where information gain is used for feature selection including network intrusion detection. However this feature selection along with hierarchical clustering is very few in literature. In [4] the authors have proposed an Intrusion Detection
results. Information gain method and Support Vectors Machines are also used for selecting most discriminative ones. However Hierarchical clustering was not applied. In the proposed method Hierarchical clustering is applied on the selected set of features. The dataset used in this work is NSL-KDD data set
III. METHOOLOGY
The main goal of this work is to use information gain to identify the significance of features and then a set of significant features are selected using the proposed algorithm. Using the selected set of features Clustering is performed on the data set and Hierarchical clustering is also performed at the service level. In both the cases, clustering with the selected set of features has yielded good results than that of all the features put together. Further, hierarchical clustering has shown better performance than clustering. The dataset contains 42 features. The features are numbered from 1 to 42 in the data set. The first 41 features contain details about the connection features. The last one described the nature of the connection record, whether it belongs to anomaly or normal. Using NSL-KDD dataset [8] the experiment is conducted.
A. The Data set
Since 1999, KDD’99 [2] has been the most wildly used data set for the evaluation of anomaly detection methods. This data set is prepared by Stolfo et al. [10] and is built based on the data captured in DARPA’98 7 weeks of network traffic, which can be processed into about 5 million connection records, each with about 100 bytes. The two weeks of test data have around 2 million connection records. KDD training dataset consists of approximately 4,900,000 single connection vectors each of which contains 41 features and is labeled either normal or an attack, with exactly one specific attack type.
The first important deficiency in the KDD data set is the huge number of redundant records. Analyzing KDD train and test sets [11], they found that about 78% and 75% of the records are duplicated in the train and test set respectively. This large amount of redundant records in the train set will cause learning algorithms to be biased towards the more frequent records, and thus prevent it from learning unfrequented records which are usually more harmful to networks such as U2R attacks. The existence of these repeated records in the test set, on the other hand, will cause the evaluation results to be biased by the methods which have better detection rates on the frequent records.
In addition, to analyze the difficulty level of the records in KDD data set, the authors employed 21 learned machines (7 learners, each trained 3 times with different train sets) to label the records of the entire KDD train and test sets, which provides us with 21 predicted labels for each record. Surprisingly, about 98% of the records in the train set and 86% of the records in the test set were correctly classified with all the 21 learners. The reason for getting these statistics on both KDD train and test set is that in many papers, random parts of the KDD train set are used as test sets. As a result, they achieve about 98% classification rate applying very simple machine learning methods. Even applying the KDD test set will result in having a minimum classification rate of 86%, which makes the comparison of IDSs quite difficult since they all vary in the range of 86% to 100%.
The new version of KDD data set NSL-KDD, is publicly available for researchers through the website [8]. Although, the data set still suffers from some of the problems discussed [11] and may not be a perfect representative of existing real networks, because of the lack of public data sets for network-based IDSs, the authors believe that it still can be applied as an effective benchmark data set to help researchers compare different intrusion detection methods. In this work NSL_KDD dataset is used.
B. The proposed approach
The data set NSL-KDD is used to test the performance of the proposed method. In the data set KDD20train.ariff consists of 25,192 records. The number of records which belongs to TCP protocol is 20526 records and that of UDP and ICMP are 3011 and 1655 respectively.
The data set has 42 features. The first 41 features describe the characteristics of connection record. The last feature is labeled either normal or anomaly. Four features of the 41 are described using discrete values. The remaining features are described using continuous values. The continuous values are separated using equal interval method.
In order to remove the influence of dimensions, the data set needs to be normalized first. Information gain for each feature is computed. Set of features are selected based on the proposed algorithm. The data set is clustered at protocol level then at the service level.
C. Data Standardization
We first standardize the data set [12]. A collection of numeric data is standardized by subtracting a measure of central location such as mean and divided by some measure of spread such as standard deviation. This yields data with similar shaped histogram with values centered on zero.
k ik ik
s
x
x
x
'
=
−
(i=1,2,…n,k=1,2..m) (1)In “(1)” where
x
is the mean value and sk is the standard deviation of the kth dimension. m is the number of rows and n is the number of columns
=
=
n
i ik
x
n
x
1
1
(2)
2 1
)
(
1
k ik
k
x
x
n
s
n
i
−
=
= (3)
Standardization “(3)” transforms the mean “(2)” of the set of feature values to zero, and the standard deviation to one, but may not be in the interval [0 1]. After the following change “(4)”, it is mapped into the interval [0 1].
}
'
{
min
}
'
{
max
}
'
{
min
'
''
1 1
1
ik n i ik
n i
ik n i ik
ik
x
x
x
x
x
≤ ≤ ≤
≤
≤ ≤ =
−
−
D. Information Gain
The computation of the Information Gain for only one attribute according to the classes is stated as follows: let S be a set of training set samples with their corresponding labels. Suppose there are m classes and the training set contains si samples of class I and s is the total number of samples in the training set expected information needed to classify a given sample is calculated by “(5)”:
I(s1,s2,……sm)=
s
s
s
s
im
i
i
log
2
1 =
−
(5)Feature F with values (f1,f2,f3,……,fv) can divide the training data set into v subsets {S1,S2,…,Sv} where Sj is the subset which has the value fj for the feature F. Furthermore let Sj contain sij samples of class i. Entropy of the feature F is “(6)”
E(F)=
)
.
,...
,
[image:3.612.314.523.125.255.2](
...
2 1 1
3 2
mj j j m
i
mj j
j ij
s
s
s
I
s
s
s
s
s
=
+
+
+
+
−
(6) Information gain “(7)” for F can be calculated like the following:
Gain(F)= I(s1,s2,……sm)-E(F) (7)
The value of the gain as given above computes the information gain of a feature F with regard to all the classes. If we want to measure the gain of the feature for a given class k, we shall consider the problem as binary classification one. We consider two classes: the class normal (sk) and the remaining will constitute another class anomaly (sk’). So the expected Information Gain “(8)” needed to classify a given sample will be:
I(sk,sk’)=
s
s
s
s
s
s
s
s
s
s
k k k k' k'2
log
2
log
−
−
(8)
where k’ denotes the complemented class of the class k. The entropy of a feature F “(9)” according to the class k is
E(F)= mi 1 kj k'j
I
(
s
kj,
s
k'j)
s
s
s
=
+
−
(9)
Information Gain for F ”(10)” can be calculated
Gain(F)=I(sk,sk’)-E(F) (10)
This gain measure gives the significance of the features.
E. Hierarchical Clustering
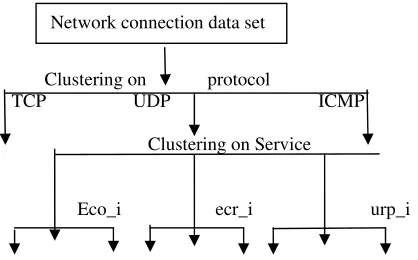
Clustering refers to identifying the number of subclasses of c clusters in a data universe X comprising of n data samples, and partitioning X into c clusters. There are two kinds of c-partitions of data, hard and soft. For numerical data one assumes that the members of each cluster bear more mathematical similarity to each other than to the members of other clusters.. Hierarchical clustering refers to the clustering at different levels. Clustering at the protocol i.e. grouping records based on the protocol value, the records belonging to TCP
forms one cluster, UDP forms another cluster and ICMP forms the third cluster. This is the first level of clustering. Next level is the clustering based on the value of service. In this case within the same protocol records are grouped with same service value as shown in figure1. In this paper clustering and hierarchical clustering are applied.
Clustering on protocol
TCP UDP ICMP
Clustering on Service
Eco_i ecr_i urp_i
Normal Anomaly Normal Anomaly Normal Anomaly
Figure 1: shows the hierarchical level used
One important issue to consider is how to measure the similarity between pairs of observations. One of the simplest similarity measures is distance between pairs of features in the record. In these clustering, Euclidean Distance measure is used to measure the similarity. dik is a Euclidean distance measure between the kth data sample xk and ith cluster center vi is given by “(11)”
2 / 1
1
2
)
(
||
||
)
(
−
=
−
=
−
=
=
n
j
ij kj i
k i k
ik
d
x
v
x
v
x
v
d
(11) Since each data sample requires n dimensions to describe its
location in the dataset, each cluster center also requires n dimensions to describe its location in the data set. Therefore
Vi ={vi1,vi2,……..vin}
where the jth coordinate is calculated by “(12)’
= =
= n
k Xik n
k
xkj Xik
ij
v
1 1
.
(12)
The step by step procedure is given below
1. Fix the number of clusters(c) and initialize the partition (U) matrix
2. Initialize the K cluster centroids. This can be done by arbitrarily dividing all objects into K clusters, computing their centroids and verify that all centroids are different from each other. Alternatively, the centroids can be initialized to K arbitrarily chosen different objects.
3. Iterate over all objects and compute the distances to the centroids of all clusters. Assign each object o the cluster with the nearest centroid.
4. Recalculate the centroids of both modified clusters Network connection data set
5. Repeat step 3 until the centroids do not change any more
F. Algorithm for selection of features
Selection of features from the given set of features to classify anomaly connections and normal connections is given below. The information gain for each feature is computed as discussed in the section D. Arrange the features in the descending order and fix the threshold value. Consider the features one by one and find out which set of features has minimum False Positive and False Negative values. The threshold value used in the experiment is zero. To look ahead to see any value which is more suitable then the present value, the value of cc is used. In the experiment the value of cc is taken as two.
1. sf consists of selected sub set of features. Initially sf is empty
2. Select the first feature from the set of Information Gain(g) and add into sf
3. Call classification algorithm with features in sf. 4. Compute the value of False Positive (fp) and False
negative (fn) and store it into fp(1) and fn(1) 5. Set minfp=fp(1) and minfn=fn(1)
6. For i=second feature to the feature with greater than threshold feature
7. Select the next feature from g and add into sf. 8. Call the classification algorithm
9. compute the value of False Positive and False negative and store it into fp(i) and fn(i) respectively.
10. If fp(i)<minfp and fn(i)<minfn 11. minfp=fp(i)
12. minfn=fn(i) 13. cc=cc+1
14. else if fp(i)<minfp and fn(i)>minfn 15. minfp=fp(i)
16. cc=cc+1
17. else if fp(i)>minfp and fn(i) <minfn 18. minfn=fn(i)
19. cc=cc+1 20. endif 21. If (cc>=2) 22. break 23. endif
24. end for 25. end.
[image:4.612.325.537.123.221.2]A confusion matrix as shown in the Table 1 is typically used to evaluate the performance of the algorithm.
Table 1 Standard metrics for evaluation of intrusions
Confusion Matrix (standard metrics)
Predicted connection label Normal Intrusion
(Anomaly) Actual
connection label
normal True Negative (TN)
False Alarm (FP)
Intrusion (anomaly)
False Negative (FN)
Correctly detected (TP)
From Table 1, recall and precision may be defined as follows Precision=TP/(TP+FP)
Recall=TP/(TP+FN)
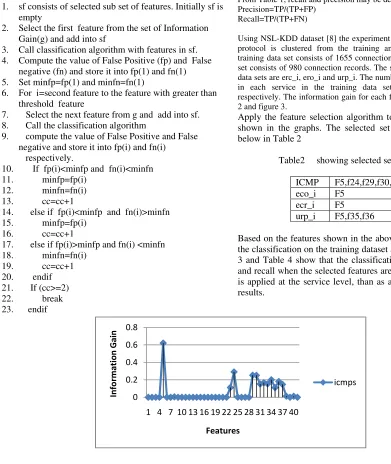
Using NSL-KDD dataset [8] the experiment is conducted. The ICMP protocol is clustered from the training and testing data set. The training data set consists of 1655 connection records and testing data set consists of 980 connection records. The services available in both data sets are erc_i, ero_i and urp_i. The number of connection records in each service in the training data sets is 613,909 and 115 respectively. The information gain for each feature is shown in figure 2 and figure 3.
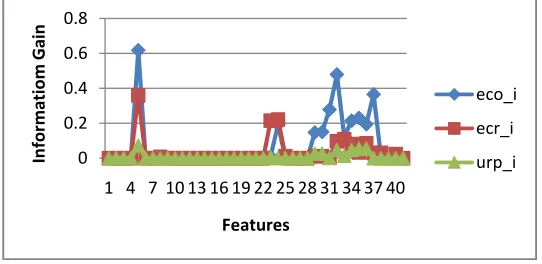
Apply the feature selection algorithm to the Information gain shown in the graphs. The selected set of features are given below in Table 2
Table2 showing selected set of features
ICMP F5,f24,f29,f30,f34,f36 eco_i F5
ecr_i F5 urp_i F5,f35,f36
Based on the features shown in the above table, the results for the classification on the training dataset are given below. Table 3 and Table 4 show that the classification has good precision and recall when the selected features are used. If the clustering is applied at the service level, than as a whole, it yields good results.
[image:4.612.75.466.234.698.2]Figure 3 Line graph showing Information Gain for all features for three different services
[image:5.612.115.500.329.448.2]Table 3 showing the precision and recall value for ICMP with all features and selected features of the Training data set
Table 4 showing the precision and recall value for clustering at the services level with all features and selected features of the Training data set
protocol type service
features Selected
actual predicted precision
recall normal anomaly TN FN FP TP
icmp ecr_i all 38 575 38 0 173 402 0.69913 0.69913
icmp ecr_i f5 38 575 38 0 10 565 0.982609 0.982609
icmp eco_i all 93 816 90 3 37 779 0.954657 0.954657
icmp eco_i f5 93 816 93 0 3 813 0.996324 0.996324
icmp urp_i all 123 1 120 3 0 1 1 1
icmp urp_i f5,f35,f36 123 1 122 1 0 1 1 1
Table 5 showing the precision and recall value for ICMP with all features and selected features of testing data set
[image:5.612.116.497.569.691.2].
Table 6 showing the precision and recall value for clustering at service level with all features and selected features of testing data set
protocol type service
selected features
actual predicted precision
recall normal anomaly TN FN FP TP
icmp ecr_i all 35 666 33 2 56 610 0.915916 0.915916
icmp ecr_i f5 35 666 18 17 36 630 0.945946 0.945946
icmp eco_i all 25 236 24 1 1 235 0.995763 0.995763
icmp eco_i f5 25 236 24 1 0 236 1 1
icmp urp_i all 7 5 7 0 1 4 0.8 0.8
icmp urp_i f5,f35,f36 7 5 7 0 1 4 0.8 0.8
IV RESULTS AND DISCUSSION
In this paper, ICMP connection records are taken for
are used to classify the testing data set. Out of 980 connections in ICMP testing dataset, 912 connections are anomaly and 68 connections are normal. At the service level
protocol type features Selected
actual predicted precision
recall normal anomaly TN FN FP TP
icmp all 261 1394 213 48 235 1159 0.83142 0.83142
icmp f5,f24,29, 30,34,36
261 1394 177 84 101 1293 0.927547 0.927547
protocol type Selected features
actual predicted precision recall normal anomaly TN FN FP TP
icmp all 68 912 55 13 74 838 0.91886 0.91886
icmp f5,f24,29, 30,34,36
connection records, ecr_i has 666 anomaly connection records and 35 normal connection records and urp_i has 5 anomaly connection
Table negative
used to measure the performance of classification. and T
data set shows good performance. In the case of urp_i alone the results from the testing has less value because number of samples present
In this work discriminate feature
From the Results of Table 3, Table 4, Table 5 and Table 6 the classification with selected feature
both at the training and testing.
has better performance than clustering. It is obvious by comparing Table 3 with Table 4 and Table 5 with Table 6. The obtained results show that the
acceptable solution for this problem. can be
the possibilities of other methods of selecting optimal feature set.
to improve the results different
dimensionality reduction
[1] Subbulakshmi .T, Ramamoorthi A. and Mercy Shalinie S. Feature “Selection and Classification of Intrusions Using Genetic Algorithm and Neural Networks” Recent Trends in Networks and Communications” ,Communications in Computer and Information Science, 2010, Volume 90, Part 1,
10.1007/978
[2] John.G, Kohavi.R and Pfleger.K “Irrelevant features and the subset selection problem”, In the 11 International Conference on Machine Learning, pages 121
[3] Kohavi.R and John.G “Wrappers for feature subset selection” Artif
special issue on relevance, pp 273 [4] Pingjie Tang
selection and Design of Intrusion Detection system based on k
Machine”,
Technol., Dalian, China
connection records, ecr_i has 666 anomaly connection records and 35 normal connection records and urp_i has 5 anomaly connection
e 5 shows the
tive, precision and recall
used to measure the performance of classification. Table 6 indicate
data set shows good performance. In the case of urp_i alone the results from the testing has less value because number of samples present
V. CONCLUSION AND FUTURE WORK
In this work, 1) discriminate feature
From the Results of Table 3, Table 4, Table 5 and Table 6 the classification with selected feature
both at the training and testing.
has better performance than clustering. It is obvious by comparing Table 3 with Table 4 and Table 5 with Table 6. The obtained results show that the
acceptable solution for this problem. can be tested for other type protocols
possibilities of other methods of selecting optimal feature set. The other
to improve the results
different type of data sets which are required for dimensionality reduction
Subbulakshmi .T, Ramamoorthi A. and Mercy Shalinie S. Feature “Selection and Classification of Intrusions Using Genetic Algorithm and Neural Networks” Recent Trends in Networks and Communications” ,Communications in Computer and Information Science, 2010, Volume 90, Part 1,
10.1007/978-3-John.G, Kohavi.R and Pfleger.K “Irrelevant features and the subset selection problem”, In the 11 International Conference on Machine Learning, pages 121-129, 1994
Kohavi.R and John.G “Wrappers for feature subset selection” Artif
special issue on relevance, pp 273 Pingjie Tang
selection and Design of Intrusion Detection system based on k-means and Triangle Area Support Vector Machine”, Dept. Comput. Sci. & Eng., Dalian Univ. of Technol., Dalian, China
connection records, ecr_i has 666 anomaly connection records and 35 normal connection records and urp_i has 5 anomaly connection records and seven normal records..
shows the features and their , precision and recall [14
used to measure the performance of classification. indicate that the features used in the training data set shows good performance. In the case of urp_i alone the results from the testing has less value because number of samples present in the data set.
V. CONCLUSION AND FUTURE WORK
1) a new approach for selecting discriminate features using information gain
From the Results of Table 3, Table 4, Table 5 and Table 6 the classification with selected feature
both at the training and testing.
has better performance than clustering. It is obvious by comparing Table 3 with Table 4 and Table 5 with Table 6. The obtained results show that the
acceptable solution for this problem. tested for other type protocols
possibilities of other methods of selecting optimal other types of classification can be to improve the results. The algorithm
of data sets which are required for dimensionality reduction and classification.
VI. REFERENCES
Subbulakshmi .T, Ramamoorthi A. and Mercy Shalinie S. Feature “Selection and Classification of Intrusions Using Genetic Algorithm and Neural Networks” Recent Trends in Networks and Communications” ,Communications in Computer and Information Science, 2010, Volume 90, Part 1,
-642-14493-6_24
John.G, Kohavi.R and Pfleger.K “Irrelevant features and the subset selection problem”, In the 11 International Conference on Machine Learning, pages
Kohavi.R and John.G “Wrappers for feature subset selection” Artificial Intelligence Journal, Volume 97, special issue on relevance, pp 273
Rong-an Jiang
selection and Design of Intrusion Detection system means and Triangle Area Support Vector Dept. Comput. Sci. & Eng., Dalian Univ. of Technol., Dalian, China
connection records, ecr_i has 666 anomaly connection records and 35 normal connection records and urp_i has 5 records and seven normal records..
and their false positive 4, 13, 9] . They used to measure the performance of classification.
that the features used in the training data set shows good performance. In the case of urp_i alone the results from the testing has less value because
the data set.
V. CONCLUSION AND FUTURE WORK
a new approach for selecting
information gain is presented. From the Results of Table 3, Table 4, Table 5 and Table 6 the classification with selected features shows better
2) Hierarchical clustering has better performance than clustering. It is obvious by comparing Table 3 with Table 4 and Table 5 with Table 6. The obtained results show that the approach can find very acceptable solution for this problem. In future, this appro
tested for other type protocols data set and
possibilities of other methods of selecting optimal classification can be he algorithm can be applied of data sets which are required for
classification.
EFERENCES
Subbulakshmi .T, Ramamoorthi A. and Mercy Shalinie S. Feature “Selection and Classification of Intrusions Using Genetic Algorithm and Neural Networks” Recent Trends in Networks and Communications” ,Communications in Computer and Information Science, 2010, Volume 90, Part 1, 223
6_24 springerlink
John.G, Kohavi.R and Pfleger.K “Irrelevant features and the subset selection problem”, In the 11 International Conference on Machine Learning, pages
Kohavi.R and John.G “Wrappers for feature subset icial Intelligence Journal, Volume 97, special issue on relevance, pp 273-324. Dec. 1997
an Jiang Mingwei Zhao
selection and Design of Intrusion Detection system means and Triangle Area Support Vector Dept. Comput. Sci. & Eng., Dalian Univ. of ICFN'10. Second connection records, ecr_i has 666 anomaly connection records and 35 normal connection records and urp_i has 5 records and seven normal records.. false positive, true . They are metrics used to measure the performance of classification. Table 5 that the features used in the training data set shows good performance. In the case of urp_i alone the results from the testing has less value because of the
V. CONCLUSION AND FUTURE WORK
a new approach for selecting the best is presented. From the Results of Table 3, Table 4, Table 5 and Table 6 better results Hierarchical clustering has better performance than clustering. It is obvious by comparing Table 3 with Table 4 and Table 5 with Table 6. can find very , this approach data set and to explore possibilities of other methods of selecting optimal classification can be applied can be applied to of data sets which are required for
Subbulakshmi .T, Ramamoorthi A. and Mercy Shalinie S. Feature “Selection and Classification of Intrusions Using Genetic Algorithm and Neural Networks” Recent Trends in Networks and Communications” ,Communications in Computer and Information 223-234, DOI: springerlink
John.G, Kohavi.R and Pfleger.K “Irrelevant features and the subset selection problem”, In the 11th International Conference on Machine Learning, pages
Kohavi.R and John.G “Wrappers for feature subset icial Intelligence Journal, Volume 97,
324. Dec. 1997 Mingwei Zhao “feature selection and Design of Intrusion Detection system means and Triangle Area Support Vector Dept. Comput. Sci. & Eng., Dalian Univ. of ICFN'10. Second
International Conference on Future Networks, 2010, 22 24 Jan. 2010
[5] Cheng Xiang, Png Chin Yong and Lim Swee Meng “Design of multiple
intrusion detection system using Bayesian clustering and decision trees”
Computer Engineering, National University of Singapore, Singapore 117576, Singapore doi:10.1016/j.patrec.2008.01.008
Elsevier
[6] 6 Latifur Khan, Mamoun Awad and Bhavani Thuraisingham. “A new intrusion detection system using support vector machines and hierarchical clustering”, The vldb journal ,Voloume 16, number 4,507
[7] Provost.F and Fawcett.T, “Robust Classification for Imprecise Environments”, Machine Learning, vol. 42/3 pp. 203
[8] http://nsl.cs.unb.ca/NSL
[9] Claise.B, Bryant.S, Sadasivan.G, Leinen.G, and T. Dietz, “IPFIX Protocol Specications”, Internet work in progress, draft
2006
[10]Lee.W and Stolfo.S, “Data mining approaches for intrusion detection, in
USENIX Security Symposium” 1998
[11]Mahbod Tavallaee, Ebrahim Bagheri, Wei Lu, an A. Ghorbani . “A Detailed Analysis of the KDD CUP 99 Data Set Proceeding of the IEEE Symposium on Computational Intelligence in Security and Defence Applications” (CISDA 09)
[12]Hai Jin Jianhua Sun, Han Chen, Zongfen Han Cluster and Grid Computing Lab.
Science and Technolory, Wuhan 430074 China. “A Fuzzy Data Mining Based Intrusion Detection Model. Proc. Of the 10
Feature Trends of Distributed Computing Systems” (FTDCS’04)@2004 IEEE
[13]13 Joshi.M,
Algorithm to Classify Rare
and Improvements First IEEE International conference on Data Mining” San Jose, CA, 2001
[14]Pingjie Tang
selection and Design of Intrus based on k
Machine”, Dept. Comput. Sci. & Eng., Dalian Univ. of Technol., Dalian, China
International Conference on Future Networks, 2010, 22 24 Jan. 2010
International Conference on Future Networks, 2010, 22 24 Jan. 2010 On page(s):
Cheng Xiang, Png Chin Yong and Lim Swee Meng “Design of multiple
intrusion detection system using Bayesian clustering and decision trees”
Computer Engineering, National University of Singapore, Singapore 117576, Singapore doi:10.1016/j.patrec.2008.01.008
Elsevier
6 Latifur Khan, Mamoun Awad and Bhavani Thuraisingham. “A new intrusion detection system using support vector machines and hierarchical clustering”, The vldb journal ,Voloume 16, number 4,507-521 DOI: 10.1007/s00778
Provost.F and Fawcett.T, “Robust Classification for Imprecise Environments”, Machine Learning, vol. 42/3 pp. 203-231, 2001
http://nsl.cs.unb.ca/NSL
Claise.B, Bryant.S, Sadasivan.G, Leinen.G, and T. Dietz, “IPFIX Protocol Specications”, Internet work in progress, draft
2006
Lee.W and Stolfo.S, “Data mining approaches for intrusion detection, in
USENIX Security Symposium” 1998
Mahbod Tavallaee, Ebrahim Bagheri, Wei Lu, an A. Ghorbani . “A Detailed Analysis of the KDD CUP 99 Data Set Proceeding of the IEEE Symposium on Computational Intelligence in Security and Defence Applications” (CISDA 09)
Hai Jin Jianhua Sun, Han Chen, Zongfen Han Cluster and Grid Computing Lab.
Science and Technolory, Wuhan 430074 China. “A Fuzzy Data Mining Based Intrusion Detection Model. Proc. Of the 10
Feature Trends of Distributed Computing Systems” (FTDCS’04)@2004 IEEE
13 Joshi.M, Kumar.V, Agarwal.R “Evaluting Boosting Algorithm to Classify Rare
and Improvements First IEEE International conference on Data Mining” San Jose, CA, 2001
Pingjie Tang Rong
selection and Design of Intrus
based on k-means and Triangle Area Support Vector Machine”, Dept. Comput. Sci. & Eng., Dalian Univ. of Technol., Dalian, China
International Conference on Future Networks, 2010, 22 24 Jan. 2010 On page(s):
International Conference on Future Networks, 2010, 22 On page(s): 144 –
Cheng Xiang, Png Chin Yong and Lim Swee Meng “Design of multiple-level hybrid c
intrusion detection system using Bayesian clustering and decision trees” aDepartment of Electrical and Computer Engineering, National University of Singapore, Singapore 117576, Singapore doi:10.1016/j.patrec.2008.01.008
6 Latifur Khan, Mamoun Awad and Bhavani Thuraisingham. “A new intrusion detection system using support vector machines and hierarchical clustering”, The vldb journal ,Voloume 16, number
10.1007/s00778
Provost.F and Fawcett.T, “Robust Classification for Imprecise Environments”, Machine Learning, vol. 42/3
231, 2001
http://nsl.cs.unb.ca/NSL-KDD/
Claise.B, Bryant.S, Sadasivan.G, Leinen.G, and T. Dietz, “IPFIX Protocol Specications”, Internet work in progress, draft-ietfip_x
Lee.W and Stolfo.S, “Data mining approaches for intrusion detection, in Proceedings of the 7th USENIX Security Symposium”
Mahbod Tavallaee, Ebrahim Bagheri, Wei Lu, an A. Ghorbani . “A Detailed Analysis of the KDD CUP 99 Data Set Proceeding of the IEEE Symposium on Computational Intelligence in Security and Defence Applications” (CISDA 09)
Hai Jin Jianhua Sun, Han Chen, Zongfen Han Cluster and Grid Computing Lab. Huazhong University of Science and Technolory, Wuhan 430074 China. “A Fuzzy Data Mining Based Intrusion Detection Model. Proc. Of the 10th IEEE International Workshop on Feature Trends of Distributed Computing Systems” (FTDCS’04)@2004 IEEE
Kumar.V, Agarwal.R “Evaluting Boosting Algorithm to Classify Rare
and Improvements First IEEE International conference on Data Mining” San Jose, CA, 2001
Rong-an Jiang selection and Design of Intrus
means and Triangle Area Support Vector Machine”, Dept. Comput. Sci. & Eng., Dalian Univ. of Technol., Dalian, China
International Conference on Future Networks, 2010, 22 On page(s): 144 –
International Conference on Future Networks, 2010, 22 – 148
Cheng Xiang, Png Chin Yong and Lim Swee Meng level hybrid classifier for intrusion detection system using Bayesian clustering Department of Electrical and Computer Engineering, National University of Singapore, Singapore 117576, Singapore doi:10.1016/j.patrec.2008.01.008 Copyright © 2
6 Latifur Khan, Mamoun Awad and Bhavani Thuraisingham. “A new intrusion detection system using support vector machines and hierarchical clustering”, The vldb journal ,Voloume 16, number
10.1007/s00778-006-0002-5
Provost.F and Fawcett.T, “Robust Classification for Imprecise Environments”, Machine Learning, vol. 42/3
KDD/
Claise.B, Bryant.S, Sadasivan.G, Leinen.G, and T. Dietz, “IPFIX Protocol Specications”, Internet
ietfip_x-protocol
Lee.W and Stolfo.S, “Data mining approaches for Proceedings of the 7th USENIX Security Symposium”, San Antonio, TX,
Mahbod Tavallaee, Ebrahim Bagheri, Wei Lu, an A. Ghorbani . “A Detailed Analysis of the KDD CUP 99 Data Set Proceeding of the IEEE Symposium on Computational Intelligence in Security and Defence
Hai Jin Jianhua Sun, Han Chen, Zongfen Han Cluster Huazhong University of Science and Technolory, Wuhan 430074 China. “A Fuzzy Data Mining Based Intrusion Detection Model. IEEE International Workshop on Feature Trends of Distributed Computing Systems”
Kumar.V, Agarwal.R “Evaluting Boosting Classes: Comparison and Improvements First IEEE International conference on Data Mining” San Jose, CA, 2001
Mingwei Zhao
selection and Design of Intrusion Detection system means and Triangle Area Support Vector Machine”, Dept. Comput. Sci. & Eng., Dalian Univ. of ICFN'10. Second International Conference on Future Networks, 2010, 22
– 148
International Conference on Future Networks, 2010,
22-Cheng Xiang, Png Chin Yong and Lim Swee Meng lassifier for intrusion detection system using Bayesian clustering Department of Electrical and Computer Engineering, National University of Singapore, Singapore 117576, Singapore Copyright © 2008
6 Latifur Khan, Mamoun Awad and Bhavani Thuraisingham. “A new intrusion detection system using support vector machines and hierarchical clustering”, The vldb journal ,Voloume 16, number
Provost.F and Fawcett.T, “Robust Classification for Imprecise Environments”, Machine Learning, vol. 42/3
Claise.B, Bryant.S, Sadasivan.G, Leinen.G, and T. Dietz, “IPFIX Protocol Specications”, Internet-Draft, protocol-24, Nov.
Lee.W and Stolfo.S, “Data mining approaches for Proceedings of the 7th , San Antonio, TX,
Mahbod Tavallaee, Ebrahim Bagheri, Wei Lu, and Ali A. Ghorbani . “A Detailed Analysis of the KDD CUP 99 Data Set Proceeding of the IEEE Symposium on Computational Intelligence in Security and Defence
Hai Jin Jianhua Sun, Han Chen, Zongfen Han Cluster Huazhong University of Science and Technolory, Wuhan 430074 China. “A Fuzzy Data Mining Based Intrusion Detection Model. IEEE International Workshop on Feature Trends of Distributed Computing Systems”
Kumar.V, Agarwal.R “Evaluting Boosting Classes: Comparison and Improvements First IEEE International conference