International Journal of Advanced Research in Computer Science
RESEARCH PAPER
Available Online at www.ijarcs.info
Time Series Data Analysis for Stock Market Prediction using Data Mining Techniques with R
Mahantesh C. Angadi
M.Tech Student, Dept. of ISE, Acharya Institute of Technology,
Bengaluru, Karnataka, India.
Amogh P. Kulkarni Assistant Professor, Dept. of ISE, Sai Vidya Institute of Technology,
Bengaluru, Karnataka, India.
Abstract: Nowadays, the stock market is attracting more and more people's notice with its high challenging risks and high return over. A stock exchange market depicts savings and investments that are advantageous to increase the effectiveness of the national economy. The future stock returns have some predictive relationships with the publicly available information of present and historical stock market indices. ARIMA is a statistical model which is known to be efficient for time series forecasting especially for short-term prediction. In this paper, we propose a model for forecasting the stock market trends based on the technical analysis using historical stock market data and ARIMA model. This model will automate the process of direction of future stock price indices and provides assistance for financial specialists to choose the better timing for purchasing and/or selling of stocks. The results are shown in terms of visualizations using R programming language. The obtained results reveal that the ARIMA model has a strong potential for short-term prediction of stock market trends.
Keywords: Time Series Data, Stock Market, Prediction, Analysis, Data Mining, ARIMA, R.
I.INTRODUCTION
Today we live and breathe data. Forecasting the stock exchange data is an important financial subject which involves an assumption that the fundamental information publicly available in the past has some predictive relationships to the future stock returns. Stock market forecasting contains uncovering the market trends, planning investment tactics, identifying the best time to purchase the stocks and which stocks to purchase. A stock exchange or equity business sector is a non-direct, non-parametric framework that is difficult to model with any sensible exactness. It is the mix of speculators who need to purchase or offer or hold a share at a specific time. Prediction will continue to be an exciting locale of research, making scientists in the analytics field always desiring to enhance the existing forecasting models. The motivation is that companies and individuals are empowered to make investment decisions to develop viable system about their future endeavors.
Stock trend forecasting is considered as one of the most difficult tasks to achieve in money related gauging because of the difficulty in the multifaceted world of stock market. Many of the investors in the stock market are finding a technique that could guarantee easy profiting by forecasting the stock trends and minimize the risk of investing. This motivates the researchers in the domain field to delve and develop new forecasting models. Time series data analysis techniques use verifiable information as the premise for evaluating future results. Time series data can be defined as numerical data collected in a particular sequence over a period of time at regular intervals. The time series data can include the values collected at the end of every week, month, quarter, or year etc. The intention is to find if there is any link between the data collected so far and in what way does the data changes. In order to reduce the risk of investment, exchange of securities between the seller and buyer are facilitated by the stock exchanges. A stock exchange is an organization or a place where the stock traders or investors can deal with stocks. Some of the examples for stock market organizations include NASDAQ, NYSE, BSE, NSE etc.
R is a programming language and environment for statistical processing and graphics. The R dialect is generally
utilized among analysts and data excavators for statistical programming and data analysis. R language was created by Ross Ihaka and Robert Gentleman at the University of Auckland, New Zealand and is presently maintained by the R development core team. Amid the most recent decade, the energy originating from both the scholarly world and industry has lifted the R programming dialect to turn into the most essential tool for computational insights, perception and data science. Around the world, a large number of analysts and information researchers use R language to take care of their most difficult issues in the fields going from computational science to quantitative promoting.
R-Studio is a free and powerful integrated development environment for R language. R-Studio allows the user to run R scripts in a more user-friendly environment. R-Studio is available in two editions: R-Studio Desktop, where the program is run locally as a regular desktop application; and R-Studio Server, which allows accessing R-Studio using a web browser while it is running on a remote Linux server. R-Studio is written in the C++ programming language and uses the Qt framework for its graphical user interface. R-Studio has a general console where we can type commands and see output, it has an editor that supports direct code execution and has features of highlighting the syntax, debugging and managing the workspace. R-Studio also has a workspace tab which includes all the active objects, a history tab which shows a list of commands used so far, and the files tab that shows all the files and directories in the default workspace.
The remainder of the paper is organized as follows. Chapter 2 discusses about the literature review of previously published research papers related to forecasting the stock trends. Chapter 3 discusses about the system analysis. Chapter 4 discusses the implementation methodology which is used to predict the stock trends. Chapter 5 includes some of the screen shots of predicted results. We conclude the paper in chapter 6 by providing the ideas for future enhancements in chapter 7. Finally references have been included.
II.LITERATUREREVIEW
by number of researchers. These stock trading rules are developed based on the information related to macroeconomics, ancient data of stock trading. Fundamental analysis techniques assume that the price of a stock depends on its intrinsic values and expected return on investment. Majority of the researchers believe that fundamental analysis techniques are good methods only on a long-term source. Yet, for short-term and medium-short-term speculations technical analysis techniques are preferred as fundamental analysis techniques are not appropriate.
The most efficient way to forecast the future is to understand the present scenarios. The author [Banerjee D] [1] tried to develop an appropriate model that helps to forecast the unseen values of the Indian stock market, based on the information collected on the monthly closing stock indices. Based on the ARIMA model they predict the future stock indices which have the strong performance of the Indian economy. It is very important to understand the present status of the market because for many economists, investors and researchers the Indian stock market is the center of interest. It has been predicted that the performance of the Indian stock market presents a suitable time series ARIMA(1,0,1) model which helps to create the appropriate values of the future indices.
The authors [Li Bing] [Chan] [2] have extracted the ambiguous text through MLP techniques to get the real stock price movements and public sentiments. It has been said that public emotions may be co-related that has shown through Twitter. The authors have used data mining algorithms to mine Twitter data in order to forecast the stock trends using sentimental analysis which comes under fundamental analysis. The estimation of the latest social media analysis works on up-to date public views mining. Through this methodology for social media data mining, it has fulfilled the recognized research problems with adequate experimental results. The algorithm has defined the complete relationships surrounded in social media as a graph with several layers. The top layered attributes and intermediate layered attributes have direct relations; and bottom layered attributes and intermediate layered attribute have in-direct relations.
To forecast stock price trend the authors [Tao Xing] [Yuan Sun] [3] have introduced a method based on Hidden Markov Model. Hidden Markov Model first proposed by Baum and Egon, which is a kind of Markov Chain and is used for the pattern recognition technique. This paper finds the hidden relationship existing between the Hidden Markov Model and stock prices. The experimental results show that, this method can get attractive accurate result, particularly efficient in short period prediction.
It is tedious task for the stock market financial specialists to guesstimate the pattern of the stock exchange costs as effectively as could be allowed to settle on the best exchanging choices. The authors [Vishwanath R Ha] [Leena Sa] [4] have proposed a system called APST, which performs the pre-processing of verifiable stock time arrangement information to produce the grouping of approximated values by utilizing multi-scale segment mean methodology. To locate the closest neighbor objects they utilize the Euclidian separation way to recognize the comparative arrangement of articles. The experimental results of this system show that the executed framework has shown 74% of the exactness.
The authors [Ayodele A] [Adebiyi] [5] have used the ARIMA model to develop an extensive process of building stock price predictive model by obtaining data from NYSE and
NSE. Artificial Neural Networks (ANNs) model is very popular due to its ability to learn patterns from data and infer solution from unknown data. Hybrid approaches also engaged to improve stock price predictive models by exploiting the unique strength of each of them. The results obtained from real-life data demonstrated the potential strength of ARIMA models to provide investors short-term prediction that could aid investment decision making process.
Stock exchange markets facilitate savings and investment that are beneficial to increase the effectiveness of national economy. The author [Li Zhe] [7] have used the method of technical analysis in which trading rules were established based on the ancient data of stock trading price and volume. Technical analysis uses various methods that aim to predict future stock price movements based on the assumption that history repeats itself and future market directions can be determined by examining historical stock prices.
III.SYSTEMANALYSIS
A. Problem Statement
A stock exchange market depicts savings and investments that are advantageous to increase the effectiveness of national economic. The future stock returns have some predictive relationships with the publicly available information of present and historical stock market indices. The investors decide the better time to sell/buy/hold a share in stock market based on the former relationship. Every investor is interested in predicting the future stock prices, whether the investor may be a long-term investor or a day-trader. This possesses a major challenge to design and develop an effective and efficient predictive model that assists the investors to take appropriate decisions.
B. Existing Systems
One of the significant financial subject that has engrossed the researcher’s attention for many years is forecasting the stock returns. Investors in the stock market have been attempting to discover an answer to estimate the stock trends in order to decide the better timing to buy or sell or hold a share. Forecasting the stock trends have been done both on qualitative analysis and quantitative analysis. There are many statistical models available for forecasting stock trends and choosing an appropriate model for a particular forecasting application depends on the format of the data.
C. Proposed Study
In this work we propose a prediction model for the time series stock market data. This model will automate the process of change of stock price indices based on technical analysis and provides assistance for financial specialists to choose the better timing for purchasing and selling stocks. Data mining techniques are used to develop the prediction model and R programming language is used for visualization of results.
IV.IMPLEMENTATION
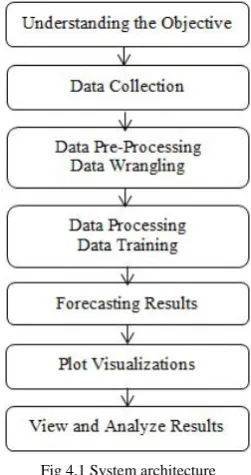
Fig 4.1 System architecture
System architecture is a model that defines the behavior of a system in the conceptual model. The huge systems are decomposed into subordinate systems to provide similar set of services. The beginning layout strategy of perceiving these sub-systems and building up a structure for sub-systems control and cooperation is called architecture design. As shown above, Fig. 4.1 includes seven major steps to implement the system and each step is explained below.
A. Understanding the Objective
The first step in developing a project is to understand the objective which involves an understanding of the intent and essentials of a system. This comprehension is used as a problem description and a preparatory system to accomplish the expectations. The objective of our project is neither to build a system that makes billions nor to waste billions too. But the objective is to develop a system that finds the direction of change of stock price indices based on the co-relations between stock prices and help the investors in the stock market in taking a decision whether to buy/sell/hold a stock by providing the results in-terms of visualizations.
B. Data Collection
Once the understanding of the objective is over, the next step is to collect the data. Data collection involves the understanding of initial observations of the data to identify the useful subsets from hypotheses of the hidden information. Here we use R script to collect the data from Google finance using getSymbols() method of QuantMod package.
• QuantMod
It refers to the Quantitative financial Modeling which is used in financial time series data analysis. QuantMod is the rapid prototyping environment where the quant traders can quickly create and discovery the trading models. To extract and load the data from multiple sources we use a method called getSymbols(). As a source for obtaining the stock market data, most of the stock investors use Google finance or Yahoo finance. We used Google finance to load the data into R by specifying the correct ticker symbol. The OHLC data is
not directly downloaded from the Google finance
(finance.google.com), instead a call to getSymbols(Symbols, src='google') in-turn call this method.
C. Data Pre-processing: Data Wrangling
The data pre-processing stage involves all the activities to prepare the final dataset from the preparatory raw information. The data preparation tasks can be performed several times as there is no specific order. These tasks include the selection of a record, table, attribute and cleaning of data for modeling tools. In our methodology, the input data will be converted into a combined value vector list or differentiated value vector list. So for this purpose we use c{base} that refers to the combined values vector or list.
• Data Frames
A list of variables with same number of rows and distinct row names of a class is defined as a data frame. The row names decide the number of rows, if no variables are involved. The essential and default data structure in R language is ‘data.frames{base}’. Data frames are the collection of variables which are tightly coupled with many properties of lists and matrices. The data frame alters each and every argument data.frame by calling as data.frame(optional= true). The behavior of the arguments can be changed by writing methods according to their classes and also R consists of many such methods.
D. Data Processing: Data Training
To process the data we use ARIMA(p,d,q) model. In technical analysis investors use the auto regressive and moving average models to forecast the stock trends. Major steps involved here are identification, parameter estimation and forecasting. These steps are repeated until an appropriate model is identified for prediction. R provides auto.arima() method to forecast the time series data according to ARIMA(p,d,q).
• Auto Regression (AR)
Auto regression technique estimates the future values based on the previous values. The first order of auto regression process is represented as AR(1), meaning that the immediately preceding values will be based on current value. The current value based on the previous two values is an AR(2) process. The word auto regression says that it is a regression of the variable against itself.
• Moving Average (MA)
A moving average is a technique to find the overall idea within a data set. It finds the future trends based on the previous values. The two commonly used moving average techniques are exponential moving average (EMA) and the simple moving average (SMA).
• Order of ARIMA
The order of an ARIMA model is generally represented as ARIMA(p,d,q), where-
p = order of the autoregressive part d = degree of first differencing involved q = order of the moving average part
Here if d=0, then the model becomes ARMA which is linear stationary model.
• Model Estimation for ARIMA
[image:4.595.87.241.95.265.2]Model estimation for ARIMA can be achieved based on the pre-processed historical data.
Fig. 4.2 Model Estimation for ARIMA(p,d,q)
In ARIMA model, the identification is to be accomplished using auto co-relation function and partial auto co-relation function in order to identify p, d and q standards. For any realistic time sequence generally p, d and q values vary between 0 and 2, but model estimation is executed for all probable combinations of p, d and q values. The pictorial representation of these steps is shown in Fig. 4.2.
• ARIMA() Function in R
The auto.arima() is a very useful function in R, but anything automated can be a little dangerous. This function examines over conceivable models within the edict limitations provided and returns the best ARIMA model. The value of d also has an effect on the prediction intervals i.e., the more complex the value of d, the more rapidly forecasting intervals surge in size. For d=0, the long-term prediction average deviance will go to the typical deviance of the historic data. It is usually not possible to tell merely from a time plot, what values of p and q are suitable for the specific kind of data. Sometimes it is conceivable to use the ACF plot and closely related PACF plot to govern the appropriate values.
[image:4.595.333.547.257.461.2]• Special Cases of ARIMA Model
Table 4.1 Special Cases of ARIMA Model
E. Forecasting Results
The process of making predictions of the future by relying upon the past and present data is known as forecasting. Various prediction techniques are used by the stock analysts to evaluate the future stock trends value. Prediction also offers a significant standard for organizations that have a long-term perception of actions. We use ‘forecast’ package for predicting the future stock trends based on the analysis of past trends. This ‘forecast’ package provides a number of forecasting functions for displaying the time series predictions along with exponential smoothing and space models.
F. Plot Visualizations
Data visualization is a graphical representation of the numerical data. In our methodology, after forecasting the stock market trends we visualize the results for short-term investment assistance in-terms of line charts, candlesticks charts, bar charts, and histograms. Here x-axis shows the time period in-terms of year/months/days and y-axis shows the stock price values.
G. View and Analyze Results
Once after plotting the results in-terms of visualizations we can find out the correlations to get the short-term predictions. In the next section we provide some of the screen shots by which the investor can analyze and predict the future stock trends of a particular company at a specific time period. So the investors in the stock market can use this as assistance to sell/buy/hold a share.
V.SCREENSHOTS
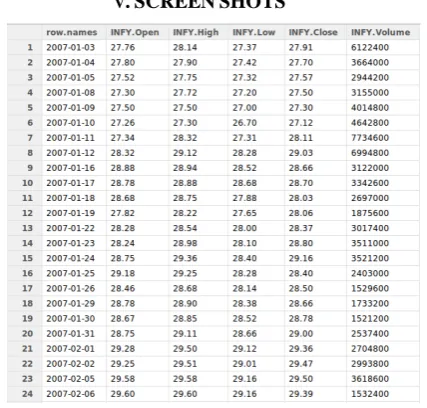
[image:4.595.323.560.470.771.2]Table. 5.1 Intra-day INFY data from Google finance - 2007 to 2015
Fig. 5.1 Chart series graph for INFY data - 2007 to 2015
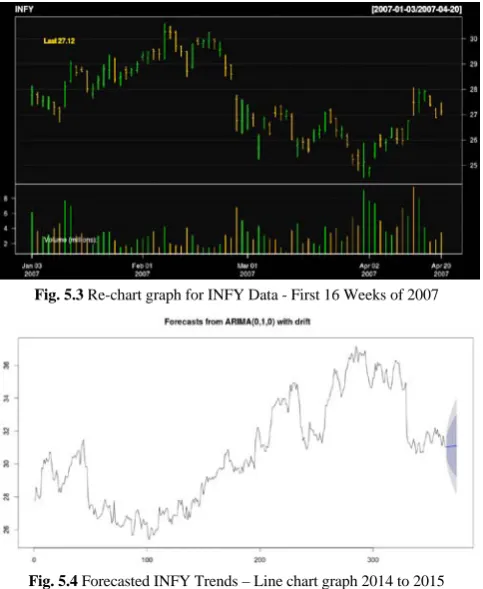
[image:4.595.44.280.514.644.2]Fig. 5.3 Re-chart graph for INFY Data - First 16 Weeks of 2007
Fig. 5.4 Forecasted INFY Trends – Line chart graph 2014 to 2015
Fig. 5.5 Forecasted INFY Trends – Histogram graph 2014 to 2015
VI.CONCLUSION
In this paper we made an attempt to develop a prediction model for forecasting the stock market trends based on the technical analysis using historical time series stock market data and data mining techniques. The experimental results obtained demonstrated the potential of ARIMA model to predict the stock price indices on short-term basis. This could guide the investors in the stock market to make profitable investment decisions whether to buy/sell/hold a share. With the results obtained ARIMA model can compete reasonably well with emerging forecasting techniques in short-term prediction.
VII.FUTUREENHANCEMENTS
The implementation of this paper can be extended by integrating the technical analysis and fundamental analysis techniques. Through the evaluation of social media analysis particularly on public opinions using fundamental analysis techniques can be incorporated in order to obtain better results. In this way we can provide the improved results for investors in the stock market to choose the better timing for profitable investment decisions.
REFERENCES
[1] Banerjee, D., "Forecasting of Indian stock market using time-series ARIMA model", 2nd IEEE International Conference on Business and Information Management (ICBIM), January 2014, pp. 131-135.
[2] Li Bing, Chan, K. C. C., C. Ou, "Public sentiment analysis in Twitter data for prediction of a company's stock price movements", 11th IEEE International Conference on e-Business Engineering (ICEBE), November 2014, pp. 232-239.
[3] Tao Xing, Yuan Sun, Qian Wang, Guo Yu, “The analysis and prediction of stock prices”, IEEE International Conference on Granular Computing (GrC), December 2013, pp. 368–373. [4] Vishwanath R. Ha, Leena Sa, Srikantaiah K. Ca, K. Shreekrishna
Kumar b., P. Deepa Shenoya, Venugopal K. Ra, S. S. Iyengarc, L. M. Patnaik, "Forecasting stock time-series using data approximation and pattern sequence similarity", International Journal of Information Processing (IJIP), September 2013, pp. 90-100.
[5] Ayodele A. Adebiyi, Aderemi O. Adewumi, Charles K. Ayo, "Stock price prediction using the ARIMA model", 16th IEEE International Conference on Computer Modelling and Simulation (UKSim), March 2014, pp. 106 -112.
[6] Qasem A. Al-radaideh, Adel Abu Asaf, Eman Alnagi, “Predicting stock prices using data mining techniques”, The International Arab Conference on Information Technology 2013. [7] Li Zhe; “Research on China's stock exchange markets: problems and improvements”, International Conference on Education and Management Technology, 2010. pp 465-469.
[8] Hazem M. El-Bakry, and Wael A. Awad, “Fast forecasting of stock market prices by using new high speed time delay neural networks”, International Journal of Computer and Information Engineering, February 2010, pp. 138-144.
[9] Han, J., Kamber, M., Jian P., “Data mining concepts and techniques”. San Francisco, CA: Morgan Kaufmann Publishers, 2011.
[10] Wang, Y.F., “Mining stock price using fuzzy rough set system”, Expert Systems with Applications, 2006, pp. 13-23.
[11] Enke, D., Thawornwong, S., “The use of data mining and neural networks for forecasting stock market returns”, Expert Systems with Applications, 2005, pp. 927-940.
[12] A. J. Conejo, M. A. Plazas, R. Espnola and B. Molina. “Day-ahead electricity price forecasting using the wavelet transform and ARIMA models”, IEEE Transactions on Power Systems, 2005, pp. 1035–1042.
SHORT BIO DATA OF AUTHORS
Mahantesh C. Angadi: He obtained his B.E (Information Science and Engineering) from Visvesvaraya Technological University, Belgaum, Karnataka, India. Currently he is pursuing final year M.Tech (Computer Networking and Engineering) in Acharya Institute of Technology, Bengaluru, Karnataka, India. His areas of interest include BigData analytics using Hadoop and R, Distributed computing, Cloud computing and Networking.