Article
The interacting head motif structure does not explain the X-ray
diffraction patterns from relaxed vertebrate skeletal and insect
flight muscles.
Carlo Knupp1, Edward Morris2 and John M. Squire3,4
1 School of Optometry and Vision Science, Cardiff University, Cardiff CF10 3NB, UK. [email protected]
2 Division of Structural Biology, Institute of Cancer Research, 123 Old Brompton Road, London SW7 3RP. [email protected]
3 Muscle Contraction Group, School of Physiology, Pharmacology and Neuroscience, University of Bristol,
BS8 1TD, UK; [email protected]
4 Computational and Systems Medicine,Faculty of Medicine, Imperial College,London, SW7 2BZ;
Abstract: Unlike electron microscopy, which can achieve very high resolutions, but to date can only be used to study static structures, time-resolved X-ray diffraction from contracting muscles can, in principle, be used to follow the molecular movements involved in force generation on a millisecond timescale albeit at moderate resolution. However, previous X-ray diffraction studies of resting muscles have come up with structures for the head arrangements in resting myosin filaments that are different from the apparently ubiquitous interacting heads motif (IHM) found by single particle analysis of electron micrographs of isolated myosin filaments from a variety of muscle types. This head organization is supposed to represent the super-relaxed state of the myosin filaments where ATP usage is minimized. Here we have tested whether the interacting heads motif structures will satisfactorily explain the observed low-angle X-ray diffraction patterns from resting vertebrate (bony fish) and invertebrate (insect flight) muscles. We find that the interacting heads motif does not, in fact, explain what is observed. Previous X-ray models fit the observations much better. We conclude that the X-ray diffraction evidence has been well interpreted in the past and that there is more than one ordered myosin head state in resting muscle. There is, therefore, no reason to question some of the previous X-ray diffraction results on myosin filaments; time-resolved X-ray diffraction should be a reliable way to follow crossbridge action in active muscle and may be one of the few ways to follow molecular changes in myosin heads on a millisecond timescale as force is actually produced.
Keywords: bony fish muscle, insect flight muscle, myosin filament structure, myosin crossbridge cycle, thick filament activation, interacting heads motif
1. Introduction
A long-term goal of those working to describe in detail the nature of the crossbridge
interaction between myosin and actin filaments that occurs during muscle contraction has been to
describe the underlying molecular movements using analysis of time-resolved X-ray diffraction
patterns [1-3]. This kind of analysis is made more practicable by using particular types of muscle,
namely simple lattice muscles (e.g. bony fish muscle) for the vertebrates [4-6] and insect flight muscle
for the invertebrates [7-9]. These muscles are attractive in that the myosin filament organisation
within the muscle A-bands can be sufficiently well-ordered that their observed X-ray diffraction
patterns are quasi-crystalline and are therefore amenable to the application of standard
crystallographic methods of analysis [6,10,11]. So, for example, models for the crossbridge
configurations on the myosin filaments in resting bony fish muscle (Hudson et al [10]) and resting
insect flight muscle (AL-Khayat et al [11]) have been developed by rigorous fitting of the observed
resting X-ray diffraction patterns and modelling of the patterns using known information about
filament and lattice symmetry and the shape of the myosin heads. Both of these models have the
attractive feature that the actin-binding domains of some of the myosin heads are relatively close to
the sites on actin filaments where they would need to bind. In addition, the heads are oriented with
their actin binding sites suitably aligned to interact with the actin filaments with the head orientation
observed in 3D reconstructions from electron micrographs of actin filaments labelled with myosin
heads in the rigor state (no ATP [12, 13]).
X-ray diffraction modelling of this kind requires the setting up of structural models in silico
and then altering the parameters describing the models in some form of parameter search until the
computed diffraction pattern matches the observed pattern as closely as possible. The adjustable
parameters may include the tilt, rotation, slew and radius of the myosin heads and alterations in their
shape around points of flexibility. The goodness of fit is usually described by an R-factor which
compares the computed and observed diffraction intensities and scores the result. The model
with the lowest R-factor is taken as the best. The R-factor size can be thought of as being
described on a multidimensional ‘mountain range’ and there is a potential problem with these searches that the searching can get stuck in a low valley which looks right, when the actual lowest
valley (lowest R-factor) is somewhere else. A local minimum has been found, but the global
minimum has been missed. A priori we do not know if this is the case and can only make judgements based on the size of the R-factor compared to the number of free parameters involved in
the search, the number of iterations in the parameter search, the apparent plausibility of the chosen
structure and the reproducibility of the structure with the lowest R-factor in independent, repetitive,
searches.
Studies of isolated myosin filaments by electron microscopy (EM) have been carried out for
many years and 3D reconstructions and other kinds of analysis have revealed the rotational
symmetry of these myosin filaments; 3-fold for vertebrates [14-16], 4-fold for insect flight muscle
[17]. EM and X-ray methods have also shown their axial repeats; a common crown spacing of
around 143 to 145 Å and axial repeats of around 430 Å for vertebrate thick filaments ([6,7,18] and
1160 Å for insect thick filaments [7]). Other myosin filament symmetries are described elsewhere
(e.g. [19,20]). For many years the EM reconstructions were inconclusive because the available
resolution was not good enough to enable different head organisations to be properly distinguished.
But, more recently, with improvements in EM techniques, higher resolution structures have homed
in on one particular kind of structure for the myosin head arrays in relaxed muscles. This
configuration is the so-called interacting heads motif (IHM; Figure 1(a)) first observed in 2D crystals
of isolated myosin heads from vertebrate smooth muscle [21]. It was then seen on the thick
filaments of tarantula muscle [22] and subsequently has been seen on all myosin filaments that have
been studied in enough detail [23], including vertebrate muscle myosin filaments [24-26] and insect
structures are different from the structures modelled for the same filaments using X-ray diffraction
analysis.
Figure 1: (a) The interacting heads motif (IHM) of the two myosin heads in a myosin molecule shown as a stereo pair (wall-eyed stereo). One head in each pair is in shades of blue and the other in yellow. The motor domains are towards the top, the lever arms with a long central –helix each with two light chains (yellow and red on the right head) are below the motor domains. The coiled-coil of part of the subfragment 2 (S2) of the myosin rod, where the two heads join together, is shown at the lower left. The actin binding site on the right head abuts the left head. The right hand head is called the blocked head and the other the free head. (b) Stereo image of the reconstruction from electron microscopy and single particle analysis of the myosin filaments in human heart muscle, with heads fitted to the density. The total length of filament shown here is around 43 nm. There are three crowns of heads with six heads in each crown. The head pair configuration is similar to that in (a), but the whole structure, for example of the heads nearest to the viewer, has been rotated 180 top to bottom roughly around a horizontal rotation axis in the plane of the page. Other head pairs are then rotated around the filament axis by varying amounts.
The question we ask here is, therefore, whether the X-ray diffraction modelling was just
wrong because the searching had become stuck in a local R-factor minimum and we had missed the
interacting head motif structure in our analysis, or whether both structures are in fact sensible, but
perhaps occur in the same muscle type at different times, under different conditions. In other
words, can we rely on the X-ray analysis? We need to know the answer to this before we can
attempt to model the whole crossbridge cycle using X-ray diffraction methods. Here we deal with
flight (Lethocerus) muscles. We show that the interacting heads motif structure will not, in fact,
explain the observed X-ray diffraction patterns from these resting muscles and we discuss the
implications of this finding.
2. Methods and Results
2.1 Strategy:
In order to test whether the interacting head motif structures could explain the observed
low-angle X-ray diffraction patterns from resting bony fish and insect flight muscles, we generated
the full A-band unit cells of just the myosin filaments in fish muscle and insect flight muscle using
the observed EM-fitted interacting head motif head configurations arranged with the appropriate
myosin filament symmetry from the EM reconstructions of human heart muscle myosin filaments
[26] and Lethocerus myosin filaments [27]. We used a locally produced program to calculate the
expected intensities of all the reflections (Miller indices h, k, l) from the two unit cells out to a resolution of about 60 Å. Previously we had used the CCP13 program FibreFix [28] to determine
the observed intensities and MOVIE [10] to generate the myosin filament models and calculate their
diffraction patterns. The new calculations using our home-generated program are totally
independent of the previous MOVIE calculations of the diffraction patterns. Having calculated
the diffraction patterns, the results from our programs were checked by using Fourier synthesis on
the calculated reflection data to confirm that the original myosin filament structures were
regenerated.
2.2 Bony fish (Plaice) muscle myosin filaments and unit cell:
From analysis of the fish muscle X-ray diffraction pattern (Figure 2(a)) using FibreFix [28]
or its predecessor, the resting bony fish (plaice) muscle unit cell (Figure 2(b)) was found to have
dimensions a = b = 470 Å, c = 429.6 Å, = = 90, ( = 120. It is a simple lattice structure [4-6],
with every myosin filament having the same rotation around its long axis on every lattice point of
the hexagonal A-band unit cell. Actin filaments, with roughly 13/6 helical symmetry, lie at the
trigonal points of this lattice (i.e. at the centre of a triangle formed by three myosin filaments). Their
axial repeat is around 360 Å, so the actin layer lines do not directly overlap the myosin layer lines
(e.g. see Figure 2.8 in [29]). In any case, unlike the myosin layer lines, the actin layer-lines are not
sampled; to get accurate myosin layer-line intensities, the actin diffraction can be stripped as part of
the continuous background.
2.3 The Human Heart Muscle Myosin Filament:
A 3D reconstruction of the myosin filaments from human heart was generated by AL-Khayat et al [26] as
a density map to about 25 Å resolution. This was then fitted with the interacting head motif structure [21],
which was found to be an almost perfect match to the density. This structure is shown in stereo in Figure
1(b). Vertebrate (fish) myosin filament symmetry has the head pairs approximately on a 3-start 9 residue
per turn helix of pitch 3 x 429.6 Å [14]. Because of the three equivalent strands, and the 3-fold rotational
symmetry of this structure, it has a true repeat of 429.6 Å.
are not quite the same; there is a periodic perturbation [6,18]. This can be seen in Figure 1(b), where
the axial separation of the head pairs along a long-pitched strand, which would be at regular axial
steps of 143.2 Å if the structure was perfectly helical, actually show significant perturbations from
this.
.
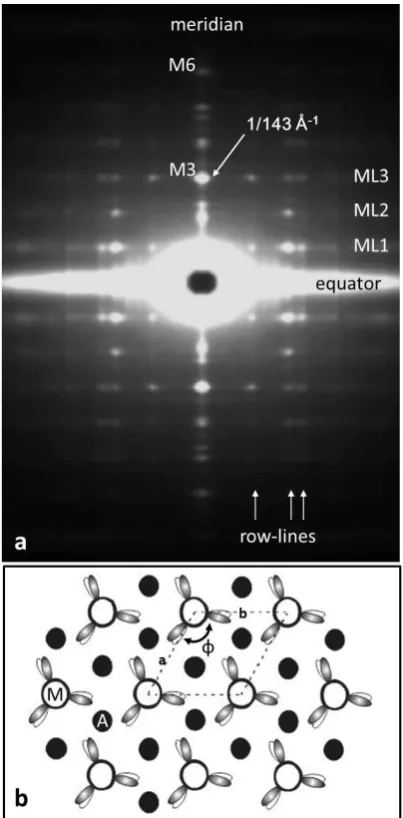
Figure 2: (a) The low-angle X-ray diffraction pattern
from bony fish muscle (fibre axis vertical) showing the horizontal layer lines and vertical row-lines on which the observed peaks are situated. Almost all of what can be seen here comes from the myosin filaments in the muscle. (b) The ‘simple lattice’ unit cell of the
A-band lattice in bony fish muscle viewed down the fibre axis showing the single rotation () of the
myosin filaments around their long axes and the 3-fold rotational symmetry of the head arrangement on one crown of heads. Actin filament positions (black circles) at the trigonal points are labelled A.
2.4 Calculation of the X-ray diffraction pattern from Vertebrate Muscle:
The important myosin filament layer-lines in vertebrate muscle X-ray diffraction patterns
(Figure 2(a)) out to around 60 Å, are (l = ) 1 (429.6 Å), 2 , 3 (143.2 Å; M3 meridional and layer line), 4,
5 and 6 (71.6 Å; M6 meridional and layer line). In order to compare the human heart myosin
filament structure with the plaice fin muscle diffraction pattern, the human heart myosin filament
structure (Figure 1(a)) was positioned at the unit cell corners of the fish muscle unit cell and its
diffraction pattern was computed from the formula:
F(h,k,l) = Σ (x,y,z)exp (2πi(hx+ky+lz)) Equation 1
Figure 3: The fish muscle unit cell with the myosin filament head arrangements (dark yellow) of (a) Hudson et
al [10] and (b) as in human heart muscle (AL-Khayat et al [25]). The myosin filament backbone structure is from Chew and Squire [30]. Actin filaments are shown in green.
Note that the observed X-ray diffraction pattern is a rotation pattern from unit cells in sarcomeres at
all rotations around the fibre axis. Each spot in the X-ray diffraction pattern is then a sum of
everything that occurs at the same radius (R) on a particular layer-line l, but with different rotations
around the fibre axis – they are multiplets. Even peaks with different Miller indices can occur at the same radius on a layer-line (e.g. the 53l and 70l peaks).
An uncertainty of this calculation is the absolute rotation of the myosin filament within the unit
cell, relative to the unit cell edges. The human thick filament density map or pdb structure was
was therefore rotated systematically around the c-axis in the fish muscle unit cell in steps of 1 over
the range 0 to 60 and for each rotation an R-factor was calculated using the formula:
R = Σ(Iobs-Icalc)2/Σ(Iobs)2] Equation 2
For comparison, the diffraction pattern of the thick filament model of Hudson et al. [10] as
computed in exactly the same way using the same programs in the same unit cell, with R-factors, as
above, being computed in each case. Note that the best model of AL-Khayat and Squire [31]
gave similar results.
Figure 4: The calculated R-factor from the human heart muscle myosin filament in the fish muscle unit cell (red
trace) showing a large variation with rotation angle relative to the unit cell axis. The analogous R-factor for the fish thick filament structure determined by Hudson et al [10] is in blue. As expected both R-factors are periodic because of the symmetry in the lattice and they repeat after 60. Also included is the R-factor of the hybrid human system if the myosin S2 is also included. Inclusion of S2 gave a slightly poorer fit, but both human models with the interacting heads motif give very poor R-factors compared to the Hudson et al [10] structure.
2.5 Vertebrate Muscle Myosin Filaments:
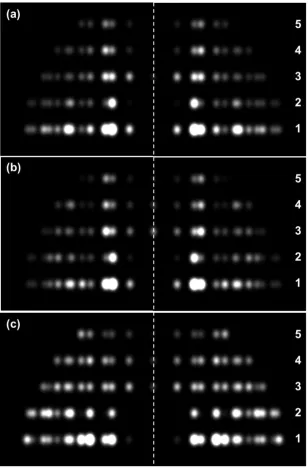
Figure 5 compares the observed X-ray diffraction pattern from resting bony fish muscle (a), with the
computed diffraction patterns from (b) the model of Hudson et al [10] and (c) a hybrid structure with the EM
density map of AL-Khayat et al [26] placed in the fish muscle unit cell. The best (lowest) R-factors obtained
were R = 0.0786 (or 7.9 %) for the model of Hudson et al [10] and R = 0.54 (54%) for the human thick
filament reconstruction in the fish muscle unit cell. [Note that the R-factor value for fish muscle is different
here from in Hudson et al ([10]; 3%) because we are using a slightly different R-factor definition (see
Equation 3).] Clearly the human structure is a very poor fit to the observed pattern, as Figures 4 and 5
show. Figure 4 shows the variation of the R-factor with the rotation of the human thick filament model in
the fish muscle lattice. This is a periodic function with equivalence every 60 because of the symmetry of
the system (i.e. a hexagonal lattice, and a motif with approximate 9-fold rotational symmetry in projection
down the c-axis), and, for the Human chimera structure, the R-factor varies from R = 54% its best to R = 78%
at its worst. Even the best value is very poor compared with the Hudson et al. [10] structure. The fit is
Figure 5: (a) Simulated X-ray diffraction pattern using the observed corrected intensities from bony fish muscle (cf. Figure 2(a)). (b) Calculated diffraction pattern using the Hudson et al. [10] myosin filament structure that is the best fit to (a); R-Factor 7.9%. (c) The calculated X-ray pattern if the AL-Khayat et al. [26] human heart muscle myosin filaments with the interacting heads motif are put into the fish muscle unit cell; lowest R-Factor = 54%. Inclusion of myosin S2 in the calculation in (c) makes the fit slightly less good (see Figure 4). All patterns were scaled to have the same total intensity.
Figure 3(b) shows the appearance of the human thick filament structure [26] in the fish muscle
unit cell with the preferred rotation of the thick filament in the lattice. Also shown are the actin
filaments. For comparison Figure 3(a) shows the Hudson et al [10] myosin filament structure in
the same unit cell. In Figure 3(a) the actin binding domains on the myosin heads are highlighted
in blue; they are close to the actin filaments in (a), but shielded from the actin filaments in (b) where
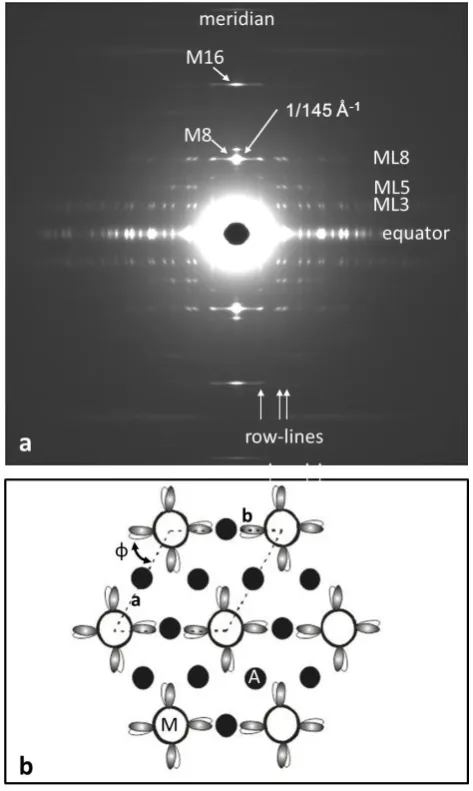
Figure 6: (a) The observed low-angle X-ray diffraction pattern from insect flight muscle (Lethocerus; fibre axis vertical) courtesy of R.J. Edwards and M.K. Reedy [7-9] and (b) the insect flight muscle unit cell viewed down the fibre axis, showing the unique orientation of the myosin filaments in the lattice and their 4-fold rotational symmetry on a single crown of heads. Actin filaments, all halfway between adjacent myosin filaments, are labelled A. Compare Figure 2(b) for vertebrate striated muscles.
2.6 Insect Flight Muscle Myosin Filaments:
A 3D reconstruction of the thick filaments from Lethocerus flight muscle was published by Hu et
al in 2016 [27]. This reconstruction had the remarkable property that the backbone structure was resolved to 6Å resolution, enough to reveal the curved molecular crystal packing of the –helical coiled-coil myosin rods in the backbone [30,32]. However, the head pairs were only resolved to
about 25 Å resolution, presumably because of some inherent disorder in the head organisation. Because of a technical problem, they were unable to supply us with the coordinates of the head
pairs. We have, therefore, used the protein density map produced by Hu et al [27]; kindly provided to us by Kenneth Taylor, Florida State University) as a starting point with which to
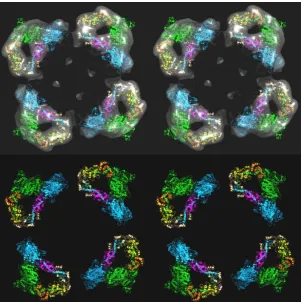
Figure 7: (a) Part of the 3D reconstruction of the insect flight muscle myosin filament according to Hu et al [27], here showing slightly more than three crowns as a stereo (wall-eyed) surface view.
Figure 8: (a) 3D structure the insect flight muscle myosin filament according to Hu et al [27] shown as a stereo
Hu et al [27] suggested that, like thick filaments in other resting muscles, the observed densities
could be described by the interacting head motif arrangement originally described by Wendt et al
[21]. As noted above, models based on the interacting head motif arrangement have been found
to match well with electron microscope derived 3D reconstructions of, for example, tarantula [22],
scorpion [33]) and vertebrate cardiac thick filaments [24,25], including human thick filaments [26].
Accordingly, we developed a model for the head arrangement in the insect flight muscle thick
filament density map using as a starting point the atomic coordinates fitted to the tarantula thick
filament ([22] pdb accession code 3DTP). The tarantula interacting head motifs were initially fitted
as rigid bodies within the crown domains using Chimera [34]. Subsequent conformational
optimization was achieved with COOT [35] and flexible fitting with MDFF [36] giving rise to the
structure illustrated in Figures 8 and 9. The coordinates of the fitted model are well contained
within and account well for the protein density of the crown domains. As in the interacting head
model of Hu et al [27], the long axes of both heads are oriented approximately perpendicular to the
filament axis. The free head is adjacent to and runs at a tangent to the thick filament backbone (Figure
9). The blocked head is located at higher radius: its lever arm is angled outwards diverging to higher
radius while the motor domain is curved back in to interact with the motor domain of the free head.
2.8 X-ray Diffraction from Insect Flight Muscle:
X-ray diffraction patterns from resting insect flight muscle (Figure 6(a)) were kindly provided
by R.J. Edwards (Duke University, North Carolina, US; see [7-9]. These were stripped by us using
both the FibreFix program [28] and using Fiji [37] followed by PeakFit
(https://systatsoftware.com/products/peakfit/). The measured unit cell dimensions (Figure 6(b))
were: a = b = 510 Å, c = 1160 Å, = = 90, ( = 120. There is one myosin filament per unit cell,
but there are three actin filaments to every myosin and these are halfway between neighbouring
myosin filaments (not at the trigonal points found in vertebrate muscle: see Figure 2(b)). As in
the case of the vertebrate muscle, diffraction patterns were computed by placing various versions of
the resting insect myosin filaments into the insect flight muscle unit cell and computing the structure
factor F(h,k,l) as in Equation 1. Once again, in principle, the rotation of the filament in the lattice is important, but the insect thick filament has 32-fold rotational symmetry in projection down the
c-axis, so in a 6-fold symmetric lattice a rotation range of only around 360/ 192 ~ 2 is needed to
calculate the expected intensities. At the resolution that we are considering, about 60 Å, such a
Figure 9: (a,b) The models in Figure 8(a,b) shown looking down the filament axis, with the same colour coding. The head pairs form a good fit with a closed structure, as in the interacting head motif.
Figure 10: Comparison of three crown levels of the Hu et al [27] insect flight muscle myosin filament density map (a) and the model (b) of AL-Khayat et al [11] based on fitting X-ray diffraction data.
As described in detail in AL-Khayat et al([11], the insect flight muscle structure gives rise to layer
lines that are orders of the 1160 Å axial repeat. From the symmetry of the myosin filament, the
strong layer lines are at (l = ) 3 (387 Å), 5, 8 (145 Å: meridional, M8 and layer-line), 11, 13, 16 (72.5 Å;
meridional, M16 and layer-line) and so on. The complication is that the actin filaments in insect
flight muscle also have a pseudo-repeat of around 387 Å, so they also contribute to the 3rd layer line
of the 1160 Å repeat, as does troponin which lies on a 385 Å repeat. This means that the 3rd layer
including actin, tropomyosin and troponin and this adds many more parameters to be fitted.
For this reason we chose to assess possible insect myosin filament structures using the layer lines
listed above apart from layer line l = 3. The reflection intensities of interest are listed in Table 2.
As in the case of the vertebrate muscle, there are multiplets at the same radius (R) and the intensities
being fitted are the sums of all the peaks in the same multiplet.
2.9 Is the interacting myosin head motif present in the unit cell of relaxed Insect Flight Muscle?
The resting insect flight muscle myosin filament structure has previously been modelled by
AL-Khayat et al [11] to give the structure shown in Figure 10(b). In order to test whether the Hu et al
[27] structure can better explain the observed low-angle X-ray diffraction pattern From
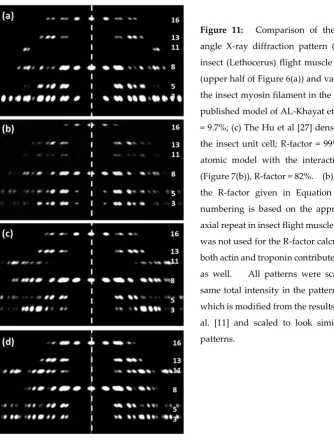
Figure 11: Comparison of the observed low-angle X-ray diffraction pattern (a) from relaxed
insect (Lethocerus) flight muscle after processing
(upper half of Figure 6(a)) and various versions of
the insect myosin filament in the unit cell: (b) The
published model of AL-Khayat et al. [11], R-factor
= 9.7%; (c) The Hu et al [27] density map put into
the insect unit cell; R-factor = 99%, (d) The fitted
atomic model with the interacting heads motif
(Figure 7(b)), R-factor = 82%. (b), (c) and (d) used
the R-factor given in Equation 3. Layer line
numbering is based on the approximate 1160 Å
axial repeat in insect flight muscle. Layer line 3
was not used for the R-factor calculations, because
both actin and troponin contribute to that layer line
as well. All patterns were scaled to give the
same total intensity in the pattern, apart from (b)
which is modified from the results of AL-Khayat et
al. [11] and scaled to look similar to the other
patterns.
Lethocerus flight muscle (Figure 6(a)), we have put the density map from Hu et al [27] into the insect
unit cell and calculated its expected X-ray diffraction pattern. We have also done the same with
the atomic model (Figure 7(b) and Figure 8) of the interacting heads motif structure fitted to the Hu
et al density. The results are shown in Figure 11 in comparison with the model of AL-Khayat et
Note that the original AL-Khayat et al modelling used a slightly different R-Factor from the one
quoted as Equation 2 above. This is shown as Equation 3. It includes the standard deviation () of the observed intensity.
R = Σ[(Iobs-Icalc)2/ 2 ] / Σ(Iobs)2/2] Equation 3
Usually the most intense peaks are better determined than the weak ones, so the effect of
including the 2 factors is often not large. We have used Equation 3 throughout our analysis of the insect
flight muscle diffraction patterns. The result is that the R-factors were 9.7% for the published structure of
Al-Khayat et al [11], 99% for the density map from Hu et al [27] and 82% from the PDB file of the fitted density
map in the present work as in Figures 8 and 9. The interacting head motif structure is a poor fit to the
observations from resting insect flight muscle.
3. Discussion
We have shown in our analysis that the interacting head motif structures for the myosin filaments in
vertebrate muscles [24-26] and insect flight muscle [27] do not explain the X-ray diffraction observations
previously recorded from resting vertebrate and insect flight muscles [6,11]. It would appear that, under
some circumstances, the super-relaxed states, which we take to be the interacting heads motif structures, can
occur and that this reduces the resting acto-myosin ATPase to conserve energy. On the other hand, dissected
fish and insect muscles kept in a normal relaxed state have a different structure, which we will call the activated
relaxed state. Something along these lines has previously been reported by Ma et al [38] using mouse muscle.
They also treated their muscles with blebbistatin and reported that this shifted the relaxed state towards the
super-relaxed state. Blebbistatin is known to inhibit the myosin ATPase [39,40].
We show elsewhere [41] that when bony fish muscle is fully active there is still a sampled myosin
layer-line pattern that is not just a reduced version of the resting pattern. If there had been some fibres that for some
reason had not been activated, a remnant myosin layer line pattern might be expected. But the analysis of
Eakins et al [41] shows clearly that the myosin layer lines in the active pattern are quite different from the
resting layer lines. The active layer-lines show evidence of a new ‘active’ myosin-centred structure. So,
in bony fish muscle, there is probably an ordered super-relaxed state under some conditions, there is an
‘activated’ relaxed state [the present work and Ma et al [38], and there is an ordered, myosin-centred, active state (Eakins et al [41]), probably the weak-binding and pre-powerstroke heads, in addition to any strong head
states on actin that are involved in force production. Ma et al [38] also found myosin layer lines in their
active patterns from mouse, so their results and ours suggest that these three myosin-centred states may be a
general feature of vertebrate muscles. It also means that, apart from the super-relaxed state, the other resting
myosin filament states are not just disordered states as has been thought before, but are specifically-ordered
‘activated’ states.
Turning now to insect flight muscle, the same story appears to hold true there. The compact interacting
head motif structure is not always seen in relaxed insect flight muscle myosin filaments, but the preferred
structure that fits the layer line pattern [11] has one of the bridges extending radially outwards towards actin
(Figure 12(b)). One of the heads, the free head, is close to the filament backbone in the super-relaxed state
seen by Hu et al [27] (Figure 12(a)), but this head appears to rotate around the S2 by almost 180 to get to the
the super-relaxed state and the ‘activated’ relaxed state (Figure 12(a,b)). The head movements required to
convert from one relaxed structure to the other in insect flight muscle are indicated in Figure 12 (c), where the
two head arrangements are superimposed. Activation puts one of each head pair very close to an actin
filament, without apparently disturbing the free head. The radially projecting free head in Figure 12(b) may
well still be stabilised by a different interaction with the free head (Figure 12(b)).
Figure 12: (a) One crown of the
super-relaxed head configuration on the myosin filaments of insect flight muscle, looking M-wards and showing the interacting head motif (cf. Figure 9). (b) One crown of the resting insect flight muscle myosin filament (slightly refined from) that reported by AL-Khayat al [11], in the configuration that best fits with the Hu et al [27] structure, with the S2 positions coincident and showing one head near the filament surface with the other projecting radially outwards from the filament backbone (shown here as an empty space). (c) The structures in (a) and (b) superimposed to show the similar, overlapping, locations of the blocked heads and the changed positions of the free heads between the two structures. The white arrows indicate the swing of the free heads around the S2 positions, which are shown as small yellow dots, between what we assume is the super-relaxed state and what we now think of as the ‘activated’ relaxed state.
4. Conclusion
Using further analysis of the low-angle X-ray diffraction data from bony fish muscle and insect
flight muscle it has been demonstrated that the normal resting state of both muscles in the published
X-ray diffraction experiments is not the super-relaxed state that has been seen in 3D single particle
reconstructions from electron microscopy. There must be two different structures, both ‘relaxed’ and both ordered. The drug blebbistatin can encourage the filaments to favour the super-relaxed
configuration [39,40], but what causes this transition in the muscle? Particularly noteworthy is the
fact that the previous X-ray diffraction modelling of the head positions in relaxed fish muscle by
Hudson et al [10] and in relaxed insect flight muscle by AL-Khayat et al [11] appears to be satisfactory.
This means that the powerful X-ray diffraction modelling that these two studies involved can be
time-resolved manner, and this prospect still seems a long way off, this may be the only way to
actually visualise the molecular changes in the acto-myosin system as force is generated.
Author Contributions: Conceptualization, JMS; Methodology, CK, EM, JMS; Software, CK; Investigation, CK, EM; Resources, CK,EM; Data Curation, JMS; Writing-Original Draft Preparation, JMS; Writing-Review & Editing, CK, EM, JMS; Visualization, JMS; Supervision, JMS.
Funding: This research received no external funding.
Acknowledgments: We are indebted to Prof. K. Taylor (Florida State University, USA) for provision of the insect flight muscle thick filament electron density map and to Dr. R.J Edwards (Duke University, USA) for the provision of the insect flight muscle low-angle X-ray diffraction pattern.
Conflicts of Interest: The authors declare no conflicts of interest.
Abbreviations
IHM Interacting heads motif IFM Insect flight muscle EM Electron microscopy ATP Adenosine triphosphate ADP Adenosine diphosphate Pi Inorganic phosphate.
References
1. Huxley HE, Kress M. (1985) Crossbridge behaviour during muscle contraction. J Mus Res Cell Motil 6: 153-161.
2. Squire JM, Harford JJ, AL-Khayat HA (1994) Molecular Movements in Contracting Muscle: Towards 'Muscle - The Movie' J Biophys Chem 50: 87-96.
3. Eakins F, Pinali C, Gleeson A, Knupp C, Squire JM. (2016) X-ray Diffraction Evidence for Low Force Actin-Attached and Rigor-Like Cross-Bridges in the Contractile Cycle. Biology 5. pii: E41.
4. Luther PK, Squire JM (1980) Three-dimensional structure of the vertebrate muscle A-band II: the myosin filament superlattice. J Mol Biol 141: 409-439.
5. Luther PK, Munro PMG, Squire JM (1981) Three-dimensional structure of the vertebrate muscle A-band III: M-region structure and myosin filament symmetry. J Mol Biol 151: 703-730.
6. Harford JJ, Squire JM (1986) The 'crystalline' myosin crossbridge array in relaxed bony fish muscles, Biophys J 50: 145-155.
7. Reedy MK (1968) Ultrastructure of insect flight muscle. I. Screw sense and structural grouping in the rigor cross-bridge lattice. J Mol Biol 31: 155-76.
8. Tregear RT, Edwards RJ, Irving TC, Poole KJ, Reedy MC, Schmitz H, Towns-Andrews E, Reedy MK (1998) X-ray diffraction indicates that active cross-bridges bind to actin target zones in insect flight muscle. Biophys J 74: 1439-1451.
9. Perz-Edwards RJ, Irving TC, Baumann BA, Gore D, Hutchinson DC, Kržič U, Porter RL, Ward AB, Reedy MK (2011) X-ray diffraction evidence for myosin-troponin connections and tropomyosin movement during stretch-activation of insect flight muscle. Proc Natl Acad Sci U S A 108: 120-125. 10. Hudson L, Harford JJ, Denny RC, Squire JM(1997) Myosin head configuration in relaxed fish muscle:
resting myosin heads must swing axially by up to 150 Angstroms or turn upside down to reach rigor. J Mol Biol 273: 440-455.
12. Behrmann E, Muller M, Penczek PA, Mennherz HG, Manstein DJ, Raunser S (2012) Structure of the rigor actin-tropomyosin-myosin complex. Cell 150: 327-338.
13. von der Ecken J, Heissler SM, Pathan-Chhatbar S, Manstein DJ, Raunser S (2016) Cryo-EM structure of a human cytoplasmic actomyosin complex at near-atomic resolution. Nature 534: 724-8.
14. Squire JM (1972) General model of myosin filament structure II: myosin filaments and crossbridge interactions in vertebrate striated and insect flight muscles. J Mol Biol 72: 125-138.
15. Squire JM(1974). Symmetry and 3-D arrangement of filaments in vertebrate striated muscle. J Mol Biol
90: 153-160.
16. Kensler RW, Stewart M (1983) The relaxed crossbridge pattern in isolated rabbit psoas muscle thick filaments. J Cell Sci 105: 841-848.
17. Morris EP, Squire JM, Fuller GW (1991) The 4-stranded helical arrangement of myosin heads on insect (Lethocerus) flight muscle thick filaments. J Struct Biol 107: 221-226.
18. Huxley HE, Brown W (1967) The low-angle X-ray diagram of vertebrate striated muscle and its behaviour during contraction and rigor. J Mol Biol 30: 383-434.
19. Squire JM (1981) The Structural Basis of Muscular Contraction, Plenum Press, New York and London (now reprinted).
20. Squire JM (2009) Muscle Myosin Filaments: Cores, Crowns and Couplings. Biophysical Reviews 1: 149-160.
21. Wendt T, Taylor D, Messier T, Trybus KM, Taylor KA (1999) Visualization of head-head interactions in the inhibited state of smooth muscle myosin. J Cell Biol 147: 1385-1390.
22. Woodhead JL, Zhao F-Q, Craig R, Egelman EH, Alamo L, Padron R (2005) Atomic model of a myosin filament in the relaxed state. Nature 436: 1195-1199.
23. Lee KH, Sulbarán G, Yang S, Mun JY, Alamo L, Pinto A, Sato O, Ikebe M, Liu X, Korn ED, Sarsoza F, Bernstein SI, Padrón R, Craig R (2018) Interacting-heads motif has been conserved as a mechanism of myosin II inhibition since before the origin of animals. Proc Natl Acad Sci U S A 115: E1991-E2000. 24. Zoghbi ME, Woodhead JL, Moss RL, Craig R (2008) Three-dimensional structure of vertebrate cardiac
muscle myosin filaments. Proc Natl Acad Sci U S A 105: 2386-2390.
25. AL-Khayat HA, Morris EP, Kensler RW, Squire JM (2008) Myosin filament 3D structure in mammalian cardiac muscle. J. Struct. Biol. 163, 117-126.
26. Al-Khayat HA, Kensler RW, Squire JM, Marston SB, Morris EP (2013) Atomic model of the human cardiac muscle myosin filament. Proc Natl Acad Sci U S A. 110: 318-323.
27. Hu Z, Taylor DW, Reedy MK, Edwards RJ, Taylor KA (2016) Structure of myosin filaments from relaxed Lethocerus flight muscle by cryo-EM at 6 Å resolution. Sci Adv 2: e1600058. eCollection.
28. Rajkumar G, AL-Khayat HA, Eakins F, He A, Knupp C, Squire JM (2005) FibreFix – A New Integrated CCP13 Software Package. Fibre DiffractionReview 13: 11-18.
29. Squire JM, Knupp C (2017) Studies of Muscle Contraction Using X-ray Diffraction. In Muscle Contraction and Cell Motility: Fundamentals and Developments. (Ed. Sugi, H), Stanford Publishing. pp. 35-73.
30. Chew MWK, Squire JM (1995) Packing of a-helical coiled-coil molecules in vertebrate muscle thick filaments. J Struct Biol 115: 233-249.
31. AL-Khayat HA, Squire JM (2006) Refined Structure of Bony Fish Muscle Myosin Filaments from Low-Angle X-ray Diffraction Data. J Struct Biol 155: 218-229.
32. Squire JM (1973) General model of myosin filament structure III. Molecular packing arrangements in myosin filaments. J Mol Biol 77: 291-323.
33. Pinto A, Sánchez F, Alamo L, Padrón R (2012) The myosin interacting-heads motif is present in the relaxed thick filament of the striated muscle of scorpion. J Struct Biol 180: 469-478.
34. Pettersen EF, Goddard TD, Huang CC, Couch GS, Greenblatt DM, Meng EC, Ferrin TE (2004) UCSF Chimera--a visualization system for exploratory research and analysis. J Comput Chem 25: 1605-1612. 35. Emsley P, Lohkamp B, Scott WG, Cowtan K (2010) Features and development of Coot. Acta
Crystallographica D 66: 486-501
36. Trabuco LG, Villa E, Mitra K, Frank J, Schulten K (2008) Flexible fitting of atomic structures into electron microscopy maps using molecular dynamics. Structure 16: 673-683.
38. Ma W, Gong H, Irving T (2018) Myosin Head Configurations in Resting and Contracting Murine Skeletal Muscle. Int J Mol Sci. 19. pii: E2643. doi: 10.3390/ijms19092643.
39. Straight AF, Cheung A, Limouze J, Chen I, Westwood NJ, Sellers JR, Mitchison TJ (2003) Dissecting temporal and spatial control of cytokinesis with a myosin II Inhibitor. Science 299: 1743-1747.
40. Wilson C, Naber N, Pate E, Cooke R (2014) The myosin inhibitor blebbistatin stabilizes the super-relaxed state in skeletal muscle. Biophys J 107: 1637-1646.
41. Eakins F, Knupp C, Squire JM (2019) Monitoring the Myosin Crossbridge Cycle in Contracting Muscle: Steps towards ‘Muscle the Movie’. J Mus Res Cell Motil (in press).
42. Squire JM, Harford JJ, AL-Khayat HA (1994) Molecular Movements in Contracting Muscle: Towards 'Muscle - The Movie'. J Biophys Chem 50: 87-96.
43. Squire JM, Knupp C (2005) X-ray diffraction studies of muscle. Adv Prot Chem 71: 195-255.