Protein Dom ain Evolution by Comparative
Genomics
Daniel Buchan
Biomolecular Structure and Modelling Unit
Department of Biochemistry and Molecular Biology
University College London
A thesis subm itted to the University of London in the
Faculty of Science for the degree of Doctor of Philosophy
ProQ uest Number: U642476
All rights reserved
INFORMATION TO ALL U SE R S
The quality of this reproduction is d ep en d en t upon the quality of the copy subm itted.
In the unlikely even t that the author did not sen d a com plete manuscript
and there are m issing p a g e s, th e se will be noted. Also, if material had to be rem oved, a note will indicate the deletion.
uest.
ProQ uest U 642476
Published by ProQ uest LLC(2015). Copyright of the Dissertation is held by the Author.
All rights reserved.
This work is protected against unauthorized copying under Title 17, United S ta tes C ode. Microform Edition © ProQ uest LLC.
ProQ uest LLC
789 East E isenhow er Parkway P.O. Box 1346
A bstract
Modern gene sequencing methods and the genome projects have been depositing data in the public databanks at ever increasing rates for the last twenty years. Biochemistry faces a challenge to generate meaningful analyses of these d ata since genomic d ata is generated faster than traditional ‘wet lab’ techniques can analyse. Bioinformatics can be used to autom atically annotate and classify these d ata and subsequently provide insights into the biochemistry of many organisms. While Bioinformatics provides no direct substitute for the work in the ‘wet lab’, it is now an indispensible adjunct to modern biochemistry.
This thesis is chiefly concerned with the autom ated assignment of protein domains and protein functions to those sequences th at were previously uncharacterised. The flrst part of the thesis addresses the problem of assigning structural and sequence domains to proteins of unknown domain structure. The construction of a database of these data (GeneSD) is also presented. This is followed by a protocol for assigning protein functions to uncharacterised proteins. For both these studies (domain assignment and functional assignment) statistics are gathered to describe the general trends and patterns th a t are observed.
The subsequent chapters are concerned with the comparative analysis of the data for 32 complete genomes. An analysis of protein domain combinations and its functional ramiflcations is carried out. It is observed th a t the d ata gathered are in good agreement with other studies of this nature. From this, it is also shown th a t the combinatorics of protein domains impacts signiflcantly on the functional repertoire of these domains.
Finally, a tem poral order in which the observed protein folds arose is proposed. Using a combination of phylogenetic profiles and functional d ata a rational protocol for assigning protein folds to points in evolution is suggested. This study also attem pts to take into account the action of horizontal transfer.
A cknow ledgem ents
I would like to thank those people th a t make my life what it is and without out whom I would never have had the patience or the desire to complete this PhD.
I must start by thanking those people who I worked with; The CATH team who included (at one time or another): Sarah Addon, Adrian Akpor, Chris Bennett, Alistair G rant, Ilhem Diboum, David Lee, Frances Pearl, Adrian Shepherd, Stathis Sideris, Annabel Todd. The Thornton Group who included (at one time or another): Tina Eyre, Thomas Kabir, Roman Laskowski, Irilenia Nobeli, Craig Porter, Hugh Shanahan, Neil Stoker. The group of Richard Jackson: Andreas Brakoulias and Stephen Campbell. The Perkins group including; Julian Eaton, P atti Furtado, Joyce Wong. It was a pleasure working with all of these people.
Those of my colleagues who deserve a special mention are; Gail B artlett who was always a wonderful, witty and wordy individual. James Bray, a friend and scientist
par excellence. Brian Ferguson, for his truly hilarious sarcasm, on occasion. Andrew
Harrison, the arguments and illegal betting will not be forgotten. Mike Plevin, whose effortless, suave demeanour (finally) brought a bit of panache to the lab. Oliver Redfern, for keeping me informed of all the developments on the contemporary gay scene. Gabby Reeves, she has had to put up with so much in the name of science. Stuart Rison, a colossus of a man in so many ways (all of them scientific of course). Ian Sillitoe, without whom this thesis, and many others, would have floundered.
Certainly this work would never have come to completion without the sterling work of the sysadmins: Jahid Ahmed, John Bouquiere, Donovan Bins, Duncan McKenzie and Jesse Oldershaw. Few days go by without me marvelling at their ability to cope with all our attem pts to break the computer network.
I would also like mention those people who had to put up with living with me during my PhD. Jennifer Dawe, a great flatmate and a great colleague. Amy Gillon, who, as we all know, smells (of hortheth). Charles Inge, rarely will you find a man so generous, the consummate gentleman. Kevin Murray, huge, Scottish, excellent! Gordon W hammond, please never be weak, never be a loser. Victoria Spong and Kayne Green, definitely most excellent house mates.
but those who stand out are; Charles ‘Pierre de la Paries’ and Alice W hittaker, two peas popped from the cheekiness pod but no less special for it. Katie Sparkes, her good old fashioned debauchery will never go out of style. Katherine O ’Hara, she has beauty and sarcasm in excellent combination. ‘Charlie’ Charlton, truly the single most friendly person I’ve ever had the pleasure of meeting. Richard Carr, just Ricky, what more can I say. Mike W hite & Ryan Webster, dear old friends. Many thanks to Corin Yeats, his ability to concede an argument without ever adm itting he is wrong is even more spectacular than mine. Arif Baig, Dave Daley, Jasvinder Johal, Clare Tanton and Pete Wootton, they helped me through my first degree and their friendship helped me through this one. Diane Langford, as she’s a real sweetie.
Hey, i t ’s kind of like the oscars this, only with more science and fewer hot mod
els.
The following groups of people also deserve a mention; M att Barton, Simon Duck, Justin Funnell, Tim Godwin, Colin Welch and all those at Commonground for bringing their world to my evening. The Buttercuts Crew, especially Andy Oury, Big up. Pete Myers and the Smiling Fish posse who were always truly hilarious and truly dodgy. All those at the Big Chill internet forum for providing so much amusement and distraction and so many new friends. My Jitsu club, for weekly beatings. Finally, the folks at Adverse Camber, glitch, glitch, glitch, giitch, gutch.
I would especially like to thank my supervisors Christine Orengo and Janet Thornton. Christine has provided support, kindness and help th at I shall never forget. I shall always remember Janet for her good humour, sharp intellect and sage advice. I can not thank either of them enough for allowing me to work in their labs and allowing me to work with such wonderful people.
I must thank my brother and sister, Luke and Mairead Buchan, two of the most marvellous, interesting, intelligent, funny people you could ever wish to meet let alone be related to. My mother, R uth Buchan, deserves a special mention, she has been nothing other than an inspiration to myself and so many of my friends for so many years.
This work is dedicated to Zoe Alvey, Lucy Wren and, m ost importantly,
C on ten ts
T itle 1
A bstract 2
A cknow ledgem ents 3
D edication 5
C ontents 6
List o f Figures 13
List o f Tables 16
1 Introduction 18
1.1 In tro d u c tio n ... 18
1.2 D ata Sources ... 18
1.2.1 Structure of G e n e s ... 18
1.2.1.1 Deoxyribonucleic A c i d ... 18
1.2.1.2 Gene S tr u c tu r e ... 19
1.2.1.3 Structure of P ro te in s ... 20
1.2.2 Sequencing ... 20
1.2.2.1 Di-deoxy Sequencing... 20
1.2.2.2 Genome S e q u e n c in g ... 21
1.2.3 Sequence D atab ases... 22
1.2.3.1 G e n B a n k ... 22
1.2.3.2 S W IS SP R O T /T rE m bI... 22
1.2.3.3 P I R ... 23
1.2.3.4 OWL ... 23
Contents 7
1.3.1 Structure S o lv in g ... 24
1.3.1.1 X-Ray Crystallography... 24
1.3.1.2 Nuclear Magnetic Resonance S pectroscopy... 25
1.3.1.3 Cryo-Electron M icroscopy... 25
1.3.2 Protein S tr u c tu r e ... 25
1.3.3 Structural D a ta b a s e s ... 26
1.3.3.1 R epositories... 26
1.3.4 Domain D a t a b a s e s ... 26
1.3.4.1 The CATH d a ta b a s e ... 27
1.3.4.2 The SCOP d a ta b a s e ... 27
1.3.4.3 D a liF S S P ... 28
1.4 Gene and Genome A n n o ta tio n ... 31
1.4.1 Functional a n a ly s is ... 31
1.4.2 Functional Annotation Schemes and Databases ... 31
1.4.2.1 Enzyme C om m ission... 31
1.4.2.2 Gene O n to lo g y ... 31
1.4.2.3 GenProtEC and E c o C y c ... 32
1.4.2.4 Clusters of Orthologous Groups (COG) ... 33
1.4.2.5 MIPS - PEDANT ... 33
1.5 Gene and Genome E v o lu tio n ... 34
1.5.1 Branches of L ife ... 34
1.5.2 The Primacy of R N A ... 34
1.5.3 The Origin of the Genetic C o d e ... 34
1.5.4 Protein and Metabolic E v o lu tio n ... 35
1.5.5 Genomic E v o lu tio n ... 36
1.5.5.1 Horizontal T ransfer... 36
1.5.6 Early Evolution and the Last Common A n cesto r... 37
1.6 A im s ... 39
2 Dom ain A ssignm ent 40 2.1 In tro d u c tio n ... 40
2.1.1 Structural A s sig n m e n t... 41
2.1.1.1 Structural Assignment P ro g re s s ... 41
2.1.1.2 Available Resources ... 41
2.1.2 Sequence Searching M eth o d s... 42
2.1.2.1 Substitution Matrices ... 42
Contents
2.1.2.3 The BLAST F a m i l y ... 43
2.1.2.4 Intermediate Sequence L ib raries... 45
2.1.3 Sequence D atab ases... 45
2.1.4 Whole Sequence Cluster D a ta b a s e s ... 46
2.1.4.1 P r o t o N e t ... 46
2.1.4.2 T R IB E -M C L ... 46
2.1.4.3 S Y S T E R S ... 47
2.1.5 Sequence Domain D a ta b a se s... 47
2.1.5.1 Pfam ... 47
2.1.5.2 D O M A IN E R ... 48
2.1.5.3 D IV C L U S ... 48
2.1.5.4 P R O D O M ... 48
2.2 M e th o d s ... 51
2.2.1 Method O verview ... 51
2.2.2 Structural Domain Assignment ... 51
2.2.2.1 Selection of Dataset for Structural Domain Assignment P ro to c o l... 51
2.2.2.2 Selection of Dataset for Benchmarking Collapse Module . 52 2.2.2.3 Selection of Representative CATH Structural Domains . . 52
2.2.3 Identification of Sequence Relatives to Domains in CATH Database Using PSI-BLAST and DomainFinder ... 54
2.2.3.1 DomainFinder ... 54
2.2.3.2 DRange : A Suite of Modules to Verify Domain Assignments 55 2.2.4 Making Structural Assignments to G e n o m e s ... 59
2.2.5 Sequence Domain Assignments ... 59
2.2.5.1 Selection of the Dataset for Pfam Sequence Domain As signments ... 59
2.2.5.2 Building a Pfam Domain L i b r a r y ... 61
2.2.5.3 Benchmarking the Pfam IMPALA l i b r a r y ... 61
2.2.6 Sequence Clusters A s sig n m e n ts ... 63
2.2.6.1 Selection of the Dataset for Generating MkDom Sequence C lu s te r s ... 63
2.2.6.2 Building Sequences Clusters using M kD om ... 63
2.3 R e s u lts ... 64
2.3.1 Domain Distribution A n a ly s is ... 64
2.3.1.1 Proteome Assignment Levels ... 64
Contents
2.3.1.3 Unannotated Regions ... 70
2.3.2 Assignment S ta tistic s ... 70
2.3.2.1 Relationship of Genome Size to Number of Genes Annotated 70 2.3.2.2 Distribution of Domain O c c u rre n c e s ... 72
2.3.3 Fold U sage... 77
2.3.3.1 Fold Usage And Glades ... 77
2.3.3.2 Domain Assignments to Genes ... 77
2.4 C onclusion... 81
2.4.1 Domain Assignment P ro to c o ls... 81
2.4.2 Unique Sequences... 82
2.4.3 Common Assignment P a tte rn s ... 82
2.4.4 Fold O ccurrence... 83
2.4.5 D ata R e s tric tio n s ... 83
2.5 Resource D e s c rip tio n ... 85
2.5.1 Gene3D Web Server ... 85
2.5.1.1 D ata Mining with the Gene3D d a t a b a s e ... 86
2.5.1.2 Statistics for the Genomes in the Gene3D Web Server . . 87
Functional A nnotation 89 3.1 In tro d u c tio n ... 89
3.1.1 W hat is F u n c t i o n ? ... 89
3.1.2 Structure Based A n n o ta tio n ... 90
3.1.2.1 D o c k in g ... 90
3.1.2.2 Active Site C o n fo rm a tio n ... 91
3.1.3 Context Based A n n o ta tio n ... 92
3.1.3.1 The ’Rosetta Stone’ m e th o d ... 92
3.1.3.2 Phylogenetic P ro file s... 92
3.1.3.3 Gene P ro x im ity ... 93
3.1.3.4 Integrated P rediction... 93
3.1.4 Sequence Based A n n o ta tio n ... 93
3.1.4.1 Cluster of Orthologous G r o u p s ... 94
3.1.5 Functional Classification S ch em es... 94
3.1.5.1 The Enzyme C o m m issio n ... 95
3.1.5.2 G e n P ro tE C ... 96
3.1.5.3 Ontologies and Annotation ... 96
3.1.5.4 Gene O n to lo g y ... 97
Contents 10
3.1.7 Intermediate Sequence L ib ra rie s... 98
3.2 M e th o d s ... 99
3.2.1 Annotation O bjective... 99
3.2.2 Functional Annotation P ro to c o l... 99
3.2.3 The CATH Protein Family D a ta b a s e ... 99
3.2.4 D ata Selection...101
3.2.5 Converting the ENZYME d a t a b a s e ...101
3.2.6 GenProtEC A n n o t a t i o n ...102
3.2.7 Annotation of the P F D B ...102
3.2.7.1 Prim ary and Secondary A n n o tatio n ...102
3.2.7.2 Secondary Annotation of Sequences... 102
3.2.8 Functionally Annotating G enom es...103
3.3 R e s u lts ... 106
3.3.1 Annotation of the C A TH -PFD B ...106
3.3.2 Functionally annotating a G e n o m e ...107
3.3.3 Database Contribution to Functional A n n o t a t i o n ... 108
3.3.4 GenProtEC BLAST ...109
3.3.5 Most Frequently Recurring F u n c tio n s... 112
3.3.5.1 Environmental Response F u n c tio n s ... 112
3.3.5.2 Anomalous Functions ...113
3.3.6 Functional and Domain Level U b iq u ity ... 117
3.3.6.1 Domains Associated with Multiple Functions ... 117
3.3.6.2 Functions Associated with Multiple Domain Families . . . 117
3.4 C onclusion...121
3.4.1 PFDB A n n o t a t i o n ... 121
3.4.2 Genome A n n o t a t i o n ... 121
3.4.3 Database U s e ...122
3.4.4 Genome B i a s ...123
4 D om ain Combinatorics 124 4.1 In tro d u c tio n ...124
4.1.1 Protein D o m a i n s ... 124
4.1.2 Protein G e n e s is ... 125
4.1.2.1 Small World N e tw o rk s...125
4.1.2.2 Scale Free N e tw o rk s ...126
4.1.3 Power Laws and Zipfs L a w ... 127
Contents 11
4.2.1 M e th o d s ...129
4.2.1.1 D ata S e le c tio n ! . . . . 129
4.2.1.2 Domain Partnering N e tw o rk s ... 129
4.2.2 R e su lts...130
4.2.3 Conclusion... 136
4.2.3.1 Model A ppropriateness... 136
4.2.3.2 Domain Partnering M o d e l... 136
4.3 Functional C o r r e la tio n ... 140
4.3.1 M e th o d s ...140
4.3.2 R e su lts...140
4.4 Functional C o m b in a to ric s ...142
4.4.1 M e th o d s ...142
4.4.2 R e su lts...142
4.4.2.1 Common Domain C om binations... 142
4.4.2.2 Functionality and Evolution of Domain Combinations . . . 145
4.4.2.3 Repetitive Domains ...149
4.4.2.4 Evolution of Domain O r d e r ...149
4.5 C onclusion... 152
4.5.1 Networks for L i f e ...152
4.5.2 Domain Recom bination... 152
5 Fold Em ergence 154 5.1 In tro d u c tio n ...154
5.1.1 Organism Evolution ... 154
5.1.1.1 Horizontal T ransfer...155
5.1.2 Phylogenetic p r o f ile s ... 156
5.2 Methods and A n a l y s i s ... 158
5.2.1 D ata Selection... 158
5.2.2 Analysis T h e o ry ...158
5.3 R e s u lts ... 158
5.3.1 Initial Population of Fold Emergence P o i n t s ...158
5.3.1.1 Eldest F o ld s... 160
5.3.1.2 Eukaryotic F o l d s ...163
5.3.1.3 Archaeal F o l d s ... 167
5.3.1.4 Bacterial F o l d s ... 168
5.3.1.5 Evolutionary A n o m a lie s... 170
Contents 12
5.3.2.1 Assessing Profile C o n t e n t ... 172
5.3.2.2 Estim ating Missing G e n o m e s ... 173
5.3.3 Updated Fold P o p u la tio n s ... 175
5.3.3.1 The Expanded Eldest S e t ...175
5.3.3.2 Archae-Eukaryal F o ld s ... 177
5.3.3.3 Further Evolutionary Anomalies ...179
5.3.4 Accounting For Horizontal T ra n s fe r...180
5.3.5 Fold U sage...185
5.4 C onclusion... 187
5.4.1 Fold Evolution E stim ate s... 187
5.4.2 Complexity in Early E volution... 187
5.4.3 Eukaryotic P r o b le m s ... 188
5.4.4 Fold C ov erag e... 188
5.4.5 Use of Homologous S u p e rfa m ilie s... 188
5.4.6 “Genetic Annealing” ...189
6 D iscussion 190 6.1 Domain P ro life ra tio n ... 190
6.2 Life is Not as Gomplicated as You Think it is ... 192
6.3 Future W o rk ... 193
List of A bbreviations 196
List o f Figures
1.1 Deoxy-Ribonucleic acid... 19
1.2 The physiochemical properties of the amino acids... 21
1.3 Example protein structure... 22
1.4 Di-deoxy sequencing... 23
1.5 Example X-Ray Diffraction p attern ... 24
1.6 Component parts of protein 3D structure... 29
1.7 The growth of the PD B ... 30
1.8 The classification process for the CATH database... 30
1.9 Thesis Chapter relationships... 39
2.1 The process of building libraries of PSSMs with BLAST... 44
2.2 Transitive Closure... 50
2.3 The order in which domains are assigned to protein sequences... 52
2.4 DomainFinder consensus and extreme derivation... 55
2.5 DRange Typical assignments... 56
2.6 DomainFinder’s cautious assignment of consensus re g io n s ... 57
2.7 The Collapse module... 58
2.8 The process of domain resolution using M ulitparse... 59
2.9 The CleanAssign module’s decision flowchart... 60
2.10 Formula for calculating error rate... 63
2.11 The error curve for the Pfam-CATH IMPALA model library benchmarking. 63 2.12 The percentage domain coverage of the genes in each o rg a n ism ... 67
2.13 The percentage of residues annotated... 68
2.14 Remaining sequence segments after domains have been assigned... 71
2.15 The relationship of genes in a genome to the number of genes with an annotation... 71
2.16 Tthe percentage of genes with domain annotation per genome... 72
2.17 Occurrences of a families of domains among all three clades...73
2.18 The occurrences of domain families within the three m ajor clades of life. . 74
List o f Figures 14
2.19 The rpercentage use of domain types from the four m ajor CATH classes. . 78
2.20 The distribution of genes by the number of domains in the gene... 79
2.21 The distribution of genes by the number of domains assigned to genes. . . 80
2.22 An overview of the GeneSD server... 88
3.1 The assembly method for COGs in the GOG database... 95
3.2 The process used to annotate the GATH-PFDB... 100
3.3 The relationships th at either allow or prevent functional annotation inher itance... 104
3.4 Conservation of EG number versus sequence i d e n t i t y . ... 105
3.5 Percentage increase in functional annotation th at were used to annotate the GATH-PFDB... 106
3.6 Percentage of each genome th at has been functionally annotated...107
3.7 The percentage of any genomes’ protein sequences th a t are functionally annotated... 110
3.8 Level of annotation of each genome using GenProtEC where cross annota tion is performed using only BLAST... I l l 4.1 The spectrum of network types... 126
4.2 Network disintegration... 127
4.3 The formal definition of Zipfs law... 128
4.4 An example of the ideal inverse linear double Log relationship of Zipfs law. 128 4.5 Assembling networks based on domain partnerships... 130
4.6 Occurrences of a domains and their partnered domains... 131
4.7 The double natural Log plot of the data plotted in figure 4.6...131
4.8 The decay of x against Log y...132
4.9 The relationship of Log y (see figure 4.6 and x (see figure 4.6) raised to the power of 2 /3 ... 132
4.10 The relationship of the predicted values of y to the known values of y. . . . 133
4.11 The relationship between the number of domain partners and the number of occurrences of a domain... 134
4.12 Double Log plots of the data presented in figure 4.11...135
4.13 Two types of network model... 137
4.14 This example of the potential outcome of five iterations of the model pro posed in the Domain Partnering Model... 139
4.15 Formal definition of Spearman’s Rank Correlation Coefficient...140
List o f Figures 15
4.17 Reducing domain combinations to strings... 143
4.18 The schematics of domain duplication for domain reordering... 151
5.1 Example of Phylogenetic profile building...157
5.2 The universal tree of life... 159
5.3 The ‘Tree of Life’ with primary bins of fold emergence marked...161
5.4 Population of fold classes in the primary evolutionary bins... 163
5.5 Pie chart of the functional class of the earliest folds... 164
5.6 Pie chart of the functional class of the eukaryotic folds...167
5.7 Pie chart of the functional class of the bacterial folds... 170
5.8 Model of the emergence of the three clades by a gradual ‘crystallisation’ process...172
5.9 Phylogenetic profile building is influenced by the quality of the sequence searching method used...173
5.10 Pie chart of the functional classes of the expanded set of eldest folds. . . . 178
5.11 The percentage of the CATH Classes in the eldest set of protein folds. . . . 178
5.12 The percentage of folds used by each genome th a t falls into one of the bins in the assignment protocol...186
List o f Tables
1.1 The four primary levels in the SCOP database...28
1.2 List of gene product classification schemes... 32
2.1 The primary levels in the CATH database... 53
2.2 Genome Assignments... 66
2.3 The ten most popular folds present in all organisms and within each of the three major clades... 75
3.1 The Databases referenced in Chapter 3... 96
3.2 The most common functions observed... 116
3.3 The protein domains associated with the most functions... 119
3.4 The functional types from the three databases (COG, GI2EC and GenProt) th a t are associated with the most domain types... 120
4.1 The most common combinations of domain types... 144
4.2 The domain names and code for the most common domains...147
4.3 The domain combinations with the most associated functions... 148
5.1 Prim ary evolutionary b i n s ...160
5.2 Folds seen in all of the organisms... 162
5.3 Folds present in the eukaryotes but not seen in either the bacteria or the archaea... 167
5.4 Folds seen in the archaea but not seen in any bacteria or either of the eukaryotes... 168
5.5 Folds present in the bacteria and not present in the archaea or the eukaryotes. 170 5.6 Folds seen in all of the bacteria and both of the eukaryotes but not present in any of the archaea... 171
5.7 Folds present in all of the archaea and all of the bacteria and not present in the two eukaryotes...172 5.8 Folds Selected on the Basis of being Present in 73% (23) of the 32 genomes. 177
List o f Tables 17
5.9 Folds Selected on the basis of being present in at least 73% (5) of the
archaea and eukaryotes and not present in the bacteria... 179
5.10 Folds selected on the basis of being present in 73% (21) of the bacteria and archaea but not present in the archaea... 180
5.11 Folds selected on the basis of being present in 73% (18) of the bacteria and eukaryotes and not present in the archaea...180
5.12 Folds potentially transferred from the bacteria to the archaea... 182
5.13 Folds potentially transferred from the bacteria to the eukaryotes... 182
5.14 Folds potentially transferred from the archaea to the bacteria... 183
5.15 Folds potentially transferred from the archaea to the eukaryotes...183
5.16 Folds potentially transferred from the eukaryotes to the bacteria...184
C hapter 1
In trod u ction
1.1
Introduction
T h at we will never possess the resources or time to structurally and functionally char acterise all proteins, all genes and all molecular systems within all extant organisms represents a major intractable problem for modern Molecular Biology and Biochemistry. However, it is noted th at, where components of cells share sufficient similarity, inferences made about one component can be transfered to the other (Todd et ai, 2001), it is a consequence of extant life’s use of a finite list of components th a t makes this possible. Unfortunately the list of components is not trivially small. It is the detailed analysis of these components be they genes, proteins or protein structures th a t has occupied Bio chemistry and Molecular Biology for nearly 200 years. A consequence of these years of work is th a t large databases of such data have now been compiled. We have now arrived at a position where sufficient data has accrued within these databases, th a t our inabil ity to biochemically characterise all extant organisms can be circumvented. Two of the biggest and most significant of these databases are the structural database ‘The Protein D atabank’ (Berman et a l, 2000) and the gene sequence database ‘GenBank’ (Benson
et a l, 2002).
1.2
D ata Sources
1.2.1
S tructure o f G enes
1.2.1.1 D eoxyribonucleic Acid
The genomes of living organisms are made from Deoxyribonucleic acid, DNA. Genes are those portions of DNA sequence within genomes which code for hereditary characteristics.
Chapter 1. Introduction 19
usually thought of as proteins. DNA is a large non-heterogeneous organic macro-molecule, constructed from nucleotides, which in turn are made up from one of four organic bases, rib ose sugar and phosphate groups (see Figure 1.1). The four organic bases used in DNA are adenine, thymine, guanine and cytosine (two pyrimidine and two purine) usually abbreviated to A,T,G,C (see figure 1.1). The individual nucleotides are polymerised by the covalent bonding of the free 3’ end to the free 5’ end of the nucleotides so th a t large chains containing much information can be created.
5'- end
I
0
I
0 = P —0 — CH2 o
I
' "
0“
BASE
Phosphate Group Deoxyribose
F ig u r e 1.1: Deoxy-Ribonucleic acid. Diagram indicates position o f 3 ’ and 5 ’ ends where subsequent nucleotide monomers polymerise. The flag marked ’B A S E ’ indicates where one of the four organic bases adenosine, thymine, cytosine and guanine bond.
1.2.1.2 Gene Structure
Chapter 1. Introduction 20
structure or function.
1.2.1.3 Structure of Proteins
Proteins are built from sequences of amino acids (residues) which are polymerised to gether by ribosomes using mRNA as a template. Extant life uses only twenty amino acids (Alberts et a i, 1994). The twenty amino acids have a range of physio-chemical properties from acidic to basic and from hydrophobic to hydrophilic (see Figure 1.2. Taylor (1986)). Any given protein is folded into a characteristic three dimensional structure which is determined by the specific sequence of the amino acids used to build th a t protein. The combination of the sequence and structure a protein possesses leads to its functional char acteristics (enzyme activity, cellular localisation, etc). The structures conventionally pack in such a way th a t hydrophobic residues are buried within the core and the hydrophilic residues lie on the surface (Branden & Tooze, 1998). Proteins are folded into compact globular structures called domains, an example of which can be seen in Figure 1.3. It is thought th a t the domain represents an evolutionary unit and the process of evolution combines these to create novel proteins. At their simplest a protein may consist of only one chain consisting of a single domain. However, a chain of amino acids may fold into several domains and several chains may aggregate to build a complete protein. Currently there are thought to be only around one thousand unique structures used in nature (Wolf
et a i, 2000).
1.2.2
Sequencing
The Techniques of gene sequencing began in the mid-twentieth century with Maxam- Gilbert chemical sequencing pioneered by Allan Maxam and W alter Gilbert (Maxam & Gilbert, 1977). This was soon followed by the the development of the di-deoxy sequencing m ethod of Sanger et ai (1977).
1.2.2.1 D i-deoxy Sequencing
Chapter 1. Introduction 21
Small Proline
Tiny
Aliphatic
'C harged Negative
Polar
Aromatic
Positive
Hydrophobic
F ig u r e 1.2: Adapated from Taylor (1986). Venn diagram of the physiochemical properties of the amino acids. Amino acids are represented as letters; Alanine (A), Cystine (C), Aspartic acid (D), Glutamic acid (E), Phenylalanine (F), Glycine (G), Histidine (H), Isoleucine (I), Lysine (K), Leucine (L), Methionine (M), Asparagine (N), Proline (P), Glutamine (Q), Arginine (R), Serine (S), Threonine (T ), Valine (V), Tryptophan (W ), Tyrosine (Y).
replicated DNA of random length being produced with a di-deoxy base terminating the chain. Repeated rounds of heating and cooling allow a complete range of chain lengths to be produced. The use of the thermostable DNA polymerase I from Thermus aquati-cus allows the DNA polymerase to withstand the repeated cycles of heating and cooling. The process is repeated to use all four of the 2’,3’-di-deoxy analogues. Finally the four mixtures are run on an agarose gel in four columns, one for each di-deoxy base mixtures. As the different chain lengths produced run to different lengths on the gel and the known di-deoxy base represents a base in the DNA the sequence can be read from the gel (see Figure 1.4). The use of either hourescently labelled or radio labelled bases allows the fragments to be easily read.
1.2.2.2 G en o m e S eq u en cin g
Chapter 1. Introduction 22
F ig u r e 1.3: An Example protein structure. The structure shown is that of the porcine ribonuclease inhibitor. The structure’s pdb code is 2bnh. This is an example of a protein constructed from a mixture of ^-sheet and Q-helical regions.
increasing number of genomes are completed on a monthly basis.
1 .2 .3
S eq u e n c e D a ta b a se s
1.2.3.1 GenBank
GenBank is the largest of the DNA sequence databases. All public sequencing projects are required to submit every completed segment of DNA greater than 1000 base pairs. GenBank currently holds '^16,000,000,000 base pairs of nucleotide sequence which repre sents ~15,000,000 protein sequences, however among these only there are only ~900,000 unique (non-redundant) protein sequences. GenBank also stores the complete sequences of the publicly sequenced genomes.
1.2.3.2 SW ISSPROT/TrEm bl
ex-Chapter 1. Introduction 23
DNA, Primer, Nucleotides, DIdeoxy nucleotides
1
Replication Cycles
r m
T C G A
Sequencing m ixtures X" prepared. DNA polym erase
added for replication cycles.
>
Sequencing m ixtures loaded onto polyacrylamide gel for separation. S equences a re read from th e bottom up
J
F ig u r e 1.4: Di-deoxy sequencing. The reaction mixtures are prepared to include the D N A to be sequenced, a primer, the four nucleotides and one o f the four di-deoxy nucleotide analogues. Four mixtures (one for each di-deoxy nucleotide analogue) are prepared and then run on a polyacrylamide gel. The sequence can be read by reading the bands from the bottom up.
tra '-^850,000 proteins provide a greater coverage of those proteins present in GenBank although with significantly lower quality annotation.
1.2.3.3 P IR
The Protein Information Resource (PIR) (Wu et a i, 2002), maintained by the National Biomedical Research Foundation (NBRF), is a comprehensive non-redundant database of protein sequences. The database was originally developed to provide a well-annotated re source for investigating evolutionary relationships between sequences. Release 72.02 con tains 283,177 entries. While smaller than many of the other protein sequence databases, this is compensated for with a high level of annotation.
1.2.3.4 OWL
Chapter 1. Introduction 24
1.3
P rotein Structure
1.3.1
S tr u c tu r e S o lv in g
1.3.1.1 X-Ray Crystallography
The science of solving protein structure began in 1960 with the resolution of haemoglobin at atomic level (Kendrew, 1961). This first structure, solved using X-ray crystallogra phy, marked what was to become an ever increasingly im portant field of Biology and Biochemistry. The process of X-ray crystallography involves solving the X-ray diffraction patterns generated from a crystallised sample of protein (see Figure 1.5). The diffraction pattern gives the intensity of the reflections of the X-rays but no phase information, this is known as the phase problem: The phase problem was originally solved using isomorphous replacement whereby heavy atoms, which scatter X-rays more strongly, are incorporated into the protein and a second diffraction pattern is recorded. An alternative is the use of anomalous scattering to determine phase information. Some atoms within a protein will scatter X-rays anomalously and this effect can be used to resolve the phase of the diffraction pattern. Once the intensity and phase of the X-rays is known an electron den sity map of the the protein can be computed using Fourier Synthesis. Finally, the protein chain is fitted to the electron density map to give the three dimensional structure.
* *#**#### # • ###.###
. VW » * # #,'# .# t k»* •> # # 4 » # # * * - # » m t
m ♦
Chapter 1. Introduction 25
1.3.1.2 Nuclear M agnetic Resonance Spectroscopy
The technique of nuclear magnetic resonance spectroscopy (NMR) began to be applied to protein structure in the late nineteen seventies and early eighties. NMR has yet to show the scaling properties of X-ray crystallography and currently the largest protein structures th a t can be solved are around 25-30 kilodaltons. NMR exploits the different spin properties of hydrogen atoms when in different molecular environments. A pure sample of protein is placed in a large magnetic field and pulses of radio waves are applied. The radio waves disturb the spin states of the hydrogen atoms and the detectors measure the atom ’s return to their resting states (relaxation). Fourier transform ation is applied to the relaxation curves to generate frequency data and this yields a one dimensional spectra as series of resonances from various nuclei. Hydrogen atoms are usually the only atom in proteins th a t can be detected by NMR. Hydrogen nuclei can be identified in the spectra if they have a unique chemical environment as this causes a chemical shift in the nuclei’s frequency in the spectra. The major contributing factors to the chemical shift in the spectra are: the atom to which the hydrogen nuclei is bonded, the proximity of aromatic rings and hydrogen bonding. Information about peptide chain conformation is a result of either interactions through space (the Nuclear Overhauser effect, NOE) or through covalent bonds (J bond coupling). NOE effects between hydrogen nuclei which are close in the sequence can give information about the secondary structure within a protein, whereas NOE effects between hydrogen atoms th at are more distant in a structure give information about the conformation of the proteins structure. The computational process of simulated annealing generates a series of models of a protein backbone th a t satisfy all of the NOE effects within the NMR data.
1.3.1.3 Cryo-Electron Microscopy
This relatively new technique is being used to make low resolution, > 5 Â, images of large macro-molecular complexes such as the ribosome (Davies & W hite, 2000) and the GroEl complex (Roseman et a l, 1996). The technique involves flash freezing samples of macro-molecule complexes and taking electron microscope images of the sample. From these images the structures of the complexes can be reconstituted by computer.
1.3.2
P rotein Structure
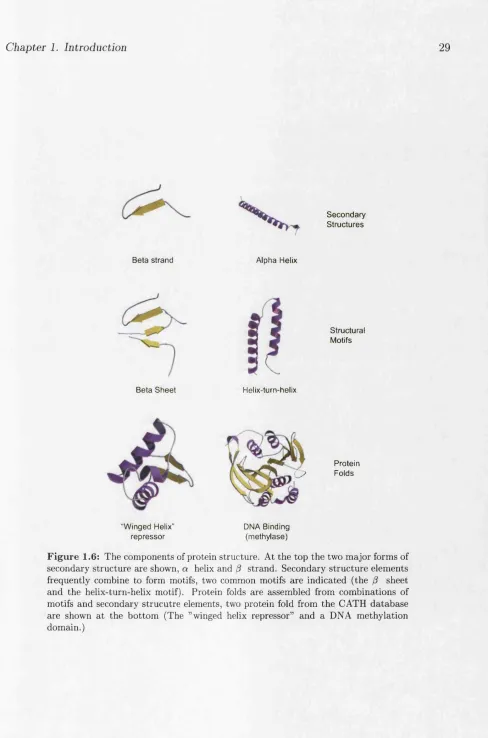
Once solved protein structures are seen to adopt regular, recurring sub-structures (see diagram 1.6). At the lowest level amino acids can be arranged as either strands,
Chapter 1. Introduction 26
arrange themselves into regular motifs such as the P sheet and helix-turn-helix motif. The regular motifs within protein folds can be described by the particular hydrogen bonding patterns they display. The arrangement of a protein’s a helices and P sheets lends the protein its fold (the tertiary structure). Structural domains in proteins may also be contiguous or non-contiguous. The 3D strcuture of a domain need not contiguous in sequence space. There are many instances where a whole domain is inserted into the middle of an existing domain. However, once folded the two separated se quence portions of the initial domain still come together to make the complete 3D domain.
Many domains are seen to adopt very similar 3D structures and the most com mon of these structures are regarded as “Superfolds” . Superfold structures include the TIM barrel, the immunoglobulin fold and the Rossmann fold. While the actual structures are very different they do share some common structural features. Superfolds are highly regular in their arrangement and display close packing of the secondary structure elements (a helices and sheets). These structures are thought to fold easily and the close packing is believed to assist in stability of the fold.
1.3.3
Structural D atabases
1.3.3.1 R epositories
Today there are three major repositories of protein structural data all three of which overlap to a great extent. These are the ’Protein D atabank’ at the RCSB (Berman
et ai, 2000), the European Macro-molecular Structure Database (EMSD) at the European
Molecular Biology Laboratory (EMBL) (Keller et a i, 1998) and Macro Molecule structure Database (MMDB) at the National Centre for Biotechnology Information (NCBI) (Wang
et al, 2002). The Protein Databank represents the major central repository for publicly
solved protein structures and has been established since 1971. At the time of writing, it houses 16082 protein structures, 1050 nucleic acid structures and 18 carbohydrate structures. The number of structures deposited each month number approximately 300 and is increasing (see Figure 1.7). All deposited structures are given an alpha-numeric code of the form Idan. The EMSD project represents a European mirror of the PDB and the MMDB is a further mirror in the United States.
1.3.4
D om ain D atabases
Chapter 1. Introduction 27
mixing and matching of these leads to new protein functions via adaptive evolution.
1.3.4.1 The CATH database
The CATH database (Pearl et ai, 2001) is a hierarchical classification of the proteins deposited in the RCSB PDB. The CATH database is compiled in a semi-automatic fashion using a com putational and manual assignment protocol. CATH uses only well-resolved structures < 3 Â. The classification breaks down into eight levels. The First, Class (C), divides proteins into four groups based on their total amounts of alpha helix and beta strand. The four groups are; all a-helical proteins, all /3-sheet proteins, mixed a-helical and ^-sheet proteins and finally proteins displaying few secondary structure elements. The second level, Architecture (A), divides proteins by their gross arrangements of secondary structure in 3D. The third level. Topology (T), indicates the fold of the protein and divides proteins based on the connectivity of the secondary structure elements. The fourth level. Homologous Superfamily (H), divides the folds into groups th a t have a clear evolutionary relationship based on both structural and functional data. Finally, each homologous superfamily is divided into a series of Sequence families, the S level, at 35, 60, 95 and 100 percent sequence identities.
New structures are incorporated into CATH (see Figure 1.8) by first matching the structures to sequence families th at already exist. Next the protein chains are divided into domains using a computed consensus method (Jones et al, 1998) where this fails domain boundaries are assigned manually. At this stage domains are assigned a Class, then the structural assignment protocols SSAP (Orengo & Taylor, 1996) and GRATH (Harrison
et al. (2002)) are used to assign the majority of structures to T and H levels. Finally
each fold is assigned a numerical code based on its position in the hierarchy. These follow the format: 1.10.10.10.1.1.1.1. Each subsequent number indicating the various levels in CATH; C, A, T, H, S35, S60, S95 and SlOO respectively.
1.3.4.2 The SCOP database
Chapter 1. Introduction 28
SCO P Class D escription
Fam ily Proteins clustered together on the basis of having common
evolutionary origin e.g. those with greater the 30% sequence identity or whose structures and functions are highly similar.
SuperFam ily Proteins with very low sequence identity but display common structures or common functional features
Com m on Fold Superfamilies and families which have similar secondary structure arrangement and the same connectivity.
Class All ot-helical proteins, all /0-sheet proteins, mixed a-helical /0-sheet proteins or a-helical plus /0-sheet proteins
T a b le 1.1: The four primary levels in the SCOP database.
1.3.4.3 D aliFSSP
Chapter 1. Introduction 29
S e c o n d a ry S tru c tu re s
B eta stran d Alpha Helix
B eta S h e e t Helix-turn-helix
S tructural Motifs
Protein c ? Folds
“W inged Helix" re p re ss o r
DMA Binding (m ethylase)
Chapter 1. Introduction 30
20000
18000
16000
14000
12000
10000
8000
6000
4000
2000
I deposited structures for the year I total available structures
rJ 1 rf1
rO rfl r
Y e a r
last update: 2 2 -Jan-2002 F ig u r e 1.7: The growth of the PDB from 1972. Taken from the RCSB-PDB http://w w w .rcsb.org/ (Berman et al., 2000)
DHS
Homot
M S Grath ConA
Cora Arch
F ig u r e 1.8: The classification process for new proteins in the CATH database. New sequences enter at the top left of the diagram and are compared pairwise with each other and the entries in the database (HOMOL, Orengo et al. (1997)). Those that have not been identified as a sequence match are then compared using IMPALA (Schaffer et al., 1999). Where homologues are found a structural comparison with all the members of the homologous superfamily (SSAPH) is performed, DHS (Bray
Chapter 1. Introduction 31
1.4
Gene and G enom e A nnotation
1.4.1
Functional analysis
Gene Annotation requires the vast array of data compiled from the experimental work in Molecular Biology and Biochemistry in the last 100 years. Over time this d ata has been collected in a series of functional databases.
1.4.2
Functional A n n otation Schem es and D atab ases
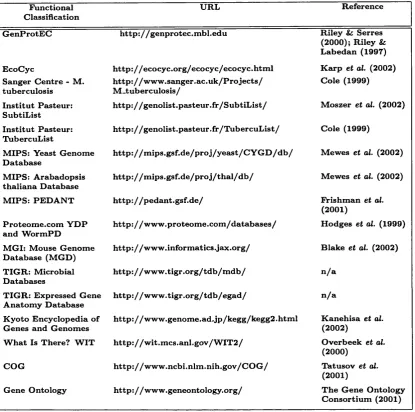
To date there are a large number of databases of protein functions, each implementing a range of separate and often overlapping ontologies (Rison et al., 2000) (see Table 1.2). The best established of these include GenProtEC (Riley & Serres, 2000; Riley & Labedan, 1997), EcoCyc (Karp et al., 2002), KEGG (Kanehisa et al., 2002) and MIPS:PEDANT (Mewes et al., 2002). Alongside these is the ongoing Enzyme Commission project which seeks to classify enzymes based on their enzymatic activity. The Gene Ontology (The Gene Ontology Consortium, 2001) project is an attem pt to establish a complete functional annotation schema for all organisms.
1.4.2.1 Enzym e Com m ission
The Enzyme Commission (The Enzyme Commission, 1992) is a system for assigning enzymes to specific categories based on the chemistry of their reaction schemes. The scheme is hierarchical and has four levels and once classified enzymes are given a unique number which identifies the reaction that they carry out (E.G. number). The top level of the hierarchy describes the type of reaction performed and the subsequent levels describe various features of the reaction such as substrate or catalytic mechanism.
1.4.2.2 Gene O ntology
Chapter 1. Introduction 32
F u n ctio n a l C la ssifica tio n
U R L R efe r e n c e
G e n P r o tE C h ttp : / / g en p r o te c .m b l.e d u R ile y & S erres (2 0 0 0 ); R ile y & L a b ed a n (1 9 9 7 )
E co C y c h t t p : //e c o c y c .o r g /e c o c y c /e c o c y c .h t m l K a rp e t al. (2 0 0 2 ) S a n g er C e n tr e - M .
tu b e r c u lo sis
h ttp : / / w w w .s a n g e r .a c .u k /P r o je c t s / M -t u b e r c u lo s is /
C o le (1 9 9 9 )
I n s tit u t P a steu r: S u b tiL ist
h tt p ://g e n o lis t .p a s t e u r .f r /S u b t lL is t / M o sz e r e t al. (2 0 0 2 ) I n s tit u t P a steu r:
T u b ercu L ist
h t t p : //g e n o lis t .p a s t e u r .f r /T u b e r c u L is t / C o le (1 9 9 9 )
M IP S : Y ea st G e n o m e D a ta b a se
h t t p : // m ip s .g s f .d e / p r o j / y e a s t / C Y G D / d b / M ew es e t al. (2 0 0 2 ) M IP S : A ra b a d o p sis
th a lia n a D a ta b a se
h t t p : / / m i p s .g s f .d e / p r o j / t h a l / d b / M e w e s e t al. (2 0 0 2 ) M IP S : P E D A N T h t t p : // p e d a n t .g s f .d e / F rish m a n e t al.
(2 0 0 1 )
P r o te o m e .c o m Y D P an d W o rm P D
h t t p : //w w w .p r o t e o m e .c o m /d a t a b a s e s / H o d g e s e t al. (1 9 9 9 ) M G I: M o u se G e n o m e
D a ta b a se (M G D )
h t t p : / /w w w .in fo r m a tic s .ja x .o r g / B la k e e t al, (2 0 0 2 ) T IG R : M icro b ia l
D a ta b a se s
h t t p : // w w w .t ig r .o r g / t d b /m d b / n / a
T IG R : E x p ressed G en e A n a to m y D a ta b a se
h t t p : // w w w .t ig r .o r g /t d b / e g a d / n / a
K y o to E n c y c lo p e d ia o f G e n e s an d G e n o m e s
h t t p ://w w w .g e n o m e .a d .jp /k e g g /k e g g 2 .h tm l K a n e h isa e t al.
(2 0 0 2 )
W h a t Is T h ere? W IT h t t p : // w i t .m c s .a n l.g o v /W I T 2 / O v erb ee k et al.
(2 0 0 0 ) C O G h t t p : //w w w .n c b i.n lm .n ih .g o v /C O G / T a tu so v e t al.
(2 0 0 1 )
G en e O n to lo g y h t t p : / / w w w .g e n e o n to lo g y .o r g / T h e G e n e O n to lo g y C o n so r tiu m (2 0 0 1 )
T a b le 1.2: List of gene product classification schemes, references and URL. Adapted from Rison et al. (2000)
a “part o f’ type where any one term is either an instance of its parent or is part of i t ’s parent’s function/ complex.
1.4.2.3 G enProtEC and EcoCyc
Chapter 1. Introduction 33
1.4.2.4 Clusters o f Orthologous Groups (COG)
The COG database (Tatusov et al., 2001) is a database of clusters of related genes from a range of 44 organisms. The orthologous genes are recognised using sequence matching methods. Once the genes are clustered, using sequence matching methods, they are assigned a function common to the genes in th a t cluster. All of the clusters are further grouped into one of eighteen functional classes (Translation, transcription etc).
1.4.2.5 M IPS - P E D A N T
Chapter 1. Introduction 34
1.5
G ene and G enom e Evolution
Any systematic comparative project requires as its bedrock a thorough understanding of those processes which have brought about the extant genomes th a t we see today. It is necessary to appreciate the manner in which the genomes physically arose and how the metabolic systems th a t they code for evolved.
1.5.1
Branches o f Life
For many years it was assumed th a t there were five branches on the ‘Tree of Life’; Ani- malia, plantae, fungi, bacteria, protoctista (Margulis & Schwarts, 1998; W hittaker, 1959). W ith the advent of gene sequencing techniques and the sequencing of ribosomal RNA (rRNA) this was to change. Woese et al (Woese et al, 1990) noted th a t there there were only three distinct branches on the tree of life, bacteria, archaea and eukarya and th at many of the original branches were merely subgroups within these three prim ary clades.
1.5.2
T he P rim acy o f R N A
Most proposed models for the ‘Last Universal Common Ancestor’ (LUCA) or its prede cessor imply an RNA dominated world where both enzymatic function and information storage are carried out by RNA. One of the greatest problems with this theory is the inability of RNA to reliably fold into defined structures capable of catalysis (Herschlag, 1995). A linked problem is th a t of the leap th at life seemingly made to incorporate pro teins into a system th at, seemingly, did not need them. People have begun to postulate th a t proteins initially became associated with RNA as a form of RNA chaperon, helping RNA to maintain or find its native (functional) conformation. Once this relationship is established then it follows th at proteins gradually began to take over the enzymatic functions they were more suited to. Di Giulio (1997b) has put forward th a t the earliest proteins present in the LUCA were likely to have been those, as defined in the structural databases (CATH, SCOP etc), as all /3-sheet proteins. However the idea th a t proteins became part of the LUCA as a results of being RNA chaperons would suggest this is not the case as RNA binding proteins in modern organisms are largely mixed alp h a/b eta structures
1.5.3
T he Origin o f th e G enetic Code
Chapter 1. Introduction 35
the transfer RNA (tRNA) synthetases we see today evolved from a smaller primordial subset, which would have coded for a small subset of the twenty amino acids used today (Di Giulio, 1997a; Jimenez-Sanchez, 1995; Hartman, 1995). However, there is still some disparity about how th a t genetic code arose and in what order. The opinion of some is th a t the code originated as a doublet pairing of only two types of nucleotides (Jimenez- Sanchez, 1995; Hartm an, 1995) which encoded four amino acids and this later expanded to include a third base and with th at came two further expansions of the amino acids available. There is argument about which two nucleotides came first, either A and U (Jimenez-Sanchez, 1995) as derived through analysis of the biosynthetic pathways of the amino acids, or C and G as derived through analysis of the distribution of base usage in the codons (Hartman, 1995). Whichever scheme is chosen results in a different set of initial amino acids and as the different amino acids are shown to spontaneously and preferentially adopt certain secondary structures this has great ramifications for which protein folds were available to early life. A further argument is th a t the code began as a triplet (Herschlag, 1995) as there is no satisfactory explanation as to why or how the physical components of transcription and translation could expand from a doublet system to accommodate a third base.
1.5.4
P rotein and M etabolic Evolution
Chapter 1. Introduction 36
1.5.5
G enom ic E volution
Any given genome is, of course, the result of years of evolution and it is clear th a t there are processes th a t alter the genomic composition other than the requirement for new or more highly adapted metabolic processes. The clustering of genes, the nucleotide usage, codon usage and promoter usage are all measurable and highly evolved features th a t affect the make-up of any genomes. Huynen & Bork (1998) have used such features to asses the magnitude of evolution between sets of genomes. Having established a set of baseline measurements to asses evolutionary ‘distance’ they use these to inform a series of further observations. They note th at for studying gene regulation, those genomes th a t are phylogenetically closest are the most appropriate to study. On the other hand, the study of metabolic evolution requires the comparison of those genomes th a t are most distantly related.
1.5.5.1 H orizontal Transfer
It has become clear, from an increasing number of studies, th a t a large number of genes in genomes are not derived through linear inheritance but have been acquired by horizontal gene transfer (Ochman & Jones, 2000; Ponting et ai, 1999; Ochman et a i, 2000). One system for identifying foreign DNA is the analysis of the C-l-G content (Ochman & Jones, 2000). It has been demonstrated th at at least 17.6% of the E.coli genome has arisen through horizontal transfer via at least 234 transfer events since its divergence from the salmonella lineage (Ochman et ai, 2000). These figures are disputed by Wang (2001) as he suggests th a t any horizontal transfer candidate requires strong statistical support as C-l-G content is affected by a range of factors.
While not initially viewed of major importance in genome evolution it is now clear th a t horizontal transfer has indeed been a major driving feature in the adaptation and evolution of most, if not all, organisms (Davison, 1999). Microbial organisms, in particular, still rely on horizontal transfer and have been shown to be capable of acquiring DNA from the environment and a wide range of sources. Ponting et a i (1999) have demonstrated th a t bacteria and archaea possess a range of eukaryotic signalling domains which are assumed to have been acquired by horizontal gene transfer. These include the P ad l, von W illebrand factor type A, SH3 and YWTD domains. They also went on to indicate when during divergence, they believed these domains were acquired by various lineages.
Chapter 1. Introduction 37
constant in size. This implies th a t the rate which genes enter a genome by horizontal transfer must be matched (approximately) by the rate at which genes are degraded from a genome (Andersson & Andersson, 1999). The processes controlling genome degradation are obviously dependant on other external selection pressures as most obligate microbial parasites and intracellular parasites have genomes ~1 Mega bases (Mb) in size, whereas free living microbes have much larger genomes (up to several Mb).
1.5.6
E arly E volution and the Last C om m on A n cestor
It is a widely held belief th a t all extant life is derived from some form of LUCA. The single use of uniform stereochemistry within sugars, DNA and amino acids (and hence proteins), the universal use of DNA as a genetic storage medium, protein building mediated by mRNA transcription/ translation and a common triplet coding mechanism within the coding regions of DNA are often cited as evidence th a t all extant life has emerged in the last three and a half billion years from a common ancestor. Debate continues over whether this LUCA was a progenote (without a defined genotype- phenotype relationship) or whether this organism was some form of cenancestor of great molecular complexity after Di Giulio (2000). Woese (Woese, 1998) argues for an early progenote evolution th at was biased towards horizontal transfer as its prim ary means of disseminating genetic information. He argues th a t for the LUCA to have been a totipotent organism capable of linear inheritance (parent to progeny inheritance) and of most, if not all, cellular biochemistry seen today (a cenancestor), is highly unlikely.
Chapter 1. Introduction 38
Chapter 1. Introduction 39
1.6
Aims
The following chapters approximately divide into two sections: Chapters 2 and 3 are primarily concerned with data generation and each chapter features a broad analysis of the data generated. Chapters 4 and 5 present further, more detailed, analysis of the data generated in chapters 2 and 3. However, all four chapters are concerned with answering the question of “How have protein domains proliferated within the genomes of extant or ganisms?” Chapter 2 presents the protocol for assigning structural and sequence domains to those protein sequences of unknown domain make-up. In Chapter 3 a protocol for assigning functions to non-annotated sequences in the CATH-PFDB (see Chapter 3) is developed and its application for genome annotation is discussed. The first of the anal ysis chapters. Chapter 4, looks to investigate how domains proliferate through genomes. Chapter 4 also considers what impact a protein domain’s function has on its prolifera tion. The final analysis chapter. Chapter 5, looks at the order of protein structural domain emergence. This work also seeks to integrate domain function as a method of providing further information about the order of a domain’s appearance in evolution. Figure 1.9 indicates how the work in each chapter is interlinked.
C h a p te r 2: D om ain A ssig n m e n t C h a p te r 5; Fold E m e rg e n c e
S e q u e n c e Domains Structural Domains Protein Structural Dom ain E m ergen ce
Domain Proliferation Function Proliferation EC G enProtEC CO G s
C h a p te r 4: D om ain C o m b in ato rics M--- C h a p te r 3: F u n c tio n a l A n n o ta tio n
C hapter 2
D om ain A ssignm ent
2.1
Introduction
Proteins are largely thought to be made up of unique domains whose interactions lead to the varied aspects of their functionality (Sonnhammer & Kahn, 1994). Many databases attem pt to group the component domains of proteins either as families of structural domains (Dali/FSSP, CATH, SCOP, (Holm & Sander, 1997; Pearl et a/., 2001; Lo Conte
et a i, 2002)), or as families of sequence domains (InterPro, Pfam, PRINTS, PROSITE,
ProDom, SMART (Apweiler et ai, 2001a; Bateman et a/., 2002; Attwood et a/., 2002; Falquet et ai, 2002; Corpet et al, 2000; Letunic et ai, 2002)). In silica biology attem pts to assign functions to protein sequences based on sequence similarity to proteins in these protein family databases. Many of these resources provide facilities for searching with a new sequence to determine functional properties, by inheritance, from a putative relative.
On a genome wide basis, GeneQuiz (Iliopoulos et al, 2001) was one of the first resources which attem pted to provide functional annotations for a complete genome,
Saccharomyces cerevisiae, by assigning functions from related sequences in the sequence
databases. Approximately 60% of the genes could initially be annotated in this way, and for about 20% of the genes, structures could also be assigned. Among the most powerful methods currently available for assigning distantly related sequences to sequence families are the profile based methods (e.g. PSI-BLAST (Altschul et a i, 1997)) and hidden Markov models, such as SAM (Karplus et ai, 1998) and HMMer (Eddy, 1998). Various studies (Park et a l, 1998; Salamov et al, 1999) have dem onstrated their sensitivity over other pairwise methods (e.g. BLAST, FASTA) for remote homologue detection (those relatives with <40% sequence identity). Recently, Muller et a l (1999) showed th at approximately one third of a set of very distant homologues from the SCOP database.
Chapter 2. Domain Assignment 41
previously identified through similarities in their structures, could be matched using PSI-BLAST. Using these techniques, GeneQuiz is currently able to assign functions for between 30 and 80 percent of genes in any given genome.
2.1.1
Structural A ssignm ent
As well as improving function prediction for genome sequences, further significant bene fits can be obtained by identifying the structural family to which the sequences belong. Knowledge of the structure allows the mapping of functionally im portant residues iden tified experimentally or from sequence alignments, to their physical locations, to provide im portant insights into functional mechanisms and the impact of single nucleotide poly morphisms (SNPs). Furthermore, because structure is more conserved than sequence, multiple alignments generated from structural comparisons are more accurate th an those generated from sequence alone, particularly for distant homologues. Thus, multiple struc ture alignments, and the profiles derived from them, can often improve the detection of conserved residues (e.g. catalytic residues), or sites associated with function (Valdar & Thornton, 2001).
2.1.1.1 Structural A ssignm ent Progress
Considerable progress has been made in providing structural annotation for genes and whole genomes. The most powerful methodologies, which employ sequence profiles (e.g. PSI-BLAST), or fold recognition methods (e.g. GenThreader, 3D-PSSM), can provide some structural annotation for up to 50% of small microbial genomes e.g Mycoplasma
genitalium (Salamov et a/., 1999; Huynen & Bork, 1998; Muller et a i, 1999). Profile based
methods generally assign structures to about 40% of the proteins in M. genitalium (Muller
et a/., 1999), whilst threading algorithms currently provide annotations for nearly 50% of this genome (Jones, 1999). Teichmann et a l (1999) give a full review of structure annotation of genomes.
2.1.1.2 Available Resources