Electronic Theses and Dissertations Theses, Dissertations, and Major Papers
1-1-1967
The effects of vestibular vertigo produced by the rotating-chair
The effects of vestibular vertigo produced by the rotating-chair
method on the production and reproduction of time durations.
method on the production and reproduction of time durations.
Gerald Ronald Getty
University of Windsor
Follow this and additional works at: https://scholar.uwindsor.ca/etd
Recommended Citation Recommended Citation
Getty, Gerald Ronald, "The effects of vestibular vertigo produced by the rotating-chair method on the production and reproduction of time durations." (1967). Electronic Theses and Dissertations. 6479. https://scholar.uwindsor.ca/etd/6479
METHOD ON THE PRODUCTION AND
REPRODUCTION OF TIME DURATIONS
by
GERALD RONALD GETTY
B.A., University of Windsor, 196?
A Thesis
Submitted to the Faculty of Graduate Studies through the Department of Psychology in Partial Fulfillment
of the Requirements for the Degree of Master of Arts at the University
of Windsor
Windsor, Ontario, Canada
INFORMATION TO USERS
The quality of this reproduction is dependent upon the quality of the copy
submitted. Broken or indistinct print, colored or poor quality illustrations and
photographs, print bleed-through, substandard margins, and improper
alignment can adversely affect reproduction.
In the unlikely event that the author did not send a complete manuscript
and there are missing pages, these will be noted. Also, if unauthorized
copyright material had to be removed, a note will indicate the deletion.
®
UMI
UMI Microform EC52660
Copyright 2008 by ProQuest LLC.
All rights reserved. This microform edition is protected against
unauthorized copying under Title 17, United States Code.
ProQuest LLC 789 E. Eisenhower Parkway
A C - W - X L C U i , ,
This study was designed to investigate the
effects of vestibular vertigo produced by the rotating-
chair method on the production and reproduction of time
durations.
The experimental group consisted of ten subjects
who received both conditions of rotation and non-rotation
while making estimates under the method of production
and the method of reproduction on the standard stimulus
intervals 2", 5". 7". and 10”. The apparatus consisted of
a rotating-chair, tone producer, tape recorder for giving
standard instructions, and a recording clock. Rotation of
subjects was accomplished manually using an acceleration-
deceleration, energy pulse system.
Results were analyzed both by statistical
analyses of variance; orthogonal tests for trends; and
graphically using both ordinary graphic materials and
log.-log. graphic materials. Scores for the analyses were
in the form of total deviation scores and mean estimate
specified. The results also showed that there was some
basis for the assumption that the two methods of time
estimation used were founded on different underlying basis.
The method of reproduction was found to demonstrate a larger
variability of error than the other method, but no
differences were evident to show variation between the two
methods in terms of average estimates, or average error.
The average error of both methods was found to
always be negative. That is, subjects produced and
reproduced shorter estimates than the standard stimulus
intervals. Increases in estimate durations varied directly
in proportion with the magnitude of the stimulus interval
and were best described by linear graphic resresentation
only. The increases in estimate duration were found to
vary as a power function with magnitude of stimulus
intervals.
This research was initiated as a result of the
author’s interest in the possibilities of the use of
distortion of the time sense by rotation in the facilitat
ion of psychological conversion (ie. ’brainwashing’). It
was decided to test whether or not rotation and vertigo
was a workable factor in the distortion of the human time
sense, specifically distortion of the abilility to estimate
time intervals.
The author wishes to express his gratitude to
Dr. Byron P. Rourke, Mr. Donald H. Richardson M.A., and
Rev. J. R. Dougherty C.S.B. , M.Sc. , for their kind
direction and aid in this investigation. My special
gratitude to Rev. G. Freemesser C.S.B., M.D. for his
most generous donation of time and medical aid without
which this study would not have been possible.
Finally, the author expresses his deep gratitude
to the ten subjects who had the courage to take part in
this experiment with the knowledge that they would
probably experience great physical discomfort.
Page
P R E F A C E ... iv
LIST OF T A B L E S ... vi
LIST OF F I G U R E S ... . vli Chapter I INTRODUCTION ... 1
Review of the Literature . . . . 3
Purpose of the Present Study . . . 11
II METHODOLOGY AND PROCEDURE . . . 12
S u b j e c t s ... 12
A p p a r a t u s ... 13
P r o c e d u r e ... 16
III PRESENTATION OF R E S U L T S ... 23
Statistical Analysis ... 23
Graphic Analysis ... 28
Analysis of T r e n d ... . . 32
IV DISCUSSION OF R E S U L T S ... 35
V SUMMARY AND C O N C L U S I O N S ...
kZ
APPENDIX A Sample Medical Form - Release Form . . APPENDIX B Instructions ... ^7APPENDIX C Computational Formulae ... ^9
BIBLIOGRAPHY... 50
VITA A U C T O R I S ...52
Table Page
1 Analysis of Variance Summary Table
on Total Deviation Scores ... 26
2 Analysis of Variance Summary Table
on Mean Estimate .Scores... 28
3 Summary Table for Orthogonal Tests
of T r e n d ... 33
Figure Page
1 Schematic representation of the
a p p a r a t u s ... 15
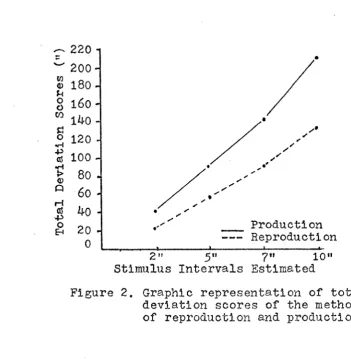
2 Graphic representation of total deviation scores of the methods
of reproduction and production . ... 29
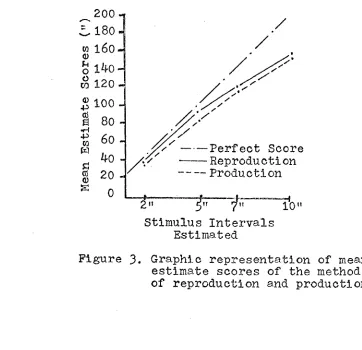
3 Graphic representation of mean estimate scores of the method
of reproduction and production ... 31
INTRODUCTION
It is apparent from a review of the literature
concerning time estimation that there has been no
investigation of the effect of vestibular vertigo upon the
estimation of time. This may seem strange when consider
ation is made of the fact that there is an expanding body
of research which deals separately with the areas of time
estimation and vertigo. This study was designed to combine
these two areas of research in order to investigate the
effects of vestibular vertigo upon time estimation in
humans.
The term ’vertigo’ as used in this work will
refer to vestibular vertigo. This type of vertigo is
elicited by rotation of the head, with the following
consequences: a sense of disequilibrium or dizziness;
nystagmus; (and under conditions of extreme rotation),
flushing due to increased peripheral circulation; increased
heart and respiration rates; and nausea. Following is an
example which demonstrates the dynamics underlying
vestibular vertigo. When a person is rotated to the right
with the head in an upright position, an inertial lag in
the endolymph fluid of the right horizontal semicircular
canal occurs. Thus the endolymph is made to move past
hairlike sensory receptors (the crista) in the swelling of
that semicircular canal (the ampulla). This in turn leads
to not only consciousness of movement but also compensatory
eye movements in a direction opposite to that of the
rotation.
Since reflex eye movements occur during rotation
as a result of the movement of the endolymph in the
semicircular canals, these movements have been used in many
studies as an indicator of vertigo. Harris (1963)♦ used the
duration and speed of this eye movement (nystagmus) as a
test of the presence and severity of vertigo. A brief
description of this phenomenon is called for due to the
importance of nystagmus in the investigation of vertigo.
~ I n the forementioned example of rotation to the
right, stimulation of the crista occurred. The crista of
the semicircular canals are connected by secondary nerve
fibers to the extrinsic ocular muscles of the eyes. Impulses
caused by the flow of endolymph during rotation initiate
the left. The second phase consists of a rapid jerking back
of the eyes to the right. During deceleration of rotation
the nystagmic movements are reversed; that is, the slow
phase is to the right and the fast phase is to the left.
Review of the Literature
It is important to note for studies requiring
the production of vertigo some of the factors which affect
the production and maintainance of vertigo. Habituation to
rotation occurs If rotation is kept at a constant velocity
due to the fact that no movement of the endolymph in the
semicircular canals exists once the inertial lag occuring
at the onset of rotation has been overcome, (Carlson, 1961;
Langley, 1958). This fact suggested the use of energy pulses
in rotation in the present work to maintain vertigo.
Further evidence for the inclusion of an energy
pulse system of rotation is provided by the studies of
Alexander, (19^5a » 19^5t>). which attempted to specify the
major causative factors in the production of motion sickness.
These studies have relevence to the study of vestibular
Alexander studied the effects of variation of time intervals
between accelerations and variation of the wave energies
on the production and intensity of motion sickness.
It was found that the interval between equal
energy pulses of acceleration (in an apparatus similar to an
elevator), was a factor in the production of motion sickness.
The optimal interval between accelerations was 1.1 se-conds.
Periods above and below that Interval did not have as much
effect on the production of motion sickness. Alexander
also found that when the Interval between accelerations
was held constant at 1.1 seconds the magnitude of the total
wave energy was a greater factor in the production of motion
sickness than was the interval between pulses.
These findings point out the necessity for
providing pulses of energy during rotation rather than a
constant rotation rate system. A pilot study was carried
out to find the best manner in which this system could be
usedand it was found that vertigo was produced and maint
ained at an optimal level when rotation was at a rate of
approximately thirty-six R.P.M. for six revolutions of the
the original rate of rotation {36 R.P.M.) being resumed.
The problem of habituation to rotation is most
Important in the current investigation since subjects make
their estimates while experiencing vertigo during the
rotation phase of the procedure. Research into this problem
tends to support the observation that habituation does occur
and that once it has occurred its effects are long lasting.
Forssman (1963)» studied the response decline to
repeated caloric irrigation of the inner ear and found that
the physiological responses of vertigo habituated in a cert
ain order. This order was found to be: diminution of
dizziness sensations; followed by deareases in the total
duration of nystagmus. Lindvall (1961) found comparable
results in the ordering of habituation effects. Both
researchers found that dysrhythmia of nystagmus and the
eventaual disappearance of nystagmus were positive indicators
of vertigo habituation. Thus it was decided that the
experimenter would check subject nystagmus by visual
examination both as an index of the presence of vertigo
and the presence of habituation effects.
This precaution was considered most important to
to be of long standing duration. Studies indicate that
evidence of habituation can be found on retest after: two
weeks (Lindvail, 1961); three weeks (Guedry, 1965); and
one month (Collins, 196*1-).
The literature yielded two factors which appear to
aid in the control of habituation to rotation. These factors
were blocking vision of the subjects during rotation and the
role of activity-filled time during rotation.
Collins (1962), used both caloric and rotational
methods of producing vertigo and found that continuous
concentration on tasks maintained rotation symptoms well
above the level of subjects who experienced vertigo without
being required to engage in any activity. Collins (196*0 ,
found that when given a visual task to perform subjects
habituated sooner than blindfolded controls. Guedry (196*0.
found supporting evidence which indicated that the use of
vision facilitated the habituation to rotation.
In order to prevent or minimize the habituation
effects it was therefore decided to blindfold subjects dur
ing the rotational phase and to reduce to a minimum the time
when subjects were either not listening to instructions or
Investigation of the literature revealed one
study which involved in part rotation and time estimation,
although the rotation was in fact centrifugation. This
study is worthy of note since it is hypothetically possible
that some of the results of this study might have occurred
due to symptoms similar to vestibular vertigo.
This study, conducted by Frankenhauser (i960),
used a ’bucket centrifuge* to assess the subject's time
sense, (by a variation of the method of reproduction) when
the subjects were subjected to three gravities of radial
acceleration. It was found that the subjects consistently
overestimated the stimulus intervals; that is, they
produced shorter estimates than the duration of the
standard stimulus tones.
Vertigo which occurs during centrifugation is
believed to be caused by anoxia of the brain centres and
the inability of the body to rid brain tissues of carbon
dioxide. It is worth speculation to ask whether the vertigo
experienced in the centrifugation experiment was a prime
factor in the distortion of time estimates in addition to
the effects of brain anoxia.
time estimation itself. Methods of time estimation, their
theoretical bias, their respective accuracy with regard to
standard objective time, and so on are still subjects of
much controversy.
Bindra and Waksberg (195&)* attempted to bring
some order to the study of time estimation by specifying
terminology and methodology relevent to time estimation.
They point out that much of the seemingly contradictory
results of time estimation studies arises from not only the
wide variation in methods used but also from the lack of a
uniform terminology with which to describe results.
In the current study it was decided to employ both
the method of reproduction and production1in assessing
time estimation. The method of production as defined by
Bindra and Waksberg is operationally defined as follows:
subject is given a verbal command instructing him to make a
tone of a specified length; the subject then makes his est
imate by pressing down a buzzer for the specified time. The
method of reproduction is operationally defined as follows:
the experimenter presents a tone of a certain duration; the
subject is then required to reproduce that tone's duration
by pressing down a buzzer until he perceives his tone to
Characteristic differences in time estimates
made under the methods of production and reproduction have
not as yet been specified with any surety. There is some
evidence which indicates that these two methods of time
estimation are founded on different underlying basis,
(Clausen, 1950; Ochberg, 195*0. Evidence also exists which
points to the fact that these two methods do not differ,
(DuPreez, 19&3). With reference to accuracy, Danziger (1963)
points out that the estimates made under the ’estimation’
methods (production and verbal estimation) are less accurate
than reproduction methods. Danziger’s findings are however
the reverse of the findings of Siegrnan (1962), who found
estimation methods more accurate than reproduction.
It is obvious then that the question of whether
these methods of time estimation are really different and
involve a different underlying basis is far from being
answered. Differences between these two methods will be
assessed in the current study both under conditions of
rotation and non-rotation.
Connected with the question of the differences
which may be present between these two methods of time
estimation is the question of whether estimates made under
Recent studies have attempted to discover if there
was any type of trend exhibited in the estimates of subjects.
These studies have mainly dealt with the method of reprod
uction and have shown that ther is a general linear trend
revealed in the subjective time estimates (Mallick, 1962;
Nelson, 1963; Richards, 196*0.
The present study will therefore also attempt to
determine the type of trend presented by estimates made
under the method of production and the method of reprod
Purpose of the Present Study
The present study was undertaken to investigate
whether or not vertigo which was produced by the rotating-
chair method had any effect upon time estimations made under
the methods of reproduction and production. Thus invest
igation of whether rotation and vertigo were factors in the
distortion of time estimates was studied.
The present study also was designed to investigate
whether or not the estimates made under the method of
production and the method of reproduction were different.
That is, does the method of reproduction differ from the
method of production with regard to their underlying basis.
Further, the present study was Initiated to
investigate the relationship of the estimate scores for the
two methods and under the two conditions of rotation and
non-rotation. Since some evidence exists which seems to
indicate a linear trend in the estimates of reproduction
scores, orthogonal tests for trend were undertaken to find
out if linearity was a characteristic of the estimates of
METHODOLOGY AND PROCEDURE
Subjects
Ten adult male students who volunteered to take
part in this experiement were chosen from the University
of Windsor population.
The criteria for subject selection was as follows
(1), each S was a volunteer and was told that the procedure
might make him ill and that he was free to refuse to take
part in the study; (2), if the subject agreed to take part
in the study he was required to give a relevent medical
history and pass a medical examination, conducted by a
licensed medical practioner, which ruled out any contra
indications to rotation and the induction of vertigo; (3).
the subject was required to sign a ’release from
responsibility form’, releasing the experimenter, the
Psychology Department, and the University of Windsor from
responsibility for any adverse effects of rotation;
(h
),each subject was required to demonstrate ocular nystagmus
and report feeling dizziness after experiencing rotation in
the apparatus for a period of 30 seconds at a speed of
36 R.P.M. ( A sample medical check list and Release from
Responsibility form are presented in Appendix';A. )
Apparatus
A standard office swivel chair was modified for
use in the production of vertigo. Modification of the chair
includeds (1), the installation of bolts in the tilt-frame
of the chair to stop the chair from tilting backwards; (2),
a handle was affixed to the back of the chair to allow for
manual rotation; (3). an adjustable head rest was installed
on the chair’s back which allowed subject’s head to be held
erect and in one plane;
(k),
a footrest was fixed to thefront of the chair; (5), elongeated arm rests were placed on
the chair to accomodate the battery powered tone producer
and amplifier apparatus; (6), earphones were attached to the
headrest assembly; (7), four copper bands were insulated and
affixed to the spindle of the chair such that they artic
ulated with four soft wire brushes fixed to the chair’s
base to allow electrical communication between the elect
rical apparatus on the chair and the recording and stimulus
presentation devices apart from the chair.
The electrical section of the apparatus was
modified telegraph key), was connected to a buzzer which
was situated over the antenna coil of a small transistor
radio. Oscillation of the buzzer reed was picked up by the
radio which was tuned to short wave frequency (and off
.commercial radio station of course). The volume control of
the radio was thus used to modulate the volume of the buzzer
and the volume of the buzzer was equalized with the volume
of the stimulus buzzer which was recorded on tape. The
battery powered amplifier was in circuit with the subject’s
earphones
The tone key was also wired such that when pressed
it completed an internal circuit in the recording clock
which was in another part of the laboratory. While the:
key was depressed the clock registered the elapsed time
of the estimates. Circuitry to and from the chair was
accomplished by the brush-copper band arrangement.
A standard tape recorder was used to present the
instructions and stimulus tones to the subjects. Instructions
and stimulus tones had been prerecorded and circuitry from
the tape recorder to the subject’s earphones was again
accomplished by the brush-copper band mediators. The
stimulus intervals prerecorded were: 2", 5". ?". and 10".
presented three times in random order.
A large clock with a sweep second hand was used to
time rotational rates in order to get average rotation rates.
A schematic representation of the apparatus is presented
in Figure 1. below.
Figure 1. - Schematic representation of the
Procedure
Each subject was first seated in the chair and
• the headrest was adjusted to his height and was adjusted
backward and forward such that the subject was comfortable
and the horizontal semicircular canals were parallel to
the floor. The positioning of the semicircular canals was
accomplished by lining up an imaginary line drawn from the
centre of the eye to the centre of the ear with the floor.
The earphones were then adjusted to the subject
and the blindfold was put in place. All instructions for
each of the four tasks which would be performed were given
to the subjects while they were not rotating and while they
were not experiencing any rotational symptoms.
Each subject was first given instructions which
familiarized him with the operation of the tone producing
key. These instructions were taped and were repeated twice
as follows:
Under your right hand is an apparatus for making a tone. When the key is pressed down you will hear a tone in your earphones.
the tone producer works? .... Are you
able to hear the tone in your earphones clearly?
Once familiarization with the tone producer had
occurred each subject was presented with the general instr
uctions for the first estimation task. One-half of the
subjects received the general instructions for the method of
production first and the other five subjects received the
Instructions for the method of reproduction first. This was
done to balance out any effects of possible learning cues
which might have been present if one method aided in alter
ing the estimates of the other unduly. General instructions
for both of these groups were made for the condition and
non-rotation first since it was felt that giving the rotat-
atlon portion of the experiment first might cause too many
adverse side effects which might have unduly influenced the
results of the non-rotation estimates following. Thus,
although the order of of presenting production and reprod
uction varied, the condition of non-rotation always preceded
the condition of rotation in this study.
General instructions for the methods of production
and reproduction, under conditions of rotation and
non-rotation are presented in Appendix B. General instructions
were repeated twice and subjects were given time to ask any
The procedure for the group receiving the prod
uction task first will be used to show the procedural orders
here. The procedure for the other group will of course be
reversed. Subjects were first given the method instructions
of the reproduction task , then were given the first stim
ulus tone via the earphones and tape recorder. They were
free to make their response tone when they wished and once
it was completed the next stimulus tone was presented as.
quickly as possible. The stimulus tones were 2", 5". 7
",
and10", for all methods and conditions. The order of these
intervals was however randomized to prevent order effects
and three estimates were made on each duration under each
task section.
The interval between stimulus conclusion and
response initiation was not controlled by the experimenter
in order that.-any anchoring effects of this interval would
not be introduced.
After completion of the reproduction task the
subjects proceeded to the production task. The general
instructions were again given twice and the first verbal
command was given. The specific verbal command was
repeated twice in order to equilize the total time taken
It was found that repetition of the instructions (of the
general form: Now make a tone X number of seconds long), in
a rather slow measured pace equalized the time taken in
presenting the tone stimuli (2" + 5" + 7" + 10" x 3 = 72")
of the reproduction method. Once again the response latency
period was a dependent variable.
Following the completion of the non-rotation
procedure subjects were given the instructions for the
rotation condition. Again, instructions were given without
rotation. Following the general instructions the subjects
were rotated at speeds starting at 10 R.P.M. for 30" and
proceeding by 6 R.P.M. increases ( each for 30" ) up to a
maximum of
J>6
R.P.M. for 30". This was done to determine thebasal rate of rotation for each subject at which vertigo was
experienced and at which a definite nystagmus was in
evidence. It was found that response to rotation varied
between subjects. That is, one subject experienced rather
heavy signs of vertigo with heavy nystagmus at 16 R.P.M.
Two others experienced the same level of vertigo at 28 R.P.-
M. The remaining seven subjects required J6 R.P.M. to
demonstrate these signs.
Once the basal rate of rotation had been found
procedure was applicable to the rotation condition with
regard to production and reproduction methods of estimation
with the exception that all estimate instruction were given
during actual rotation. It was found in the pilot study that
breaking the two procedures into three sections each, to
allow for the cessation of vertigo symptoms and thus attempt
to decrease habituation effects, was not a practical
procedure since subjects tended to become nauseated and
unable to continue the estimations. This then necessitated
running the twelve estimates in one block for each of the
two methods. It was found that this procedure did not
affect the subjective feeling of vertigo nor the appearance
of nystagmic movements, but it did reduce sickness rates
measurably. As it was, six of the ten subjects reported
nausea and prolonged vertigo following the conclusion of the
rotation procedure. One. subject was omitted from the sample
when he was unable to continue beyond the first method
tested under the rotation condition. For three of the final
ten subjects rotation rates had to be reduced to prevent
outright illnessJ vertigo however did not disappear.
The procedure for stimulus presentation via the
tape recorder, and the method of responding was the same as
in the non-rotational procedure. The only difference in the
estimate instructions were given while the subject was
rotating and experiencing vertigo. Estimation procedure
in each case five seconds following the subject’s signal
that he felt dizzy.
Following the completion of each of the production
and reproduction the subjects were asked if they felt dizzy
during the time that they were making their estimates. They
were also checked for the ocular nystagmus by visual
Inspection by the experimenter. All subjects reported that
they were dizzy most of the time during estimation and all
showed some degree of ocular nystagmus even though this
indicator varied greatly.
A word should be given to the method of rotation
of subjects. The method of rotation was that subjects were
rotated at their basal speed for six revolutions, allowed
to coast without power pulses for three revolutions, and
were then returned to their original basal speed immediate
ly. During the time that their basal speed was being given,
the experimenter added one pulse of energy per powered
rotation revolution. This method proved to be of great
value to the production and maintainance of vertigo since
all subject claimed vertigo symptoms especially during the
The work of the pilot study had previously proved
that constant rotation, even with the addition of power
pulses did not provide the maintainance of vertigo symptoms.
Using the method of acceleration with energy pulses and
deceleration ( giving a rebound vertigo effect ) no loss of
vertigo symptoms was recorded. This method of vertigo
production was however probably most instrumental in
PRESENTATION OF RESULTS
STATISTICAL ANALYSIS
Statistical analysis was performed on two types
of scores: ’total deviation' scores and ’mean estimate’
scores. Total deviation scores were found by summation
(without regard for arithmetic signs) of the deviation of
estimate durations from the durations of the stimulus
intervals on which the estimates were made. Thus, for
example, the three estimates made by Subject A on the
stimulus interval 2" under the conditions of non-rotation,
method of production, might have been 1.50", 2.50" and
4.00". The total deviation scores for these three estimates
would have been .50" + .50" + 2.00" = 3.00".
This score is a measure of the total magnitude of
the error made in estimation of single stimulus Intervals.
The rationale behind the use of this total error score is
most applicable to situations requiring prediction of total
error magnitude as opposed to average error magnitude. In
cases where average error was needed and sufficient in
prediction of error of estimation, the average error can be
readily computed from the mean estimate scores ( by subtrac
tion of the mean estimate scores from the mean stimulus
intervals), and the direction of the average deviation is
then also readily available.
Mean estimate scores were found by taking the
arithmetic average of the sum of the actual estimation
scores. Therefore, in the example previously given, if the
estimates for the interval 2" were 1.50", 2.50" and 4.00",
the mean estimate score would be 1.50" + 2.50" + 4.00" =
8.00"/3 =* 2.67".
Analysis of the mean estimate scores fumishes two
important pieces of Information. Mean estimate scores first
of all indicate the average duration of time estimations.
Secondly, they indicate the directional tendency of the
estimate error; that is, they indlcate whether the average
estimates are larger or smaller than the stimulus intervals
being estimated.
A three way factorial analysis of variance with
repeated measures on all three factors was first conducted
the analysis were the three Independent variables of the
study: (A) rotation and non-rotation; (B), production and
reproduction methods of estimation; (C), the four stimulus
Intervals being estimated, 2", 5". 7". and 10”.
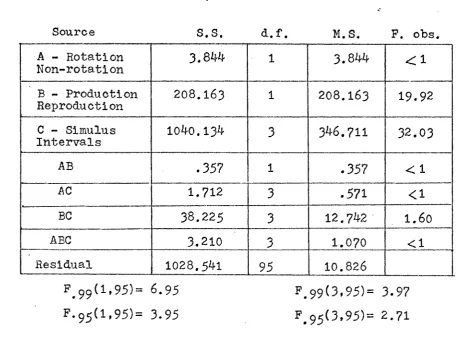
This analysis of variance showed that the total
deviation made under the conditions of rotation and non
rotation did not differ under these conditions. The P obs
erved on factor A was less than 1 , whereas the required
F was 3.95 (.05 confidence level). Thus it would seem that
the introduction of vertigo produced mechanically did not
have any effect on the estimation of time when consideration
of total deviation Is analysed.
Significant statistical differences were however
found on factors B and C. Factor B, the method of production
and reproduction, yielded an F ratio of 19.92 where the
required F was 6.95 (.01 confidence level), showing that
total deviation under the production and reproduction
methods differed. The F ratio for factor C proved to be
32.08 where the required F (F
yy(3,
95)) was 3.97. Thisshowed that the estimates made on the four standard intervals
differed from each other. Thus estimates on different
No interaction effects were found in this
analysis. The analysis of variance summary table is
presented in Table 1 following.
Table 1
Analysis of Variance Summary Table on Total Deviation Scores.
Source S.S. d.f. M.S. P. obs.
A - Rotation Non-rotation
3.8*14 1 3.8*f4 < 1
B - Production
Reproduction 208.163 1 208.163 19.92
C - Simulus
Intervals 10*f0.134 3 3^6.711 32.03
AB .357 1 .357 < 1
AC 1.712 3 .571 <1
BC 38.225 3 12.7*+2 1.60
ABC 3.210 3 1.070 <1
Residual 1028. 5*fl 95 10.826
F.
99(l,95)= 6.95
F.
99(3,95)= 3.97
F.
95(
1,
95)= 3.95
F#
95(3,95)=
2.71Another three way factorial analysis of variance
with the three factors being repeated measures was performed
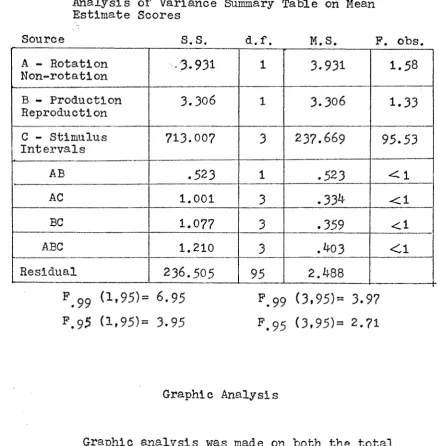
This analysis of mean estimates showed that there
was no significant statistical difference in the mean scores
of factor A , the rotation-non-rotation variable. Thus, once
again, the varible rotation failed to show any statistical
effect on the estimates made on the stimulus intervals.
No statistical difference was found on the
independent variables production and reproduction methods
of estimation, where the P observed was 1.33 (F req. = 3.95).
Thus it was concluded that with respect to average estimate
scores, there was no difference in the method of production
and the method of reproduction.
Factor C ( the standard stimulus Intervals estim
ated) did however show statistical differences once more.
The F ratio for the differences between these interval scores
was 95.53 which was significant at the .01 level of confid
ence ( where F.99(3,95)= 6.95). It was concluded that the
estimates made on the four intervals were different from
each other.
This analysis of variance failed to demonstrate
any statistically significant differences. Table 2 presents
the summary of this analysis of variance. Computational
Appendix C.
Table 2
Analysis of Variance Summary Table on Mean Estimate Scores
Source S.S. d.f. M.S. P. obs.
A - Rotation
Non-rotation •3.931
1 3.931 1.58
B - Production Reproduction
3.306 1 3.306 1.33
C - Stimulus Intervals
713.007 3 237.669 95.53
AB .523 1 .523 < 1
AC 1.001 3 .33^' c l
BC 1.077 3 .359 <1
ABC 1.210 3 .*K)3 < 1
Residual 236.505 95 2.^88
P
.99(1,95)= 6.95
P
.99(3,95)= 3.9?
F.95
(1,95)= 3.95
P
.95(3,95)=
2.71Graphic Analysis
Graphic analysis was made on both the total
deviation scores and mean estimate scores. The graphic
analysis was attempted to investigate the relationships
methods of estimation in terms of both error and average
estimate measures
Figure 2 presented below, is the graphic
representation of the total deviation scores on the four
stimulus intervals made under the methods of production and
reproduction. Since there was no significant difference
between total deviation scores' of the rotation and non-
rotation conditions, the scores represented in Figure 2 are
for deviations under both conditions.
— 220
w 200
o 120
•H cj 100
u
3 180
g
1600
__ Production Reproduction
2" 5*’ 7» 10"
Stimulus Intervals Estimated
It is clear from the inspection of the graphic
data of total deviation scores that the magnitude of total
error increases proportionally with increases in the
magnitude of the stimulus interval being estimated. That is
true of both the total deviation scores of both methods.
It is also evident that the total error of the
estimates for the method of production are greater than the
total err for the same estimate internals for the method
of production. That is, at each level of time estimation
tested , the error of the method of production is greater
than that of the method of reproduction. The differences
in total deviation scores were of course proven to be
statistically different in the analysis of variance of
total deviation scores previously presented.
Figure 3 is the graphic representation of the
mean estimate scores made in the estimation of the four
time intervals under the methods of production and
reproduction. Once again the scores represented in Figure 3
are mean estimate scores for the two methods under both
the conditions of rotation and non-rotation.
Inspection of Figure 3 reveals that there is no
reproduction. This fact was clear from the analysis of
variance on mean estimate scores but it is still evident
that with regard to mean estimates that the method of
reproduction is slightly more accurate than the method of
production even though the method of reproduction is not
statistically proven to be more accurate.
^20 ° £ l 80 co 160. <D
0 1 ^ 0 ■
w 120
£
100 1 80t
60Z
bo
£<
%
20 s 0/
Perfect Score Reproduction Production
2" “H10"
Stimulus Intervals Estimated
Figure 3. Graphic representation of mean estimate scores of the methods of reproduction and production.
Since it was found in the inspection of Fig, 2
that there was a difference in the total magnitude of the
method of reproduction and the method of production, and
production with respect to the plots of Fig. 3 it could be
assumed that the total error was probably negative in direc
tion. To explain, since the average error scores represented
in Fig. 3 are all negative with respect to objective time
(represented by the perfect score), the average error Is also
negative in direction. That is, the average error is in the
direction of underestimating the stimulus intervals.
Analysis of Trend
Since initial graphing of the estimates made under
all conditions and methods appeared to be linear in form
it was decided to investigate the linearity of these
estimates. Orthogonal tests of trend were completed on the
total deviation scores and the mean estimate scores for the
totals of: the production-non-rotation condition; the re
product I on-non-ro tat ion condition; the reproduction rotat
ion condition; the production rotation condition, the
total estimates of the production method; and the total
estimates of the reproduction method. All estimation scores
were tested for linear, quadratic, and cubic trend.
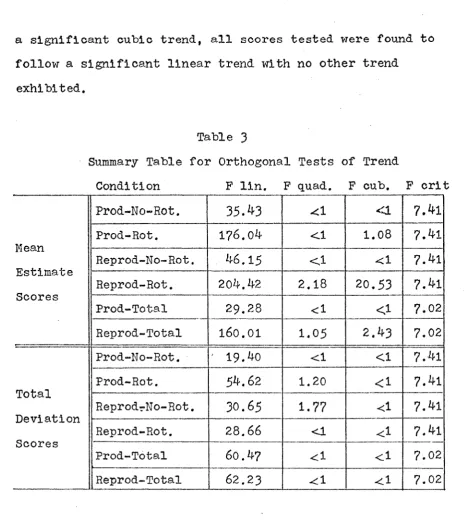
The results of the orthogonal tests for trend
are presented in Table 3 in summary form. The results show
that with the exception of the mean estimate scores for
a significant cubic trend, all scores tested were found to
follow a significant linear trend with no other trend
exhibited.
Table 3
Summary Table for Orthogonal Tests of Trend
Condition F lin. F quad. F cub. F cril
Prod-No-Rot. 35.^3
<1
<1 7.^1Mean
Estimate
Scores
Prod-Rot. 176.0*}- <1 1.08 7.^1
Reprod-No-Rot. 46.15 <1 <1 7.41
Reprod-Rot.
20H-A2
2.18 20.53 7.41Prod-Total 29.28 <1 <1 7.02
Reprod-Total 160.01 1.05
2 A 3
7.02Prod-No-Rot. ' 19.40 <1 <1 7.41
Total
Deviation
Scores
Prod-Rot. 5^.62 1.20 <1 7.41
ReprodrNo-Rot. 30.65 1.77 <1 7.41
Reprod-Rot. 28.66 <1 <1 7.41
Prod-Total 60
A ?
<1 <1 7.02Reprod-Total 62.23 ^1
< 1
7.02As a supplementary test, the scores were graphed
on log.-log. paper to investigate the possibility that
the linearity of the scores was due to a power function.
DISCUSSION OF RESULTS
From the statistical and graphic analysis of the
data, both in terms of error scores and average estimates it
is evident that rotation and vertigo did not have an effect
on the estimation of the time intervals specified in this
study as 2",
5".
7" , and 10". This finding may be due to thefact that vertigo has no effect on time estimation whatever.
But there is also the possiblllity that the apparent lack of
effect found was due to some uncontrolled factors in the
experimental procedure. It seems wise to outline some
of these possible weakpolnts in the present procedure if
for no other reason than to suggest changes to be made for
further research.
One of the first criticisms of the present study
was that symptoms of vertigo were not constantly present
during the presentation of the stimulus intervals and
during the response times of the rotational phase of the
procedure. The energy pulse system of rotation, even with
the addition of an acceleration-deeeleration procedure was
not sufficient to maintain symptoms of vertigo at all times
during rotation. For example, during the pulse phase of the
rotation, subjects reported that dizziness tended to wear
off. During the deceleration phase, the subjects reported
feeling extreme dizziness. Thus the subjects reportedly
alternated extreme dizziness, with a diminution of dizziness
and the reception of instructions and the production of
estimates may have occurred in either or both of these phas
es.
Another criticism of this procedure might have
been that there was little objective checking of the
objective state of the subjects other than for the visual
observation of nystagmic signs. The visual inspection of
the subjects’ eyes was at best only a check on vertigo
which was present at the conclusion of rotation and could
only have registered the existence of a rebound vertigo.
There was then no objective way of insuring that vertigo
was occuring; of checking its constancy; or of checkibg
its intensity. Perhaps vertigo must be much more intense
with regard to the endolymph circulation and that subject
ive report by subjects on whether they felt dizzy measured
only one symptom of vertigo which was more easily aroused
It is worthy of note when this last point is
taken into account to consider the use of anti- motion
sickness drugs in this type of experimentation. Since
subjects became ill most probably due to the rotational
procedure, which was necessary for the production and
malntainance of vertigo, it would seem worthwhile to admin
ister drugs which would minimize incidence of illness. In
addition, the use of such drugs might make the use of higher
rotation rates practical and significant rotational effects
might appear. Care must be taken however to Insure that such
drugs depress illness only and that they did not depress
vertigo itself.
Once ver-y relevent criticism of this procedure
was the use of a single group of subjects rather than
several groups on the various methods and conditions. Even
though the experimenter is convinced of the wisdom of using
repeated measures on very small samples, it is possible that
practice effects could have cancelled out rotational effects
in this study. Similarly, the application of both the
reproduction and production procedures might have caused
some diminution of the vertigo effects. However, the
balancing of the design by presenting half the subjects with
the production methods first and the other half of the
necessary from analysis of group ordering differences
carried out as a supplementary check.
It is very possible that the results of this
study were due to anxiety effects. The finding that the
estimates were all negative in direction rather than posit
ive for the smaller intervals and negative for the longer
intervals (a generally accepted phenomenon) suggests that
an anxiety interference hypothesis is most reasona-ble.
This is almost inevitable since subjects were required to
take a medical examination and sign a 'release* form. Such
necessary procedures probably evoked some anxiety in the
subjects which could have had a general overall depressing
effect on subject estimates under all condidltions. Future
study might attempt to evaluate anxiety levels of subjects
previous to, during and following the induction of vertigo.
Finally, the effects of vertigo on time estimation
might have been too small to be picked up on the recording
instru-ments available to the experimenter. Increased
sophistication of instrumentation with motorization of a
larger rotating chair, telemetry to pick up physiological
correlates of vertigo, and more sophisticated recording
apparatus capable of measuring finer intervals would be
More research is - obviously needed on these
variables. However, in the light of the above criticisms, it
must still be concluded that the results clearly show no
effect of vertigo on the estimation of time intervals as
specified in this experiment.
With reference to the differences in the methods
of production and reproduction the data seems to have more
positive implications. The results show that the two methods
do differ with respect to the total error of estimation.
The total error of the method of production as measured by
total deviation scores was greater at all times than that
of the method of reproduction.
The method of reproduction did not however appear
to be different from the method of production with reference
to average duration of estimates, or with reference to
average deviation of estimates. Considering accuracy, the
method of reproduction would seem to be somewhat more
accurate than the method of production, but it must be
emphasized that the differences in average accuracy were
not found to be statistically supported.
The results showed that estimates under all
stimulus Interval estimated. However, all estimates (average
estimates) were found to fall short of the stimulus interval
values in terms of objective time. Average error then was
negative in direction with respect to comparison with the
stimulus interval value. This finding is surprising since
it is generally accepted that short intervals tend to be
overestimated (estimates are larger than the standard) and
longer intervals tend to be underestimated (estimates are
smaller than the standard).
Analysis of trend data and graphic analysis showed
that the increases which occurred in estimates on the
increasing standard intervals increased in a linear form.
That is, the estimates increased in a form which could
be described as regular. Estimates appeared to increase as
a direct proportion to the stimulus magnitude. Total error
also demonstrated linearity of function.
Further tests which called for the graphln of
the estimates on log.-log. graph paper demonstrated that
the estimates varied as the result of a power function.
The finding that all estimate plots on the log.-log. paper%
described a linear best fit line was taken as an indic
ation that increases in psychological time were in prop
duration (psychological time) tended to increase in a
fractional manner in direct proportion to a ratio value
of the stimulus duration. Thus even though subjective time
seems to be linear in form with regard to increasing
estimates, it is not parallel to the values of objective
SUMMARY AND CONCLUSIONS
This study was undertaken to investigate the
effects of vestibular vertigo produced by the rotating-
chair method upon the estimation of time intervals by the
methods of production and reproduction.
The results suggest that there is no effect of
vestibular vertigo upon time estimation. Some suggestions
were made to account for possible nullifying factors which
might have cancelled out the effect of vertigo upon time
estimation. Several suggestions were made which might aid
in redesigning procedures in future studies on this topic.
These suggestions included: the possible use of anti
motion sickness drugs in rotational studies; the use of
larger samples and the avoidance of possible learning
and practice effects; monitoring of anxiety effects; the
development of more sophisticated rotational and telemetric
equipment.
Some support was found for the assumption that
found that the total error of the method of production as
measured by total deviation scores was greater and statist
ically different from the total error of the method of
reproduction. Thus it was concluded that the method of
reproduction was less variant in error than the production
method.
With regard to accuracy and average deviation of
error in the scores of the two methods it was found that
although there was better accuracy with estimates made under
the method of reproduction, the method of production was
not statistically different from the other method in accur
acy and average deviation. All estimates made under these
two conditions when averaged, overestimated the stimulus
intervals. That is, the estimates were smaller than the
stimulus intervals. The stimulus intervals estimated were
2", 5", 7”, and 10".
The results of graphic analysis tended to indic
ate that the increases in subjective time (the estimates)
were linear in form when plotted. This linear relationship
between increases was shown to be linear only by the use of
Sample Medical Check List - for use in the examination of subjects taking part in the experimental programme.
1. Relevent previous serious illnesses and operations.
2. History of tinnitus , loss of hearing ____, spontaneous vertigo or dizziness . chronic ear infections , perforated ear drums ___ , Manier’s disease , Mastoid problems .
3. History of relevent alergles; nasal and sinus trouble.
k.
History of nervous diseases epilepsy ,periods of unconsciousness ___ , chronic headaches , brain injury . weakness of the arms or legs t loss of sensation ____ , mental illness __ .5. History of double vision excessive tearing _____ , eye infections ____ .
6. Recent weight gain or loss __ , current state of appetite.
?. Presently on medication? Are intoxicants used regularly?
8. Physical examination of (1) ENT
(2) Heart and Blood Pressure (3) Nervous system.
Comments: ( Use reverse side if necessary )
Physician* s Signature
I ______ hereby agree to take part in an experimental procedure which will involve my being
rotated in a rotary chair device, I have been examined by a physician and have been informed of possible adverse effects which may occur due to the rotation.which I will experience. I hereby agree to release (1) the experimenter,
(2), the officials of the Department of Psychology of the University of Windsor, (3) and the administration and corporate body of the University of Windsor, from
responsibility for any adverse effects which may occur during or following experimentation.
Witness _____ Signed
Instructions for the Method of Production under the Condition of Rotation (Delete bracketed parts for non-rotation condition).
In this part of the experiment, your task is to make tones of a certain length of time. You do this by pressing down the key under your right hand which produces a tone in you earphones.
I will tell you (while you are turning and while you are feeling dizzy) what length of tone you are to make. For
example, (when you feel dizzy) you will hear me say - now make a tone X number of seconds long. I will repeat that instruction and after you have heard it twice press your key down for X number of seconds.
After you finish making that tone I will tell you what length of tone you are to make next. You may begin to make you tone any time after you have heard the instructions twice.
Do. not attempt to measure the length of your tone by counting or by any other means. Just concentrate on listen ing to the tone you are making , until you feel it is the correct number of seconds long.
Do you have any questions as to what your task is?
(I will start turning you now. When you feel dizzy press down your key three times as a signal that we can start the experiment. This is most important since you must be feeling dizzy during this part of the experiment).
Instructions for the Method of Reproduction under the Condition of Rotation (Delete bracketed parts
for non-rotation condition).
Your task is to listen to that tone and when it ends make a tone, by pressing down your tone key , that is equal in length to the tone you heard. You may begin making your tone any time after the tone I have made ends.
Do not attempt to measure the length of my tone or your tone by counting or by any other means. Just concent rate on listening to my tone and listening to your tone until you feel that your tone is the correct length of
time long.
(During this part of the experiment you will be turned around in the chair. The tones you will hear me make and the tones you will make will occur while you are spinning around and while you are feeling dizzy).
Computational Formulae for the Three Way Factorial Experiment - All Three Factors Repeated Measures
( 1 )
npqr 2 (2) OC
(3) < (A1) 2 nqr
(*0 *(B,1)2 npr
(5) *(Ck)2 npq
(6)
i
(ABi .1) nr(?) C'(ACik)2 nq
(8) <(BC,jk)2 np
(9)
n
(1 0 ) ^ ( P m )c
pqr
SSA = (3) SSB = (4)
ssc = (5)
(l) (l)
(
1
)SSAB = (6) + (1) - (3) -
(k)
SSAC = (7) + (l) - (3) - (5)
SSBC = (8) + (1) - (4) - (5)
SSABC = (9) + (3) + M + (5)
-(1) - (6) - (7) - (8)
SSBetween = (1 0) - (1)
SSWithin = (2) - (10) SSTotal = (2) - (1) SSResidual = SSWithin -
Alexander, S.J.; Cotzin, M.; Hill, C.J.Jr. ; Riccuiti, E.A.; Wendt, G.R. Wesleyan University studies of moition sickness I, the effects of variation in time intervals between
accelerations upon sickness rates. J. of Psychol., 1945, (a) 1£, 49-62.
Alexander, S.J.; Cotzin, M.; Hill, C.J.Jr.; Riccuiti, E, A.; Wendt, G.R. Wesleyan University studies in motion sickness; II, a second approach to the problem of the effects of var iation of time intervals between accelerations upon
sickness rates. J. of Psychol. 1945, (b), 1£, 63-68.
Bindra, D., Waksberg, H. Methods and terminology in studies of time estimation. Psychol. Bull. , (2) 1956.
Carlson, A.J.; Johnson, V.; Cavert, H.M. (Eds.) The Machinery of the Body. (5th. ed.) Chicago: University of
Chicago Press', 1961, Pp. 561-564.
Collins, E. Manipulation of arousal and its effects on human vestibular nystagmus induced by caloric irrigation and angular accelerations. F.A.A.Civil Aeromed. Res. Inst. Rep.. 1962, No. 62-17. 12p.
Collins, E. Adaption to vestibular disorientation; I ,
Vertigo and. nystagmus following repeated caloric irrigation, F.A.A. Civil Aeromed. Res. Inst. Rep. 1964, No. 65-18, 15p.
Clausen, J. An evaluation of experimental methods of time judgements. J. exp. Psychol.. 1950» 40. 756-671.
Danziger, D., DuPreez, P.D. Reliability of time estimation by the method of reproduction . Percept, mot. Skills, 1963,
(17), 45-46.
DuPreez, P.D. Relation between verbal estimation and
reproduction of short time intervals. Percept, mot. Skills. 1963, (16), 879-884.
Forssman, b.; Henriksson, N.G.; Dolowitz, D.A. Studies on habituation of vestibular reflexes: VI, Habituation in
darkness of calorically induced nystagmus, laterotorsion, and vertigo in man. Acta Otolaryngol!ca, 1963, 56, 663-674.
Frankenhauser, M. Subjective time as affected by
gravitational stress. Scand. J. Psychol., i960, 1, 1-6.
Guedry, F.E.Jr. Visual control of habituation to complex vestibular stimulation in man. Acta Otolaryngollca, 1964,
5tV (I), 377-389.
Guedry, F.E.Jr. Habituation to complex vestibular
stimulation in man; Transfer and retention effects from 12 days of rotation at 10 r.p.m. U.S.N. S.A.M. N.A.S.A. jt. Res. Rep.,1965, No. 109, Proj. MR005.13-6001, Subtask 1, N.A.S.A. Order No. R-93, 29p.
Harris, C.S.; Ambler, R.K.; Guedry, F.E.Jr., A brief
vestibular disorientation test. U.S.N. Sch. Aviat. Med. N.A. S.A. jt. Res. Rep. I963,Proj. MB005.13-6001, Subtask I, R©p. No. 82, N.A.S.A. Order R-47.
Langley, . L. ; Cheraskln, E.; Sleeper, R. Dynamic Anatomy and Physiology. Toronto: Hill Book Co. Inc., 195$, Pp. 561-564.
Lindvall, H.F. Vertigo and nystagmus responses to caloric stimuli repeated at long and short intervals, Acta
Otolaryngol!ca , Stockholm , I96I, 53. (6), 507-518.
Mallick, A.K. A scale for measurement of subjective duration. J.psychol. Res., Madras. 1962, 6, (1), 1-3.
Nelson, T.M. ; Bartley, S.H.; Jordon, J.F. Experimental evidence for the involvement of a neurophysiological
mechanism in the discrimination of duration. J. of Psychol.,
1963, 55, 371-385.
Ochberg, F.M.; Pollack, I.W.; Meyer, E. Reproduction and estimation methods of time judgements. Percept, mot. Skills,
1965,
20,653-656.
Richards, W. Time estimates measured by reproduction. Percept. mot. Skills. 1964, 18, Q ) , 929-943.
Siegman, A.W. Anxiety, impulse control, intelligence and the estimation of time. J. of clin. Psych., 1962, 18, (1),
19^1
1955-61
1961
1962-66
Born August l6th. in London, Ontario, Canada.
Parents Gerald Gordon and Bettina Eleanor
Getty.
Received two years high school education at
London Central Collegiate Institute, London,
Ontario, Canada. Received Senior Matriculation
at Hon. J. C. Patterson Collegiate Institute,
Windsor, Ontario, Canada.
Attended George Williams College, Chicago,
Illinois for the Group Work Education
Programme.
Graduated with an Honours B.A., University
of Windsor, Windsor, Ontario, Canada.
Registered as a full-time graduate student
at the University of Windsor.