DEVELOPMENT OF EVALUATION METHOD FOR SEISMIC
ISOLATION SYSTEMS OF NUCLEAR POWER FACILITIES
- EXPERIMENTAL STUDY ON STRUCTURAL CHARACTERISTICS OF
BASE
ISOLATED FOUNDATION COUPLED WITH SEISMIC ISOLATOR -
Hideyoshi Watanabe1, Hiroyuki Narihara2, Yuji Aikawa3, Masakazu Jimbo4, Kunihiko Sato5, Shinji Kosugi6, and Yasuo Ookouchi7
1
Chief Research Engineer, Building System and Material Research Section, Building Engineering Research Institute, Technology Center, Taisei Corporation, Japan
2
Executive Chief Research Engineer, Building System and Material Research Section, Building Engineering Research Institute, Technology Center, Taisei Corporation, Japan
3
Manager, Nuclear Facilities Engineering II, Nuclear Facilities Division, Taisei Corporation, Japan
4
Chief Specialist, Plant Design & Engineering Dept., Isogo Nuclear Engineering Center, Toshiba Corporation, Japan
5
Deputy Chief Engineer, Nuclear Plant Designing Department, Nuclear Energy Systems Division, Energy & Environment, Mitsubishi Heavy Industries, Ltd., Japan
6
Researcher, Aseismic Engineering Sec., Nuclear Plant Engineering Dept., Hitachi-GE Nuclear Energy, Ltd., Japan
7
Assistant Manager, Nuclear Power Plant Architectural Engineering Sect., Civil & Architectural Engineering Dept., Chubu Electric Power Co., Inc., Japan
ABSTRACT
In this study, static loading tests were conducted in order to investigate ultimate seismic performance of reinforced concrete foundation (pedestal) for seismic isolated nuclear power plant. Half-scale four test specimens, which consist of Lead Rubber Bearings(LRBs) of 800mm in diameter and reinforced concrete pedestals of 1200mm1200mm in horizontal view, were used with the parameters of cyclic pattern of axial stress of seismic isolator, existence or non-existence of reinforcing bars at the top of pedestal, and concrete compressive strength. As a result of the study, it was confirmed that the reinforced concrete pedestal shows structural integrity within design level loads. In ultimate level loads, no damage was observed in the case of non-variable axial stress in the area near the center of buildings, and no brittle failure was observed and supporting function of axial loads was retained in the area near the outer edge of buildings, where variable axial stress in ultimate level was extremely large.
INTRODUCTION
EXPERIMENTAL PROGRAM
Test Specimens
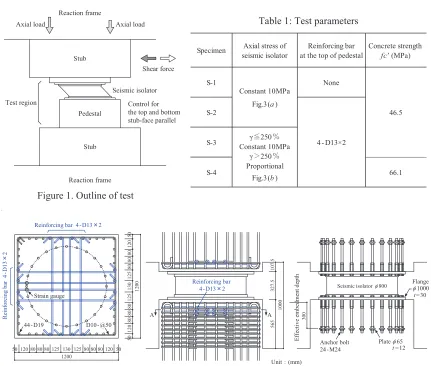
Outline view of test is shown in Figure 1. Four test specimens, which are half-scale models of base isolated foundations coupled with seismic isolators in nuclear power plant, were used with the stubs at upper and lower part of the specimens. All the seismic isolators used as specimens have the same specification, which are half-scale models of the 1600mm diameter LRB shown in reference by S. Matsuoka et al. (2013). List of test specimens is shown in Table 1, and shape of test specimen S-2㹼S-4 are shown in Figure 2. Thickness of flange of LRB is 30mm, and number of attaching bolts(M24) is 24. Reinforced concrete pedestal, the size of which is 1200mm1200mm in horizontal view, is a half-scale model of design example in JEAG4614-2013. Longitudinal steel is a deformed bar(D19) with the measured yield strength of 384MPa. Transverse steel with the measured yield strength of 392MPa is a deformed bar (D10) arranged at 50mm spacing.
Table 1: Test parameters
Figure 1. Outline of test
Figure 2. Detail of test specimens
Stub
Reaction frame
Seismic isolator
Control for the top and bottom stub-face parallel Stub Reaction frame Shear force Test region Axial load Pedestal Axial load S-1 None S-2 S-3 S-4 66.1
Specimen Axial stress of
seismic isolator
Reinforcing bar at the top of pedestal
Concrete strength
fc'(MPa)
Constant 10MPa
/ / /
Fig.3(a)
46.5
4-D13×2
!䍺250䠂
Constant 10MPa
!䠚250䠂
Proportional
/ / /
Fig.3(b)
5 6 5 3 2 7 .5 1 0 7 .5 1 0 0 0 A A Flange !"1000 t = 30
Seismic isolator !"800
3
0
0
Plate !"65 Anchor bolt
24 - M24 t = 12
E ff ec ti v e em b ed m en t d ep th
Reinforcing bar 4-D132
R ei n fo rc in g b ar 4 -D 1 3 2 5 0 1 2 0 8 0 1 2 5 1 3 0 1 2 5 8 0 1 2 0 5 0 1 2 0 0 8 0 8 0 8 0 8 0
50 120 80 125 130 125 80 120 50 1200 80 80 80 80 A-A Section Strain gauge
Unit㸸(mm) Reinforcing bar
4-D132
Test Parameters
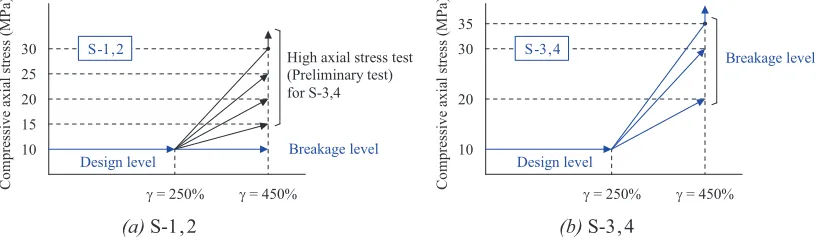
Test parameters are axial stress of seismic isolator, existence or non-existence of reinforcing bar at the top of pedestal indicated by blue line shown in Figure 2, and concrete compressive strength. Specimen S-2 is the standard type designed for pedestal in the area near the center of building. Test of S-2 was conducted under the fixed axial stress of 10MPa in order to confirm the characteristics of specimen from design level to breakage level deformation of seismic isolator. Specimen S-1 is a specimen of which the reinforcing bars at the top of pedestal are omitted from specimen S-2. Specimen S-1 is intended to confirm the effect of the above horizontal reinforcing bar, the concept of which for avoiding concrete breakout for shear at the side of the pedestal is shown in JEAG4614-2013.
Specimen S-3 is intended to confirm the characteristics of specimen in the area near the edge of the buildings, the axial stress of which is fixed 10MPa up to the design level shear strain 250%, and varied in proportion to shear strain from design level 250% up to breakage level 450% as shown in Figure 3. S-4 is a specimen using the concrete compressive strength 60MPa. In the case of shear strain near breakage limit, effective cross sectional area of upper end and lower end of elastomeric isolator decreases extremely down to approximately one sixth of loaded area at shear strain 0%. Figure 5 shows an example of analysed contact pressure by FEM at the bottom of lower flange surface. As shown in Figure 4 and Figure 5, it is concerned that concrete may have bearing failure due to the large bearing stress at the upper surface of pedestal under the condition acting high axial stress at breakage level shear strain. Specimen S-4 is intended to confirm the supporting function of pedestal under the condition acting high axial stress at breakage level shear strain by using the concrete compressive strength 60MPa, expecting the effect of high-strength concrete with increased bearing strength.
10
#"= 250%
Breakage level Design level
(Preliminary test) for S-3,4
S-1,2
C
o
m
p
re
ss
iv
e
ax
ia
l
st
re
ss
(
M
P
a)
High axial stress test
15 20 25 30
10 20 30 35
S-3,4
Breakage level
Design level
C
o
m
p
re
ss
iv
e
ax
ia
l
st
re
ss
(
M
P
a)
#"= 450% #"= 250% #"= 450%
Figure 3. Compressive axial stress of test specimens
Figure 4. Overlap area of rubber section Figure 5. Contact pressure (FEM analysis)
100
0 MPa
Axial stress = 30MPa㻌! = 450䠂
Maximum stress 190.2MPa (a) S-1,2 (b) S-3,4
ț
#$450%
Actual seismic isolator
%=1170mm
Overlap area of
Test Setup and Measurements
Test setup is shown in Figure 6. Loading was conducted keeping horizontally parallel between the upper and lower stabs. Axial stress of seismic isolator was given by two 10MN jacks, and loading of horizontal force was given by two 3MN jacks under displacement control. In the region of design level shear strain, gradually increasing sets of cycles of s100%, s175%, s250% were applied, repeating twice at each shear strain level.
After finishing the design level loading and adjusting the loading test machine by relieving the horizontal and vertical load, breakage level test was conducted. In the breakage level test, one way cyclic loading of 300%, 350%, 400%, once at each shear strain level was applied under the target axial stress of 25MPa at 450%, and monotonous loading was applied over the target axial stress of 30MPa at 450%. Measurement items were axial force and horizontal force acting on specimen, horizontal displacement, strains of reinforcing bars at each position, and concrete compressive strains at directly under lower flange of seismic isolator by mold strain gauges.
TEST RESULTS
General Behavior and Crack Pattern
As an example, photographs during test of Specimen S-1 at 250% and 450% shear strain are shown in Figure 7, crack patterns on left side of pedestals, the lower part of which subjected to compressive stress
Figure 6. Test setup
Figure 7. Photograph of test region during test
(a) Design level (b) Breakage level
Specimen 10
M
N
A
ct
u
at
o
r
A
x
ia
l
lo
ad
3MN Actuator 㽢2
Sher force
䠇 䠉
A
x
ia
l
lo
ad
1
0
M
N
A
ct
u
at
o
r
Reaction frame
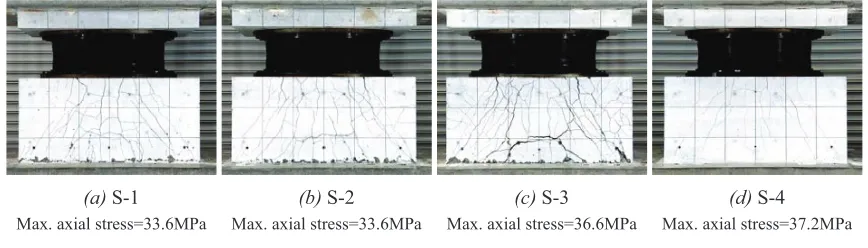
at breakage level loading, are shown in Figure 8. Any test specimen retained structural integrity up to design level loading. Test specimen S-1 and S-2 had no crack like damage in breakage level loading. However, cracks occurred on the left side of lower part of pedestal during loading forward to target axial stress 20MPa in the additionally done high axial stress test after finishing the originally planned tests. Test specimen S-3 and S-4 had also slight cracks in breakage level on the left side of lower part of pedestal during loading forward to target axial stress 20MPa, and it was observed that number of cracks increased and compressive failure of concrete at the bottom of pedestal occurred by the further loading. Final crack patterns on left side of specimens after finishing tests are shown in Figure 9. Most remarkable damage occurred in test specimen S-3 which suffered large axial stress from the early stage of breakage level loading. It is understood that high strength concrete has the effectiveness to reduce the damage of specimen, considering the fairly less damage of specimen S-4(fc’=66.1MPa) versus more damage of S-3 (fc’=46.5MPa). Damage of specimen S-1 and S-2 in high axial stress test is less than that of specimen S-3. The reason is that in specimen S-1 and S-2 shear force carried by seismic isolator decreases extremely in high axial stress mainly due to the effects of cyclic loading, varying the axial stress of seismic isolator.
Load-Displacement Relationship
Test results of specimen S-3 are shown in Figure 10, and results of specimen S-1, S-2 and S-4 in breakage level are shown in Figure 11. Red broken lines in each figure as to shear force-displacement relationship indicate skeleton curve for seismic response study in JEAG4614-2013. Also in Figure 10 and Figure 11, peak points at 450% shear strain in target axial stress 20MPa are indicated as mark”ࠐ” and 30MPa as mark“ە”. Shear force-displacement relationships in the results of all the test specimens correspond to skeleton curves for design, therefore it was confirmed that stress condition of pedestal supposed in the planning stage of tests was reappeared by the conducted tests.
According to the test results of specimen S-1 and S-2 in breakage level, it was confirmed that effects of
Figure 9. Final crack patterns (left side of specimens)
(a) S-1
Max. axial stress=33.6MPa Max. axial stress=33.6MPa Max. axial stress=36.6MPa Max. axial stress=37.2MPa (b) S-2 (c) S-3 (d) S-4 Figure 8. Crack patterns at axial stress=20MPa (left side of specimens)
reinforcing bars at the top of pedestal have little effects on shear force-displacement relationships. In Figure 8 and Figure 9, there are some amount of difference in failure of pedestal between specimen S-3 and S-4, however no significant difference in shear force-displacement relationships was observed up to the target axial stress 30MPa. In specimen S-3, decrease of shear force was observed at final stage in the target axial stress 35MPa, however supporting function was retained and it was confirmed that the design example in JEAG4614-2013 has the satisfaction with the target performance in structural integrity. In the high axial stress tests of specimen S-1 and S-2, shear force carried by seismic isolator decreases. One of the important reasons is thought to be a method of cyclic loading with increasingly varied axial stress. By the comparison between the shear forces at breakage level 450% and 30MPa, shear force of
-1000 -500 0 500 1000
-400 -200 0 200 400
Displacement (mm) Design level
Shear force (kN)
Design model of LRB
0 500 1000 1500 2000 2500
0 200 400 600
Breakage level Shear force (kN)
Displacement (mm) = 30MPa Axial stress = 20MPa Axial stress
Design model of LRB
-50 -40 -30 -20 -10 0
0 5 10 15 20 25 30 35
Axial stress (MPa)
Axial displacement (mm) =20MPa Axial stress =30MPa Axial stress 0 500 1000 1500 2000 2500
0 200 400 600
Displacement (mm) Design model of LRB
= 30MPa Axial stress Shear force (kN)
= 20MPa Axial stress S-1 0 500 1000 1500 2000 2500
0 200 400 600
= 30MPa Axial stress Shear force (kN)
= 20MPa Axial stress S-2
Displacement (mm) Design model of LRB
0 500 1000 1500 2000 2500
0 200 400 600
Shear force (kN)
= 30MPa Axial stress = 20MPa Axial stress
Design model of LRB
Displacement (mm) S-4
Figure 11. Test results (breakage level) for specimens S-1, S-2 and S-4
(b) S-2
(a) S-1
Figure 10. Test results for specimens S-3
(a) Design level
(b) Breakage level
specimen S-1 or S-2 was 50㹼70% of that of specimen S-3 or S-4, therefore effects of numbers of cyclic loadings are thought to be major reasons. Furthermore, it was confirmed that reinforcing bars at the top of pedestal have the effects of preventing expansion of pedestal in horizontal direction when the large compressive bearing stress is acted on pedestal, by the experimental results that the decrease of shear force carried by seismic isolator in specimen S-2 was a little bit smaller than that in specimen S-1.
Concrete Compressive Strains
Measured strain distributions of concrete in vicinity of flange are shown in Figure 12(a), (b) and (c), which are the results by mold gauges set in the location shown in Figure 12(d). Measured concrete compressive strain was in the range of approximately from 400"& to 650"& in design level. In breakage level, measured concrete compressive strain shows increasing tendency compared with design level due to the decrease of effective cross sectional area of upper end and lower end of elastomeric isolator. As in the tendency of analysed contact pressure in Figure 5, measured concrete compressive strain is remarkably large at the location C317 and C321 in Figure 12(d), the reason is that the lead plug exists in the center of the seismic isolator(LRB). In all specimens, measured concrete compressive strain kept under approximately 3500&"even at the location C317 and C321 up to the target axial stress 20MPa. However, measured concrete compressive strain in specimen S-1, S-2 and S-3 significantly exceeds 10000"& in the subsequent loading of target axial stress 30MPa. It is possible to assume that bearing failure occurred in pedestal concrete under the high level strain over 10000"&. In specimen S-4, the
-10000 -8000 -6000 -4000 -2000 0
-400 -200 0 200 400
Gauge location (mm)
Design level (!=250%)
20MPa 30MPa
20MPa (C321)
30MPa (C321) -2657"
-14084"
Concrete strain (")
S-2
-10000 -8000 -6000 -4000 -2000 0
-400 -200 0 200 400
-3485"
-20836"
Gauge location (mm)
Design level (!=250%)
20MPa 30MPa
20MPa (C317)
30MPa (C317)
Concrete strain (")
S-3
-10000 -8000 -6000 -4000 -2000 0
-400 -200 0 200 400
-2364"
-3442"
Gauge location (mm)
Design level (!=250%)
20MPa
30MPa 20MPa (C321)
30MPa (C317)
Concrete strain (")
S-4
Figure 12. Strain distributions of concrete in vicinity of flange
(c) S-4
(a) S-2 (b) S-3
(d) Location of mold strain gauges
200
100
400
400 30㼻 Rubber
Flange C317
C321
concrete strength of which is higher than that of S-3, measured concrete compressive strain in the target axial stress 30MPa was 3442"& in maximum, and no rapid increase of strain was observed in the subsequent loading. From these results, it is confirmed that the use of high-strength concrete is effective to prevent bearing failure of pedestal concrete.
Effect of Reinforcing Bars at the Top of Pedestal
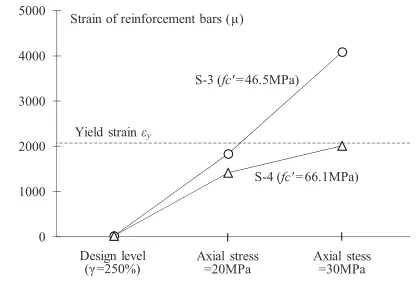
Comparison of strain of reinforcing bars at the top of pedestal for specimen S-3 and S-4 is shown in Figure 14. Measured values shown in this figure are the average of 4 positions, namely upper 2 bars and lower 2 bars at the position indicated as mark ”ە” shown in Figure 2. Strain of reinforcing bar was almost 0 during the design level loading, however the strain began to increase in the breakage level loading. In specimen S-3, strain reached yield level during the loading in the target axial stress 30MPa. Point at which the strain of bars in specimen S-3 at the top of pedestal exceeded the yield strain is indicated as mark “ۍ” in Figure 10. Stiffness in Q-ț relation of seismic isolator began to decrease at the above timing, the reason is thought to be that the effect to prevent expansion of pedestal concrete decreased due to the yielding of reinforcing bars at the top of pedestal. In specimen S-4, the concrete strength of which is higher than that of specimen S-3, the strain of reinforcing bars at the top of pedestal was smaller than that of S-3 and remained in elastic range even in the loading of target axial stress 30MPa.
Damage Observed on the Top of Pedestal
After finishing the loading tests, observation of state or condition of test specimens was conducted by removing the seismic isolator from the pedestal. Conditions of top and side surface of pedestal in the most severely damaged specimen S-3 are shown in Figure 15(a) and (b). It is supposed that the top of pedestal suffered nearly the same analysed contact pressure shown in Figure 5, judging from the fact that the white paint for recording the concrete cracks was peeled off and it strongly adhered to the flange surface of seismic isolator. No other damage but the above peel-off was observed on the top and side surface of upper pedestal, however significantly large number of cracks on top and side surface and sinking on top surface of lower pedestal were observed as shown in Figure 15(c). As for lateral expansion, the affected range in depth direction from top of pedestal approximately corresponds to the embedded length of anchor bolts as shown in Figure 15(d), the reason of which is thought to be that the confined concrete under flange surrounded by the anchor bolts was swelled out due to the high axial stress. In specimen S-3, deformation of lower flange of seismic isolator which corresponds to the above mentioned sinking was measured as shown in Figure 16. In specimen S-3, approximately maximum 10mm sinking was measured
Figure 13. Shear force–strain of reinforcing bars at the top of pedestal relationship
Figure 14. Comparison of strain of reinforceing bars for S-3 and S-4
0 500 1000 1500 2000 2500
㻜 㻝㻜㻜㻜 㻞㻜㻜㻜 㻟㻜㻜㻜 㻠㻜㻜㻜
Yield strain !y
Strain (")
Shear force (kN)
Design level (! =250%)
20MPa 30MPa
S-3
0 1000 2000 3000 4000 5000
Design level
(!=250%)
Axial stress =20MPa
Axial stess =30MPa
Strain of reinforcement bars (")
S-4 (fc'= 66.1MPa)
Yield strain !y
on top surface of pedestal, and approximately maximum 5㹼6mm plastic deformation was observed in the lower flange of seismic isolator, due to the extremely high axial stress of 36.6MPa in final loading.
CONCLUSION
Static loading tests for half-scale four specimens were conducted in order to investigate ultimate seismic performance of reinforced concrete pedestal supporting seismic isolator(LRB). The results obtained in this study are summarized as follows.
Figure 15. Damage observed on the top and side surface of pedestal (S-3)
Figure 16. Measurement of sinking on the top surface of pedestal (S-3)
(a) Side surface
(c) Sinking on the top surface (d) Lateral expansion of pedestal
(b) Top surface
Maximum
10.2mm
> 8mm
68mm
46mm
24mm
< 2mm
Rubber
(1) Reinforced concrete pedestal showed structural integrity within design level loads. In ultimate level loads, no damage was observed in the case of non-variable axial stress in the area near the center of buildings. In the area near the outer edge of buildings, where variable axial stress in ultimate level was extremely large, concrete cracks were observed in axial stress 20MPa, however no brittle failure was observed and supporting function of axial loads was retained even in the subsequent loading with the increase of axial stress.
(2) Bearing failure was observed in pedestal concrete in the case that seismic isolator suffered more than 30MPa axial stress. High-strength concrete is effective to prevent bearing failure and decrease of damage in ultimate state in pedestal concrete.
Further investigations on test results and evaluations on design methods as to connection of seismic isolator will be conducted and applied to updating the JEAG4614-2013.
ACKNOWLEDGEMENTS
This technology development has been carried out as Japan national project “Development for Evaluation Methods of Seismic Isolation Systems” with the participation of Chubu Electric Power, Japan Atomic Power,Hokkaido Electric Power,Tohoku Electric Power,Tokyo Electric Power,Hokuriku Electric Power, Kansai Electric Power,Chugoku Electric Power,Shikoku Electric Power,Kyushu Electric Power,J Power, Toshiba, Hitachi-GE Nuclear Energy, Mitsubishi Heavy Industries, and the Institute of Applied Energy. We thank Dr. Nishikawa, a Professor Emeritus at Tokyo Metropolitan University, Dr. Kubo, a Professor Emeritus at the University of Tokyo, Dr. Fujita, a Professor Emeritus at the University of Tokyo, Dr. Kasahara, a Professor at the University of Tokyo, and Dr. Yabana, the Central Research Institute of Electric Power Industry for their advice.
REFERENCES
S.Matsuoka et al. (2013). “Development of an Evaluation Method for Seismic Isolation Systems (Part 1) Design of Seismic Isolation Systems for Nuclear Power Plant,” Proc., 13th World Conference on Seismic Isolation Energy Dissipation and Active Vibration Control of Structures -commemorating JSSI 20th Anniversary-, JSSI, Sendai, Japan, Paper882559.