Effect of Distance measures on Partitional
Clustering Algorithms using Transportation Data
Sesham Anand#1, P Padmanabham*2, A Govardhan#3#1
Dept of CSE,M.V.S.R Engg College, Hyderabad, India
*2
Director, Bharath Group of Institutions, BIET, Hyderabad, India
#3
Dept of CSE, SIT, JNTU Hyderabad, India
Abstract— Similarity/dissimilarity measures in clustering
algorithms play an important role in grouping data and finding out how well the data differ with each other. The importance of clustering algorithms in transportation data has been illustrated in previous research. This paper compares the effect of different distance/similarity measures on a partitional clustering algorithm kmedoid(PAM) using transportation dataset. A recently developed data mining open source software ELKI has been used and results illustrated.
Keywords
— clustering, transportation Data, partitional
algorithms, cluster validity, distance measuresI. INTRODUCTION
Clustering as an unsupervised data mining technique and has been widely used in various applications for analyzing data. Kmeans and kmedoid algorithms are two very widely used partitional algorithms. Since kmeans is more suitable using Euclidean distance metric, in order to study other distance measures, kmedoids algorithm has been chosen for the study. Details of transportation data, its attributes, aim of research, details of application of clustering etc has been presented previously[2,3,4,5].Also, one other aim of the research was to compare different open source software[4]. Previous research illustrated the importance and use of clustering on transportation data and results of applying clustering was indicated. It has been observed that the clustering results varied with different algorithms and using different parameters.
The need of current research is to study the effect of distance metrics on the clustering algorithms and to come out with recommendations on suitable distance measures to be used and whether suitable modification is to be made for a particular distance measure specifically for the transportation dataset. The work has been done using ELKI[1] software. It is a recently developed java based data mining software. Different distances have been selected using kmedoids algorithm and different parameters have been recorded. Suitable conclusions have been made. All the different cluster evaluation measures and distances used in the work are discussed.e.
II ELKI SOFTWARE
The software used for the present research is ELKI[1], which stands for Environment for Developing KDD-Applications Supported by Index-Structures. It is a Java based open source software. The current version used is ELKI 0.6.0.The original aim of ELKI is to be used in
research of algorithms, with an emphasis on unsupervised methods in cluster analysis and outlier detection[1]. High performance is achieved by using many data index structures such as the R*-trees.ELKI is designed to be easy to extend for researchers in data mining particularly in clustering domain. ELKI provides a large collection of highly parameterizable algorithms, in order to allow easy and fair evaluation and benchmarking of algorithms[1].
Data mining research usually leads to many algorithms for similar kind of tasks. If a comparison is to be made between these algorithms.In ELKI, data mining algorithms and data management tasks are separated and allow for an independent evaluation. This aspect is unique to ELKI among other data mining frameworks like Weka or Rapidminer, Tanagra etc. ELKI has many implementations of, distances or similarity measure file formats, data types and is open to develop new ones also.
Visualizing data and results is also available and ELKI supports evaluation of different algorithms using different measures like pair-counting, Entropy based, BCubed based, Set-Matching based, Editing-distance based, Gini measures etc.
Although not exhaustive, Table 1 shows the wide variety of clustering algorithms implemented in ELKI. All algorithms are highly efficient, and a wide variety of parameters can be used to customize them.
Table 1: Clustering algorithms in ELKI
Category Algorithms Implemented
Partitional Clustering
kmeans(Llyod and MacQueen), kmedoids(PAM &EM),
kMedians(Llyod),kmeansBisecting, kmeansBatchedLlyod,
kmeansHybridLlyodMacQueen,
Hierarchical
ExtractFlatClusteringFromHierarchy, NaiveAgglomerativeHierarchicalClustering, SLINKierarchicHie
Correlation CASH, COPAC, ERiC, FourC, HiCO, LMCLUS, ORCLUS,
Subspace CLIQUE, DiSH, DOC, HiSC, P3C, PROCLUS, SUBCLU, PreDeCon,
Fig 1:ELKI Home Screen
ELKI home screen provides a lot of parameters for selecting clustering and customizing them. Fig 1 shows initial menu of the software. A lot of clustering algorithms have been implemented in ELKI unlike in other open source software. Easy to use menus allow the researcher to select and customize various parameters as shown in Fig 2.
Fig 2: ELKI algorithm selection
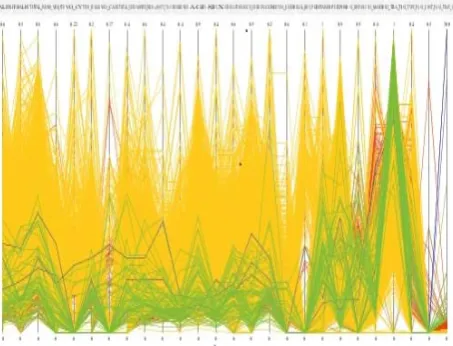
Although not yet mature, ELKI provides to some extent visualization facility to see the results of clustering and data as shown in Fig 3.
Fig 3: Visualization of Data
III DEFINITION AND MOTIVATION FOR CURRENT
RESEARCH
Author’s previous research[2,3,4,5] has showed the original aim of research and application of clustering techniques on transportation data. Ultimately it is proposed to come out with recommendations on suitable algorithms and distance measures suitable to the HIS Transportation dataset. Preprocessing of the dataset and suitable dimensionality reduction[5] techniques were applied on the data, and it is concluded that clustering on factor scores is more suitable than on original data. It now remains to be seen what distance measures are suitable and need to be used.
The objective of clustering the data has been to determine answers to questions such as how rich or prosperous a household is, their mobility levels, vehicle availability etc. The intention is to analyze why people are investing money to acquire money and whether it is related to inadequacy of public transport etc. Also is it possible to predict the potential of households and likely to buy vehicles in future etc.
IV ALGORITHM USED
This paper is intended to study the effect of distance measures and initialization methods in partitional clustering algorithms when applied to transportation dataset. Two of the most widely used partitional clustering algorithms are kmeans[7] and kmedoids[6](also known as partitioning around medoids PAM).
Partitional clustering algorithms construct k clusters or classifies data into k groups which satisfy the partition requirements: Each group must contain at least one object and each object must belong to at least one group.
All these algorithms require the k value as input. Since the dataset under consideration is numeric, these two algorithms are suitable for application on the dataset. kmeans algorithm is more widely used than kmedoids in the research literature but it has some drawbacks. kmeans algorithm[7] is more suitable using Euclidean distance and its derivatives. If any other similarity measures is used, it may not converge to global minima. kmeans is designed naturally for squared Euclidean distance. Precisely for this reason, kmedoids algorithm has been chosen for further work and the intention is to change the distance measures for each run of the algorithm and see the effect.
A Algorithm
Kmedoids algorithm has two phases[6], a build phase and a swap phase. In the first phase, an initial clustering is done by selecting k representative objects. The first object is selected for which the sum of dissimilarities to all other objects is as small as possible. All subsequent steps involve selecting all other remaining k-1 objects. In order to select the objects the following steps are carried out[6]:
1. Select an object i which is not yet selected
2. Select a non-selected object j and calculate the difference between its dissimilarity Dj with the
3. If this difference is positive, object j will contribute to the decision to select object i. therefore Cji = max(Dj – d(j,i),0)
4. Calculate the total gain obtained by selecting object i: ΣCji
5. Choose the not yet selected object I which maximizes ΣCji
6. These steps are carried out until k objects have been found.
The second phase consists of trying to improve the representative objects, thereby improving the overall clustering. It considers all pairs of objects (i,h) in which object ‘i’ has been selected and object ‘h’ has not been selected. If, swap is carried out between ‘I’ and ‘h’, the effect on clustering is determined and any improvement is seen the swap is carried out. More details of the algorithm can be found in [6].
The advantage of using kmedoids algorithm is that it easily adapts itself to different distance measures unlike kmeans algorithm. Different distance measures were changed on the same algorithm and different run results are indicated. ELKI software allows the researcher to change the distance functions and run the same algorithm. This can be extended to all other algorithms implemented in ELKI.
V EVALUATION OF DISTANCE MEASURES USING
K-MEDOIDS ON TRANSPORTATION DATA
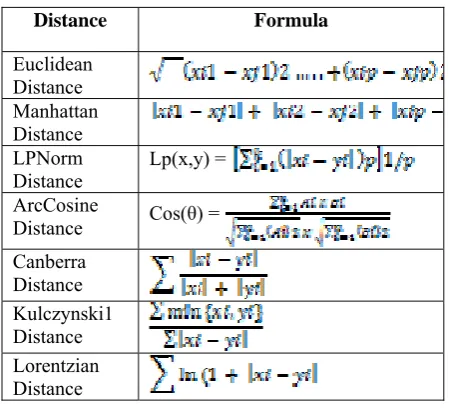
A Review of Distance Metrics for numerical data
Some of the distance functions suitable for numeric data which are used in this paper are presented in Table 2.
Table 2: Distance functions for numeric data
Distance Formula
Euclidean Distance Manhattan Distance LPNorm
Distance Lp(x,y) = ArcCosine
Distance Cos(θ) = Canberra
Distance Kulczynski1 Distance Lorentzian Distance
VI INITIALIZATION METHODS
The initial k representative objects can be selected in many ways. Some of the methods used in the current work are: a) RandomlyChosenInitalMeans: Used by default in kmeans algorithm. k objects are selected from data at random.
b) FirstkInitialMeans: This is the easiest method of selecting k representatives from the data. The first k objects are selected as representatives of k clusters.
c) FarthestPointsInitialMeans: The farthest-point method picks up an arbitrary point p. It now picks a point q that is as far from p as possible. Then select r to maximize the distance to the nearest of all centroids picked so far. That is, maximize the min {dist (r, p), dist (r, q) ...}. After all k representatives are chosen then the partition of Data D is done: a cluster Cj will now consist of all points closer to
representative sj than to any other representative.
d) PAMInitialMeans: This method[6] is based on partitioning around medoids(PAM) algorithm which searches for k representative objects in the dataset called medoids of the clusters. The sum of dissimilarities of objects to their closest representative object is minimized. The first of k objects[6] is selected for which the sum of dissimilarities to all other objects is as less as possible. In subsequent steps, rest of the objects is chosen
VII COMPARISON MEASURES
Clustering algorithms retrieve the inherent partitions in the data.Although all clustering algorithms partition the data, each of them reveal different clusters based on different input parameters. Hence validating the resulting clustering is very important. There are three ways of cluster validation namely internal, external and relative criteria. They are also important because some datasets may not have a proper inherent cluster structure and hence makes the clustering output meaningless. Table shows the criteria used for comparison of clustering on transportation dataset. All the criteria chosen are external validity indices.
Let the dataset be X and the clustering structure be denoted by C when a particular algorithm is applied.Let Pbe a prespecified partition of data set X with Ndata points. The external validity indices used to compare the algorithms are presented in Table 3
Table 3: Cluster validity indices
Validity Index Formula
Jaccard[12]
Rand[12]
FowlkesMallows[11] FM =
F1-Measure[12] F(i,j)=2
Precision[12] Precision(i,j) =
Recall[12] Recall(i,j) =
The larger the values of Rand, Jaccard and Fowlkes Mallows indices, the better are the partitioning of data.
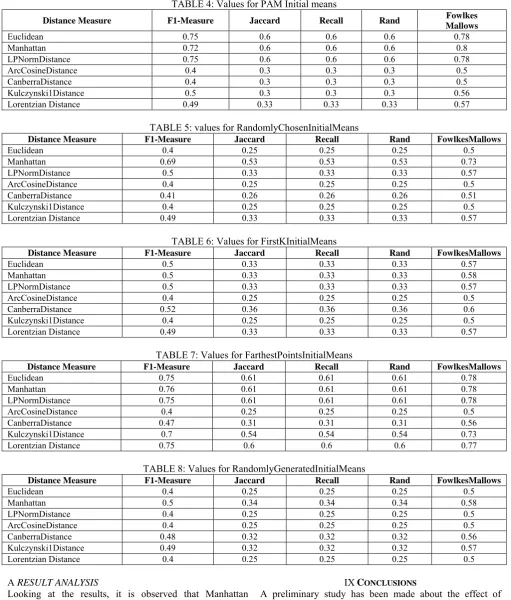
VIII RESULTS
TABLE 4: Values for PAM Initial means
Distance Measure F1-Measure Jaccard Recall Rand Fowlkes Mallows
Euclidean 0.75 0.6 0.6 0.6 0.78
Manhattan 0.72 0.6 0.6 0.6 0.8
LPNormDistance 0.75 0.6 0.6 0.6 0.78
ArcCosineDistance 0.4 0.3 0.3 0.3 0.5
CanberraDistance 0.4 0.3 0.3 0.3 0.5
Kulczynski1Distance 0.5 0.3 0.3 0.3 0.56
Lorentzian Distance 0.49 0.33 0.33 0.33 0.57
TABLE 5: values for RandomlyChosenInitialMeans
Distance Measure F1-Measure Jaccard Recall Rand FowlkesMallows
Euclidean 0.4 0.25 0.25 0.25 0.5
Manhattan 0.69 0.53 0.53 0.53 0.73
LPNormDistance 0.5 0.33 0.33 0.33 0.57
ArcCosineDistance 0.4 0.25 0.25 0.25 0.5
CanberraDistance 0.41 0.26 0.26 0.26 0.51
Kulczynski1Distance 0.4 0.25 0.25 0.25 0.5
Lorentzian Distance 0.49 0.33 0.33 0.33 0.57
TABLE 6: Values for FirstKInitialMeans
Distance Measure F1-Measure Jaccard Recall Rand FowlkesMallows
Euclidean 0.5 0.33 0.33 0.33 0.57
Manhattan 0.5 0.33 0.33 0.33 0.58
LPNormDistance 0.5 0.33 0.33 0.33 0.57
ArcCosineDistance 0.4 0.25 0.25 0.25 0.5
CanberraDistance 0.52 0.36 0.36 0.36 0.6
Kulczynski1Distance 0.4 0.25 0.25 0.25 0.5
Lorentzian Distance 0.49 0.33 0.33 0.33 0.57
TABLE 7: Values for FarthestPointsInitialMeans
Distance Measure F1-Measure Jaccard Recall Rand FowlkesMallows
Euclidean 0.75 0.61 0.61 0.61 0.78
Manhattan 0.76 0.61 0.61 0.61 0.78
LPNormDistance 0.75 0.61 0.61 0.61 0.78
ArcCosineDistance 0.4 0.25 0.25 0.25 0.5
CanberraDistance 0.47 0.31 0.31 0.31 0.56
Kulczynski1Distance 0.7 0.54 0.54 0.54 0.73
Lorentzian Distance 0.75 0.6 0.6 0.6 0.77
TABLE 8: Values for RandomlyGeneratedInitialMeans
Distance Measure F1-Measure Jaccard Recall Rand FowlkesMallows
Euclidean 0.4 0.25 0.25 0.25 0.5
Manhattan 0.5 0.34 0.34 0.34 0.58
LPNormDistance 0.4 0.25 0.25 0.25 0.5
ArcCosineDistance 0.4 0.25 0.25 0.25 0.5
CanberraDistance 0.48 0.32 0.32 0.32 0.56
Kulczynski1Distance 0.49 0.32 0.32 0.32 0.57
Lorentzian Distance 0.4 0.25 0.25 0.25 0.5
A RESULT ANALYSIS
Looking at the results, it is observed that Manhattan distance seems to be the best distance function to be used in kmedoids for the given data. All the validity indices gave consistently high values when the initialization method used was farthest point initial means.
IXCONCLUSIONS
REFERENCES
[1] Elke Achtert, Hans-Peter Kriegel, Erich Schubert, Arthur Zimek, Interactive Data Mining with 3D-Parallel-Coordinate-Trees. Proceedings of the ACM International Conference on Management of Data (SIGMOD), New York City, NY, 2013, June 22-27, 2013 [2] Sesham Anand, Sai Hanuman A, Dr. Govardhan A, and Dr.
Padmanabham P, Application of Data Mining Techniques to Transportation Demand Modelling Using Home Interview Survey
Data, International Conference on Systemics, Cybernetics and
Informatics 2008.
[3] Sesham Anand, Sai Hanuman A, Dr. Govardhan A, and Dr. Padmanabham P, Use of Data Mining Techniques in understanding Home Interview Surveys Employed for Travel Demand Estimation, International Conference on data Mining(DMIN ’08) at Las Vegas, USA, 2008
[4] Sai Hanuman A, SeshamAnand, Dr. Vinaybabu A, Dr. Govardhan A and Dr. Padmanabham P, Efficient Use of Open Source Software for Knowledge Discovery from Complex Databases, 2009 IEEE International Advance Computing Conference (IACC 2009)Patiala, India, 6–7, March 2009.
[5] Sesham Anand, Dr P. Padmanabham, Dr. A Govardhan, Dr. A. Sai Hanuman, Performance of Clustering Algorithms on Home Interview Survey Data Employed for Travel Demand Estimation, International Journal of Computer Science and Information Technologies, Vol. 5 (3) , 2014, 2767-2771.
[6] Kaufman, L., and Rousseeuw, P.J, Clustering by means of medoids, Statistical Data Analysis based on the L1 Norm, edited by T. Dodge, Elsevier/North-Holland, Amsterdam, pp 405-416.
[7] J. B. MacQueen, Some methods for classification and analysis of multivariate observations, L. M. Le Cam and J. Neyman, editors, Proceedings of the 5th Berkeley Symposium on Mathematical Statistics and Probability, pages 281–297, University of California Press, 1967.
[8] Elena Deza, Michel-Marie Ddeza, Dictionary of Distances, Elsevier 2006.
[9] Rui Xu, Donald L. Wunsch, II, Clustering, IEEE Press, John Wiley & Sons Publications, 2009, ISBN: 978-0-470-27680-8,
[10] Rand, W Objective criteria for the evaluation of clustering methods. Journal of the American Statistical Association, 66: 846 – 850. [11] Fowlkes, E. and Mallows, C. A method for comparing two
hierarchical clustering. Journal of the American Statistical Association, 78: 553 – 569.